Implementation of an Automatic End Tidal
Carbon Dioxide Disorder Detection System
using K-Means Clustering on an Embedded
Platform
Lakshmi Nandakumar
Assistant Professor, Dept. of EIE, Federal Institute of Science and Technology, Cochin, Kerala, India
ABSTRACT: Capnography is a non-invasive continuous analysis method for the concentration of CO2 in a respiratory
cycle. The paper presents an embedded system for classification of ETCO2 waveforms. In conventional methods, a real
time expert deciphers the waveform to determine the patient's status. The classification was done by extracting features from sampled waveforms and using K-means clustering Algorithm. The detected abnormalities and waveform were displayed by using a Graphical User Interface (GUI) on the embedded portable platform. A patient database was also created on the ARM board using SQLite. The average accuracy of the system was found to be 95.92%.
KEYWORDS: Capnography, End Tidal carbon Dioxide (ETCO2), K- Means Clustering, ARM, Embedded system
I.INTRODUCTION
Capnography is used in operating room as a sensitive and accurate measurement technique for detecting respiratory
abnormalities and malfunctioning of ventilation devices. Capnography measures CO2 concentration in breath out. It is
the measurement of CO2 percentage in air or partial pressure of CO2 in air. The unit of measurement is mmHg. [1].
Medical industries are now being more focused on portable embedded technology which is useful for measuring at client bed side. Developing such a system not only helps in diagnosing lung diseases but also to detect if the patient’s condition is deteriorating during major surgeries [2, 3]. At present the diagnosis is carried out by visual inspection. This paper presents a novel automated system on an embedded platform which uses K-means clustering algorithm which is low cost yet accurate.
II. LITERATURE SURVEY
III.SYSTEM DESCRIPTION – SOFTWARE
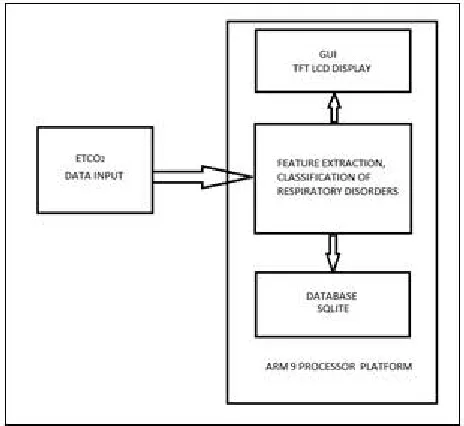
The fig 1 shown below shows the basic block diagram of ETCO2 disorder detection system. The software of the system
has mainly 4 parts - feature extraction algorithm, classification algorithm, GUI and database. The parameters are extracted from the signal and were interpreted and classified using K-Means algorithm [6,7]. The parameters, abnormality and extracted features were displayed on a GUI. A database is maintained to store the patient information and results. The software section is described in detail in the following sections.
Fig 1 Block diagram representation of the implemented system
EXTRACTION OF FEATURES: The data for testing was collected from capnobase.org, which is an online database of capnogram readings [9]. A typical capnogram is shown in fig 2.
Fig 2: A typical capnogram waveform simulated using data from capnobase
SR= (S2/S1)*100 (1)
ANGLE ALPHA: It is intersection angle between S1 and S2. The Hjorth parameters i.e., activity, mobility and complexity are also extracted. Activity is the squared standard deviation of the amplitude of the waveform. It is represented as
Amplitude A=a0 (2) where a0 is variance or mean power of signal
MOBILITY: Mobility is calculation of the standard deviation of the slope with reference to the standard deviation of the amplitude. It is represented by
C = [a2/a0]1/2 (3) where a2 is the variance of the 1st derivative of the signal.
COMPLEXITY: It gives the measure of excessive details. It is given by
C = [a4/a0]1/2 (4) The three parameters – activity, mobility and complexity are known as Hjorth parameters. The height and baseline of capnogram are also extracted
K-MEANS CLUSTERING : The features used in classification are activity, height, mobility, and complexity, S1, S2 and SR. The data set was partitioned into K-Clusters and data points are randomly assigned to clusters so that the clusters have same number of data points. Calculation of distance from each data point to cluster is done. If data point is closest to its own cluster, it is left where it is. Else it is moved to the closest cluster. The above process is repeated till no data point needs to be moved from its cluster. Cluster1 was taken as hypoventilation, cluster 2 as regular ventilation, and cluster 3 as obstructive ventilation. The algorithm was simulated in Linux OS and the 2 program modules were written in C language.
GUI: The graphical user interface was implemented using QTCreator. It is a cross platform C++ integrated development environment [11]. The various pushbuttons designed on GUI are for displaying patient details, saving patient details on database, clearing fields to enter the patient name and id. A button was also provided to quit the application.
DATABASE: The database used to store the patient details in the embedded portable device was SQLite. It is a software library that implements a self contained, server-less, zero configuration, and transactional SQL database engine [12].
IV. IMPLEMENTATION ON EMBEDDED PLATFORM
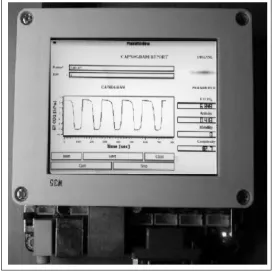
Most of the medical devices are now implemented on embedded platforms to lower cost, ease of use, portability etc. The hardware used for this application was MINI 2440, a single board computer. The SBC chosen has S3C2440 A, a 32 bit microcontroller based on ARM920T processor. The host processor used was x86[13]. The cross development tool chain for the target architecture is arm-linux-gcc. The tool chain was installed in the PC for cross compilation of application programs.
Fig 3: Application running on ARM based board booted with Linux OS
V. RESULT AND DISCUSSION
Seven features were extracted from the capnogram signal of each patient. For testing the application, the data were taken from capnobase.org. The application was first simulated using Octave tool. The extracted features are used to identify the respiratory abnormality by classification using K-Means Clustering algorithm. The results obtained after k-means clustering algorithm is shown in table 1. For testing the application, features of 49 patients were used. The accuracy of the application on an embedded platform was calculated by comparing with an expert’s manual diagnosis.
Table 1: Accuracy of developed system
Disease Accuracy
Regular ventilation 100%
Hypoventilation 90%
Obstructive 88.89%
Average 95.92%
VI.CONCLUSION
An embedded system for ETCO2 disorder detection system using K-means Classification on Embedded platform was
ACKNOWLEDGEMENT
The author would like to express sincere thanks to the Head and technicians of PFT department, AIMS, Cochin for providing their valuable knowledge about the diseases and clinical interpretation of graphs.
REFERENCES
[1] Tan Teik Kean, A. H.Teo, M.B.Malarvili, “Feature Extraction of Capnogram for Asthmatic Patient”, in Proc of Second International
Conference on Computer Engineering and Applications, pp. 251-255, 2010
[2] W.T. Frazier, “Review: Capnography and mass spectrometry in anesthesia”, Proceedings of the Annual International Conference of the IEEE
Engineering in Medicine and Biology Society, 1988, Pg 1767
[3] O.V.Grishin et. al., “Feasibility of a capnometry device for respiratory biofeedback in patients undergoing coronary artery bypass graft surgery”, in Proc. of 2015 International Conference on Biomedical Engineering and Computational Technologies, pp. 22-26, 2015
[4] V Pinskiy, N. Mori, Harsh Shah, “Capnography Guided Intubation”, in Proceedings of the IEEE 32nd Annual Northeast Bioengineering
Conference, 2006, pp. 101-102
[5] Rebecca J.M et al, “Automated Quantitative Analysis of capnogram shape for COPD –normal and COPD –CHF classification”, in IEEE
Transactions on Biomedical Engineeering, Vol 61, Issue 12,pp 2882-2890, Dec 2014
[6] Junjie Wu, Advances of K- Means Clustering Algorithm, Springer Thesis, 2012
[7] Ulrike Von Luxburg, “Clustering Stability”, Now Publishers Inc, 2010
[8] Abubakar Abid; Rebecca J. Mieloszyk; George C. Verghese; Baruch S. Krauss; Thomas Heldt ,” Model-based estimation of pulmonary
compliance and resistance parameters from time-based capnography “, Proceedings of 37th Annual International Conference of the IEEE Engineering in Medicine and Biology Society (EMBC), 2015, p.p 1687 – 1690
[9] Tan Teik Kean, M.B.Malarvili, “Analysis of capnography for asthmatic patient”, in Proc. of 2009 IEEE International Conference on Signal
and Image Processing Applications, pp. 464-469, 2009
[10] (2010) CapnoBase website[Online], http://www.capnobase.org/
[11] Daniel Molkentin, ―The Book of Qt4 The art of building Qt applicationsǁ, Open Source Press GmbH, 2007
[12] (2011) The SQLite website. [Online]. http://www.sqlite.org/