OFDM
System PAPR Reduction Using Pulse Shaping
1
Ashutosh Dwivedi 2 Kapil Gandhi 3Munendra Kumar
1
Assistant Professor MIT Moradabad 2
Assistant Professor MIT Moradabad 3
Assistant Professor Mewar University Rajasthan
Abstract: The peak to average power ratio of the time domain envelope is an important parameter at the physical layer of the communication system using OFDM signalling. The signals must maintain a specified average energy level in the channel to obtain the desired Bit-error- rate. The peak signal level relative to that average defines the maximum dynamic range that must be accommodated by the components in the signal flow path to support the desired average. High Peak to Average Power Ratio (PAPR) for MIMO-OFDM system is still a demanding area and difficult issue. The radio transmitter stations for covering and getting enough transmitted power in their desired area has to use High Power Amplifier (HPA). Therefore due to the high PAPR of input signals, a factor which is called memory-less nonlinear distortion will affect the communication channels. the OFDM receiver’s efficiency is sensitive to the HPA. If the high power amplifier doesn’t work in linear region, it can cause the out-of-band power to be kept under the specified limits. This condition can cause inefficient amplification and expensive transmitters, thus it is necessary to investigate PAPR reduction techniques for MIMO-OFDM
system. Some of the performance measures like
Complementary Commutative Distribution Function of PAPR and BER are analysed through simulation to demonstrate the efficacy of the proposed scheme.
Keywords: Orthogonal Frequency Division Multiplexing (OFDM), Peak– to-Average Power Ratio (PAPR), High Power Amplifier (HPA), Clipping and Filtering, DFT Spreading, Partial Transmit sequence (PTS), Probability Distribution Function (PDF).
1. I
NTRODUCTIONOFDM is an attractive technique for high data rate wireless communication systems, but it exhibits a large peak-to-average power ratio (PAPR), due to the superposition of the individual nonlinear region of High Power Amplifier (HPA) [1-3], and the signal distortion induces the degradation of Bit Error Rate (BER). Therefore, RF power amplifiers should operate in a very large linear region to avoid the signal peaks from getting into the non-linear region of the power amplifier causing in-band distortion. i.e., inter modulation among the subcarriers and out of band radiation. To overcome this, the power amplifiers should be operated with a large power back-offs and this indirectly leads to very inefficient amplification and increases in transmitter power. OFDM systems, several PAPR reduction schemes have been proposed to solve this problem [6&7]. One of the most widely used methods is Clipping and Filtering, DFT Spreading using probabilistic methods [3]. The principle of probabilistic method depends on reducing the probability of high PAPR by generating several OFDM symbols (multiple candidates)
carrying the same information and selecting the one having the lowest PAPR [2]. The probabilistic method can also be classified into two strategies: sub block partitioning strategy and entire block strategy. The sub block partitioning strategy, such as partial transmits sequence (PTS) [8-9], divides frequency domain signals into several sub blocks. On the other hand, the entire block Strategy, such as Clipping and Filtering, DFT Spreading, [5–8] consider the entire block for generating multiple candidates. First, the entire block strategy of the probabilistic methods to generate multiple candidates is considered, then the probability Distribution Function (PDF) for the multiple candidate system is analysed. When the candidate having the lowest PAPR is selected, the PDF of the amplitude of a selected OFDM symbol becomes a function of the number of candidates [1-4]. Throughout this paper we describe the basic principle of all these techniques. The selection of any of the PAPR reduction techniques may be at the cost of PAPR reduction capability, synchronization between the transmitter and the receiver. The absence of the PAPR reduction techniques will cause the increase in the transmit power, the in Bit error rate at the receiver, the data rate loss, and the computational complexity. Here we have studied through simulation results the performance of PTS and Clipping and Filtering, DFT Spreading based PAPR reduction techniques for these techniques based on various parameters [8].
2. PRINCIPAL ALGORITHM FOR
REDUCING PAPR
An OFDM signal consists of a number of independently modulated sub- carriers, which can give a large PAPR when added up coherently. When N signals are added with the same phase, they produce a peak power that is N times the average power of the signal. So OFDM signal has a very large PAPR, which is very sensitive to non- linearity of the high power amplifier. PAPR is a historic issue in the development of the Wireless communication, the more PAPR of OFDM the more requirements and challenges for implementing the HPA. However the PAPR is calculated from the peak-amplitude of the waveform divided by the average value of the waveform as follows:
2 0
2
maX t nT X
n PAPR def
E X
n
≤ ≤
(1)
The amplitude of has a Rayleigh distribution, while the power has a central chi-square distribution with two degrees of freedom. The distribution of PAPR states in the term of a Complementary Cumulative Distribution Function (CCDF).
0
Pr(PAPR PAPR A)
CCDF= < = (2) Assume PAPR0=A
0 0
2 0
(PAPR ) Pr PAPR
2
X
maX t nT X
n F E X n ≤ ≤
= <
1 exp( PAPR )= − − 0 (3)
0 0
Pr(PAPR PAPR ) 1F (PAPR )X N
CCDF= > =
0
1 (1 exp( PAPR ))= − − − N (4) The decibel form for Equation (4) is as following:
10
PAPRdB=10log (PAPR) (5)
Although the probability of the largest PAPR to happen is not high, but for sending the high PAPR of OFDM signal without any distortion the probability increases. all the linearity in High Power Amplifier (HPA) and A/D converter should meet the requirements mentioned above [1-3]. Since the equipment that meets these necessities is very expensive, consequently, it is very demanding and important to reduce PAPR in OFDM system.
3. PAPR AND ITS REDUCTION IN
OFDM SYSTEMS
The complex discrete-time baseband equivalent time domain OFDM signal can be expressed as:
1 2 0 1
X (t) N,0
T
n
j f t
N n
n
X e t nT
N
π
−
=
=
∑
≤ ≤ (6)Where NT transmit an antenna that uses N subcarriers.
With OFDM modulation, a block of n data symbols (one
OFDM symbol), {xn, n = 0, 1… n-1} will be
transmitted in parallel such that each symbol modulates a different subcarrier from a set {fN , N = 0, 1… N-1} .
The N subcarriers are orthogonal, i.e. fN= N∆f where
f
∆ = 1/nT and T is the symbol period. The above power characteristics can also be described in terms of their magnitudes (not power) by defining the crest
factor (CF) as:
Pass Band Condition: CF= PAPR (7) In the PSK/OFDM system with N subcarriers, the maximum power occurs when all of the N subcarrier components happen to be added with identical phases. Assuming that E
{ }
Xn2 =1. It results in PAPR = N, thatis, the maximum power equivalent to N times the average power. we have noticed that more PAPR is resulted in case the M-QAM is greater than 4 times M-ray PSK. Meanwhile, the probability of the occurrence of the maximum power signal decreases as N increases. In equation (6) the real and imaginary components evaluate the expectation and variance of them and then after applying Central limit theorem for large N, the probability distribution of xn will follow the Gaussian distribution.
The amplitude of OFDM signal has a Rayleigh distribution with zero mean and a variance of N times the variance of one complex sinusoid. Let {Zn} be the magnitudes of complex samples. Assuming that the average power of complex pass band OFDM signal xn is equal to one, the
{Zn} are the normalized Rayleigh random variables with its own average power, which has the probability density function [4-9] as shown below:
2
2
2 2
F (z) 2
2 n
z z
Z σz e σ ze
− −
= = (8)
Where
{ }
2 2E Zn =2σ , Note that the maximum of Zn is
equivalent to the crest factor (CF) defined in Equation (8). Let Zmaxdenote the crest factor. Now, the cumulative
distribution function (CDF) of Zmax is given as:
max
2 max
0 1 1
F (z) (z z)
(z z). (z z).... (z z) (1 e ) Z
z N N
P
P P P − −
= <
= < < < = − (9)
In order to find the probability that the crest factor (CF) exceeds z, we consider the following complementary CDF (CCDF) [8]:
max 2
max max
F (z) (z z) 1 (z z)
1 (1 e )
Z
z N
P P
−
= > = − <
= − − (10)
This is derived under the assumption that N samples are independent and N is sufficiently large, they do not withstand the band limited or oversampled signals. It is due to the fact that a sampled signal does not necessarily contain the maximum point of the original continuous-time signal. However, it is difficult to derive the exact CDF for the oversampled signals and therefore, the following simplified CDF will be used:
2
F (z) 1 (1 e )
z
z N
Z
α
−
= − − (11)
Where α has to be determined by fitting the theoretical CDF into the actual one using simulation results, it has been shown that α=2.8 is appropriate for sufficiently large N.
4. PAPR REDUCTION TECHNIQUES
4.1 Clipping and Filtering
The clipping approach is the simplest PAPR reduction scheme, which limits the maximum of transmit signal to a pre-specified level. However, it has the following drawbacks are Clipping causes in-band signal distortion, resulting in BER performance degradation. Clipping also causes out-of-band radiation, which imposes out-of-band interference signals to adjacent channels. Although the out-of-band signals caused by clipping can be reduced by filtering, it may affect high-frequency components of in-band signal (aliasing) when the Clipping is performed with the Nyquist sampling rate in the discrete-time domain. However, if clipping is performed for the sufficiently-oversampled OFDM signals (e.g., L ≥ 4) in the Discrete-time domain before a low-pass filter (LPF) and the signal passes through a band-pass filter (BPF), the BER performance will be less degraded [2].Filtering the clipped signal can reduce out-of-band radiation at the cost of peak regrowth. The signal after filtering operation may exceed the clipping level specified for the clipping operation. block diagram of a PAPR reduction scheme using clipping and filtering, where L is the oversampling factor and N is the number of subcarriers. In this scheme, the L-times oversampled discrete-time signal '
[ ]
X m is
generated from the IFFT of Equation ( '
[ ]
X k with N. L-1
zero-padding in the frequency domain) and is then modulated with carrier frequency fc to yield a passband
signal P
[ ]
x m . Let P
[ ]
cx m denote the clipped version of
[ ]
Px m , which is expressed as
[ ]
[ ]
[ ]
[ ]
[ ]
pP p p
c
p
x m A
A
x m x m x m A
A x m A
− ≤ −
= <
≥
(12)
[ ]
[ ]
[ ]
[ ]
[ ]
.p p
p P
c
p
x m if x m A
x m
x m
A otherwise
x m
<
=
(13)
where A is the pre-specified clipping level. Let us define the clipping ratio (CR) as the clipping level normalized
by the RMS value σ of OFDM signal, such that CR A
σ
= .
It has been known that σ = N and σ= N2 in the baseband and passband OFDM signals with N subcarriers, respectively.
Fig. 4.1 Block diagram of a PAPR reduction scheme using clipping and filtering.
4.2 DFT Spreading
The DFT-spreading technique is to spread the input signal with DFT, which can be subsequently taken into IFFT. This can reduce the PAPR of OFDM signal to the level of single-carrier transmission. This technique is particularly useful for mobile terminals in uplink transmission. It is known as the Single Carrier-FDMA (SC-FDMA), which is adopted for uplink transmission in the 3GPP LTE standard [4–7]. DFT of the same size as IFFT is used as a (spreading) code. Then, the OFDMA system becomes equivalent to the Single Carrier FDMA (SC-FDMA) system because the DFT and IDFT operations virtually cancel each other [5]. In this case, the transmit signal will have the same PAPR as in a single carrier system. In OFDMA systems, subcarriers are partitioned and assigned to multiple
mobile terminals (users). Unlike the downlink
Transmission, each terminal in uplink uses a subset of subcarriers to transmit its own data.The rest of the subcarriers, not used for its own data transmission, will be filled with zeros. Here, it will be assumed that the number of subcarriers allocated to each user is M. In the DFT-spreading technique, M-point DFT is used for DFT-spreading, and the output of DFT is assigned to the subcarriers of IFFT. The effect of PAPR reduction depends on the way of assigning the subcarriers to each terminal [6]. Here, the input data x m
[ ]
is DFT-spread to generate X[i] and then, allocated as[ ]
. 1, 1 0,1, 2,..., 10
k
X k s m m M
s x k
otherwise
= = −
=
(14)
The IFFT output sequence with n=M.s + m for
s=0,1,2,….,s-1 and m=0,1,2,…..,M-1 can be expressed as
(15)
which turns out to be a repetition of the original input
signal scaled by in the time domain [9]. In the
IFDMA where the subcarrier mapping starts with the rth
subcarrier , the DFT-spread symbol can
be expressed as
(16)
Then, the corresponding IFFT output sequence, is given By
(17)
that the frequency shift of subcarrier allocation starting point by r subcarriers results in the phase rotation of
in IFDMA.
Fig. 3.4 Equivalent of OFDMA system with DFT Spreading code to a single-carrier System[2].
5. SIMULATION RESULTS
5.1 Clipping and Filtering Simulation Result
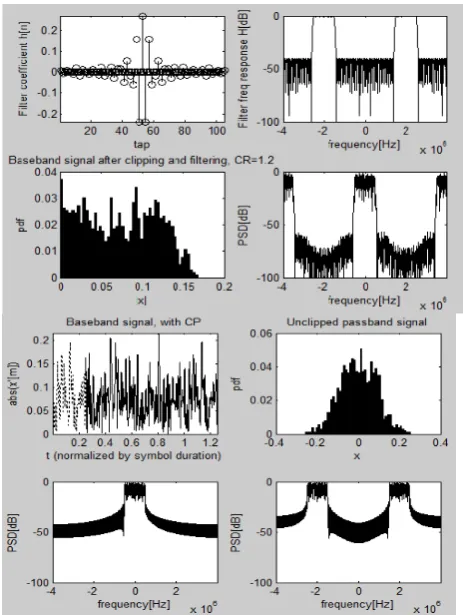
Figure 5.1(a) shows the CCDFs of crest factor (CF) for the clipped and filtered OFDM signals. Recall that the CCDF of CF can be considered as the distribution of PAPR since CF is the square root of PAPR [3]. It can be seen from this figure that the PAPR of the OFDM signal decreases significantly after clipping and increases a little after filtering. Note that the smaller the clipping ratio (CR) is, the greater the PAPR reduction effect is. Figure 5.2(b) shows the BER performance when clipping and filtering technique is used. Here, “C” and “C&F” denote the case with clipping only and the case with both clipping and filtering, respectively. It can be seen from this figure that the BER performance becomes worse as the CR decreases.
Fig. 5.1 Histograms (PDFs) and power spectra of OFDM signals with clipping and filtering (
CR
=
1.2
)Fig.5.2 PAPR distribution and BER performance with clipping and filtering.
5.2 DFT Spreading Simulation Result
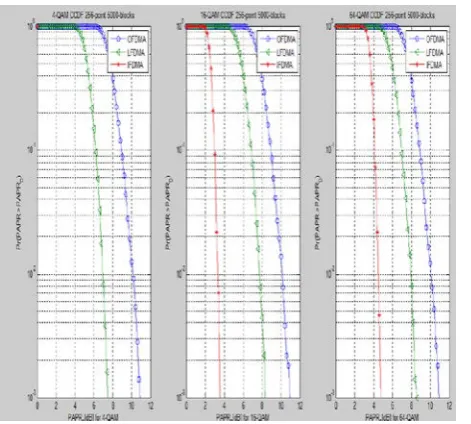
Figure 5.3 shows a comparison of PAPR performances when the DFT-spreading technique is applied to the IFDMA, LFDMA, and OFDMA. Here, QPSK, 16-QAM, and 64-QAM are used for an SC-FDMA system with N=256, M=64 and S=4. It can be seen from Figure 5.4 that the PAPR performance of the DFT-spreading technique varies Depending on the subcarrier allocation method. In the case of 16-QAM [2-6], the values of PAPRs with IFDMA, LFDMA, and LFDMA for CCDF of 1% are 3.5dB, 8.3dB, and 10.8dB, respectively. It implies that the PAPRs of IFDMA and LFDMA are lower by 7.3dB and 3.2dB, respectively, than that of OFDMA with no DFT spreading.
Fig.5.3 PAPR performances of DFT-spreading technique for IFDMA, LFDMA, and OFDMA.
5.3 DFT-Spreading technique with pulse shaping Simulation Result
Now, let us see how the PAPR performance of DFT spreading technique is affected by the number of subcarriers, M, that are allocated to each user. Figure 5.4 shows that the PAPR performance of DFT-spreading technique for LFDMA with a roll-off factor of α=0.4 is degraded as M increases [4-9], for example, M=4 to 128. Here, 64-QAM is used for the SCFDMA system with 256-point FFT (N=256) in Fig.5.4.
Fig.5.4 PAPR performance of DFT-spreading technique when M varies.
6. CONCLUSION
that exist in OFDM wireless communication system. High Peak-Average Power Ratio (PAPR of OFDM signal), and discusses how to reduce it by different effective system. High Peak-Average Power Ratio (PAPR of OFDM signal), and discusses how to reduce it by different effective algorithms. We are mainly focusing on the signal scrambling technology, and discuss it by observing the MATLAB simulation results. In the signal scrambling technology, we study the method of selected mapping and partial transmit sequence. A series of detailed simulations were conducted for comparison and results were obtained of the two schemes for PAPR reduction in a complex system. These methods have disadvantages, although they are used in optimizing the statistical characteristics of PAPR in MIMO-OFDM system. For the inherent defect of traditional PTS algorithm, complex computing, a very effective iterative method is introduced to determine sub-optimal weighting factor for each sub-block instead of conducting an ergodic searching so as to reduce the calculation complexity significantly. This sub-optimal algorithm gives a better approach to the real conditions in engineering practice by providing a compromise between the PAPR reduction performance and computational complexity.
7. REFERENCES
1. van Nee, R.D.J. (Nov. 1996) OFDM codes for peak-to- average power reduction and error correction. IEEE GTC, London, vol. 2, pp. 740–744.
2. Davis, J.A. and Jedwab, J. (1999) Peak-to-mean power control in OFDM, Golay complementary sequences, and Reed-Muller codes. IEEE Trans. Info. Theory, 45(7), 2397–2417.
3. Davis, J.A. and Jedwab, J. (1997) Peak-to-mean power control and error correction for OFDM transmission using Golay sequences and Reed-Muller codes. Electron. Lett., 33(4), 267–268.
4. Urbanke, R. and Krishnakumar, A.S. (Oct. 1996) Compact description of Golay sequences and their extensions. Proc. of the Thirty-Fourth Annual Allerton Conference on Commun., Control and Computing Pagination, Urbana, IL, pp. 693–701.
5. Li, X. and Ritcey, J.A. (1997) M-sequences for OFDM peak-to-average power ratio reduction and error correction. Electron. Lett., 33(7), 554–555.
6. Tellambura, C. (1997) Use of m-sequences for OFDM peak-to-average power ratio reduction. Electron. Lett., 33(15), 1300–1301.
7. Park, M.H. et al. (2000) PAPR reduction in OFDM transmission using Hadamard transform. IEEE ICC’00, vol. 1, pp. 430–433.
8. Bauml, R.W., Fischer, R.F.H., and Huber, J.B. (1996) Reducing the peak-to-average power ratio of multicarrier modulation by selective mapping. Electron. Lett., 32(22), 2056–2057.
9. hkubo, N. and Ohtsuki, T. (Apr. 2003) Design criteria for phase sequences in selected mapping. IEEE VTC’03, vol. 1, pp. 373–377.
10. Muller, S.H. et al. (1997) OFDM with reduced peak-to-
average power ratio by multiple signal representation. In Annals of Telecommun., 52(1–2), 58–67.