J. Phys. UTM. Vol. 3. (2 0 0 8 ) 1-7
PR ESSU RE CH ANGE PROFILE FROM LASER IND UC ED SH OCKW AVE USING INTERFERO M ETER AND INTENSITY M APPING
Asiah Yahaya and Y usof Munajat Physics Department, Faculty o f Science
Universiti Teknologi Malaysia, 81310 UTM Skudai, Johor, Malaysia Email: [email protected]
ABSTRACT
Pressure change due to laser interaction can be measured using fringe analysis method which is reliable and accurate but rather time-consuming and also by the intensity mapping method which is a very fast and efficient but quite often plagued with phase ambiguity. In this work, the intensity mapping method was specially designed to eliminate phase ambiguity. Both methods o f analysis are based on Abel inversion technique. Initially fringe analysis was seem to be more reliable but by around 5 (is delays both methods seemed to reach an agreeable value. The maximum pressure obtained from fringe analysis is 0.33 atm correspond to radius o f 2.738 mm and from intensity mapping method is 0.244 atm corresponding to 2.526 mm.
Keywords: phase measurement, Fourier transform, fringe deviation, intensity distribution, Abel
inversion, laser interaction
INTRO DUCTIO N
Laser interferometry is one o f the most commonly used techniques for high-resolution measurements. A common property o f the methods is that they produced fringe pattern as the output. Phase measurement o f the output fringes is measured by the deviation between two waveflelds which is recorded on the interferogram. The sensitivity o f this method is a fraction o f the wavelength o f the illumination source. The phase o f a fringe carries a lot of information about the subject. Advanced hardware and software technologies allow the online connection between the digital image processors and the optical test equipments. The absolute shape as well as the deformation due to any disturbance can be measured by phase evaluation o f the fringes
In this work, the pressure change due to laser interactions were measured using two methods; the fringe analysis method and the intensity mapping method. Both methods relies on analysis based on Abel inversion technique [1], A system was built incorpo rating a three-outputs interferometer, a trigger unit and a fast photography unit to capture the events. Pressure change profiles of the two methods were produced
M ETHO DO LO GY
J. Phys. UTM. Vol. 3. (2 0 0 8 ) 1-7
DYE m - X M,
W4
m2 V
■f r
sample'-BS2
compensator
BS4
YAG
BS3 Ai
CCD1
A3
^ --- (— CCD3
A2 CCD2
Figure 1: The M ach Zehnder interferometer
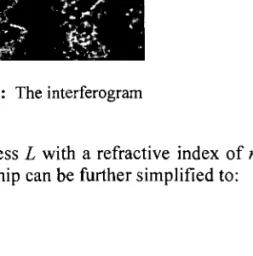
Figure 2 shows an example of the interferogram o f laser interaction which was captured by the monochrome CCD camera. It was captured 3.6 (xs after the initial trigger of the Nd:YAG laser. The interference fringes were produced by the Nitro-dye laser. The fringe deviation from the initial straight and parallel fringes is due to Nd:YAG interaction. The deviation of the fringes indicates the change in the phase as the refractive index of the media changes due to laser interaction.
The relation between the fringe deviation AF, and the refractive index, n, can be
written as [3]:
A F (x ,y )= \{ n { x ,y ,z ) - n x }dz (2.1)
■'i
where F(x,y) is the undisturbed fringe separation.
Figure 2: The interferogram
If the sample has a uniform thickness L with a refractive index o f n(x,y) which does not vary in the z direction, the relationship can be further simplified to:
J. Phys. UTM. Vol. 3. (2 0 0 8 ) 1-7
A n {x,y)= (2 .2)
L
A F ( \
where A f( x ,y ) = — -— is called the fringe shift. Thus the refractive index is pro-
F \x ,y )
portional to the fringe shift. The theoretical relationship between the refractive index n of a medium and its density p is described by the so-called Clausius-Mossotti equation
n2-1
n z + 2 = K 'p (2.3)
The constant K ’ is dependent on the molecular properties o f the material and the
frequency of the incident radiation. In liquids and gases where the refractivity, n- 1 is small, the relationship between the refractive index and its density p can be simplified further to give the well-known Gladstone-Dale relation;
n - \ = K p (2.4)
where K = 3K ’/2. The change in the refractive index An can also be expressed as the
change in its density, Ap;
An = K Ap (2.5)
The above relationship is accurate for pressures up to approximately 100 bars [4], Usually, it is more convenient to express the changes in the density o f a sample, as the changes in its pressure. Since the pressure, usually generated in the laboratory is less than 100 bars, a constant of proportionality between two variables pressure, P and density, p is assumed. Thus, a modified Galdstone-Dale relationship becomes;
An = CAP (2.6)
where the constant C = — and the unit is bar'1, and c is the speed o f sound. From here, it c
is clear that the change in the refractive index is proportional to the change in pressure of the medium.
ANALYSIS
Fringe Analysis
The deviation o f the fringes at the center o f the interferogram is due to change in phase as the acoustic wave propagated after interaction with Nd:YAG laser. Due to the symmetrical nature o f the wave propagation (disturbance), the image can be divided into several concentric zones which then again be divided into several chordal divisions (Figure 3). Fringe deviations were made from the selected reference. The best reference would be a line running through the center of a dark fringe from the undisturbed region of
J. Phys. UTM. Vol. 3. (2 0 0 8 ) 1 -7
measured from this reference at certain intervals (chordal divisions). Global Lab software was used in the determination of the fringe deviations. Fringe deviations were measured in the chosen half section as the other half is a mirror image o f it. Calibration factor was previously determined from the magnification factor of the image.
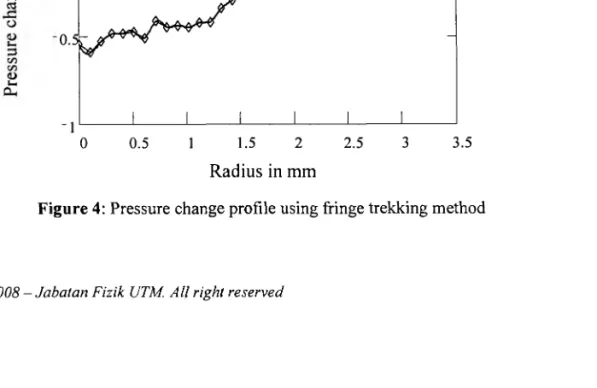
From the calibration factor which was set for this interferogram, the radius o f the disturbance shown in Figure 2 was found to be 3.245 mm. The chosen section was divid ed into 31 chordal zones and thus each zone was represented by three pixels. Increasing the number of chordal zones would smoothen the fringe shift profile thereby increasing the accuracy. The data collected using Global Lab software was fed into a computer program which was written using Mathcad 7, for the fringe shift and pressure change calculation. Figure 4 shows the pressure change profile o f half o f the interferogram through its center. The other was assumed to be a mirror image o f that. The maximum pressure change recorded with this analysis was 0.33 atm, which occur at a radius of 2.738 mm. Measurements were made using laser energy o f 3.7 mJ at room temperature of 25°.
Figure 3: Chordal devisions and fringe deviations
E
.5
<D
W) e c3 o
<D
s— CL,
Radius in mm
Figure 4: Pressure change profile u sing fringe trekking m ethod
J Phys. UTM. Vol. 3. (2 0 0 8 ) 1-7
Intensity M apping
A three-step algorithm with phase step o f 90° and a phase offset o f 45° was suggested [5], [6]. The simplified intensity equations of the three simultaneously-captured interferograms
The measured intensity distribution (I (.x,yj) o f each o f the three interferograms is then Fourier transformed to give a fitting linear combinations o f the harmonic spatial functions [7]. Only one o f the two spectral sidelobes in this frequency domain is necessary to calculate the phase. The admissable spatial frequencies o f the harmonic functions are defined via the cutoff frequencies of the bandpass filter in this domain. By means o f digital filtering, the sidelobe is filtered to remove the unwanted noise before undergoing the inverse Fourier transform to get back the a much cleaner signal in its
spatial domain. The resulting phase S(x,y) for a three-frame technique for a n/2 phase
shift as in Equation (3.1) is given by [8].
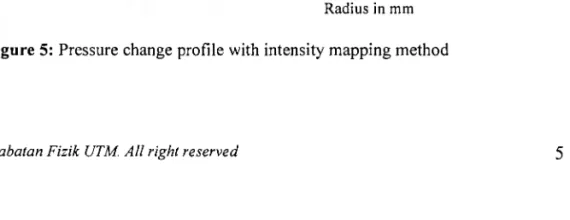
The phase change can be translated to change in refractive index and pressure change using Equations (2.1) to (2.6). The pressure change o f a half of the disturbance associated with laser interaction 3.6 (Js after triggering is as shown in Figure 5. The maximum change is pressure recorded using this method is 0.244 atm which occurred at a wave radius o f 2.526 mm. Measurements were made at laser energy o f 3.7 mJ at room temperature. The profile indicated in Figure 5, represents the same change at the same instant as that produced in Figure 4. Thus, the maximum pressure change obtained using this method was found to be lower than the fringe analysis method by 26%.
(3.1)
S(x, y) = arctan —
-' 1 ,1
-(3.2)
0.5
E 0.2 44
cd
C 0
c C3
o Urn 3
- 0 . 5
- 1
0 4
Radius in mm
J. Phys. UTM. Vol. 3. (2 0 0 8 ) 1 -7
The reduction of the value o f the maximum pressure change compared with fringe analysis could be due to the filtered nature of the images being analyzed using intensity mapping method. With simultaneous phase mapping, the images were digitally filtered to remove the unwanted noise, before analyses were made. During this process, part of the signal could have been removed.
Measurements were then made at other time delays to produce a profile relating the findings from the two methods.
DISCUSSION
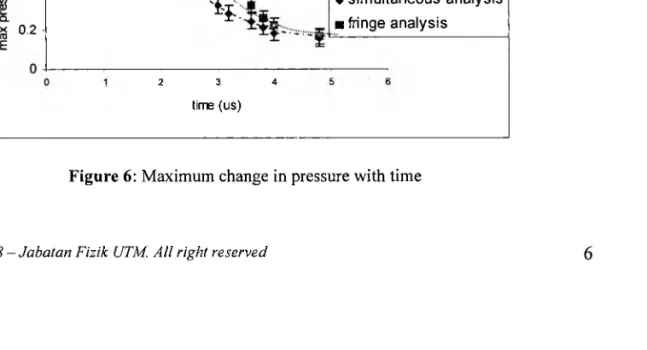
Plotting the results obtained from the two methods o f analysis summarized the con clusions o f the research. Figure 6 shows the plot o f the maximum pressure change due to laser interaction at different time delays using the two methods.
From the profiles produced, it actually shows the rapid decrease in the pressure change coming from the shock wave region toward the acoustic wave region. Actually, images could be captured at a much earlier time than the 2.0 (is, the starting point for calculation in the graph shown in Figure 6. However, as the waves at this stage were unsymmetrical, due to laser focusing, calculations were made only after the wave took up a more spherical shape.
At the beginning, fringe analysis seemed to be more reliable since it was much easier to determine fringe-centers of smaller size fringes. As the waves propagated, the sizes of the fringes in the interaction region also expanded. This meant that, there were now more pixels to represent a fringe, and thus, simultaneous analysis would be gaining accuracy
over fringe analysis. By around 5 |lxsdelays both methods seemed to reach an agreeable
stage as indicated by about the same values o f the pressure change produced. Unfortunately, after that time, the disturbances produced were larger than the selected size o f 256 x 256 pixels chosen for this analysis and therefore further analysis cannot be carried out. However, with the knowledge that sensitivity and accuracy o f the simultaneous phase mapping method relies on the number of pixels representing a fringe, we can be sure that this methods would have an advantage over fringe analysis as the waves propagated further.
0.6
0.4
-0)
Q_
0.2
-\ x -\ $
' • 1 :
2 3 4
time (us)
♦ sim ultaneous analysis
■ fringe analysis
Figure 6: M axim um change in pressure w ith tim e
The average values for both methods were presented in Figure 6 with 5% error bars. The slight deviation from the expected smooth profile could be due to the fluctuation of the laser energy burst producing the interactions.
J. Phys. UTM. Vol. 3. (2 0 0 8 ) 1-7
CO NCLUSION
With this understanding, it did not seem fair to make comparisons to the two values, especially at shorter time delays. However from the profiles obtained, both indicated rapid reduction on the maximum pressure change soon after laser interaction, which, gradually reduced to a more agreeable change by the two methods.
REFERENCES
[1] Kalal, M. and Nugent, K.A., (1988). Abel inversion using fast Fourier transform.
J. Apll Optics. 27(10): 1956-1959
[2] Osten, W. and Juptner, W. (1997). Digital Processing o f Fringe Patterns in Optical
Metrology. In: Rastogi, P.K ed. Optical Measurement Techniques and Applica
tions. Artech House, Inc, Boston. London. 51-85
[3] Yusof Munajat (1997). High speed Optical Studies fo r laser induced acoustic
wave and phase measurement interferometry system. Universiti Teknologi Malay sia: PhD Thesis.
[4] Partington, J.R.,(1953). An Advance Treaties on Physical Chemistry. Vol 4,
London: Longmans
[5] Wyant, J.C, Kaliopoulos,C.K. Bhushan, B and Goerge. O.E. (1984). An Optical
profilometer for surface characterization o f Magnetic Media. ASLE Trans. 27: 101
.
[6] Bhusan, B, Wyant, J.C, Kaliopoulos, C.L, (1985). Measurement of surface
topography o f Magnetic tapes by Mirau Interferometry. Appl. Opticss. 24: 1489.
[7] Roddier, C. and Roddier, F. (1987). Interferogam analysis using Fourier Trans
form techniques. J Appl Optics. 26(9): 1668-1673
[8] Wyant, J.C and K. Creath, Recent Advances in Interferometric Optical Testing.