CSEIT11726294 | Received : 01 Dec 2017 | Accepted : 29 Dec 2017 | November-December-2017 [(2)6: 1163-1174 ]
International Journal of Scientific Research in Computer Science, Engineering and Information Technology © 2017 IJSRCSEIT | Volume 2 | Issue 6 | ISSN : 2456-3307
1163
A Comparative Review on Pixel-Based and Object-Based
Approach for Land Cover (LC) Classification
Dapke Pratibha Purushottam*1, Prof. K. V. Kale2
1,2Department of Computer Science and Information Technology Dr. Babasaheb Ambedkar Marathwada University,
Aurangabad, Maharashtra, India
ABSTRACT
Image classification is one of the most basic techniques of digital image processing. This review focuses on the strengths and weaknesses of traditional pixel-based classification and object-based classification algorithms for the extraction of information from remotely sensed imageries. Land use/land cover (LULC) classification with high accuracy is necessary, especially in eco-environment research, urban planning, and vegetation condition study and soil management. The LULC classification remains a difficult task and it is especially challenging in heterogeneous season landscapes where such maps are of great importance. Over the last decade, a number of classification algorithms have been developed for the analysis of remotely sensed data. The most algorithms are the pixel-based classification and object-oriented classification K-Nearest Neighbours (K-NN), Support Vector Machines (SVMs), the Decision Trees (DTs) and maximum likelihood classification (MLC) etc. Generally, classifiers information extraction can be divided into three categories: a] based on the type of learning (supervised and unsupervised), b] based on assumptions on data distribution (parametric and non-parametric) and, c] based on the number of outputs for each spatial unit (hard and soft). In this research, a comparative pixel-based and object-based land cover classification was developed in which advantages and disadvantages depending upon their area of application of both pixels and objects were different. This approach makes use of both pixel and object spectral features resulting from image segmentation through a comparative mechanism to resolve the problem of spectral confusion caused by reflectance similarity of some land cover types that traditional pixel-based classification cannot resolve.
Keywords : Object-Pixel Based, SVM, DT, MLC, K-NN.
I.
INTRODUCTION
Remote sensing has as many definitions as its applications. The simplest definition of remote sensing is “acquiring of data about an object without touching it”. Remote sensing is a technique that can be used in a wide variety of disciplines, but is not a discipline or subject by itself. Since remote sensing is developing itself at a rapidly, “Remote sensing is the science, technology, and art of obtaining information about an object, area, or phenomenon by analysing data acquired by a device that is not in physical contact with the object, area or phenomenon under investigation”[1]. Remote Sensing (RS) and Geographic Information System (GIS) techniques for analysing the land use/land cover mapping including crop classification
eco-environment research, urban planning, and vegetation condition study and soil management.
Supervised and Unsupervised Classification
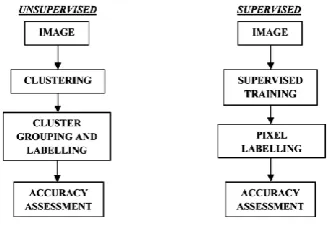
There are two types of land cover classification: 1] supervised and 2] unsupervised. In supervised classification, sample data from known categories are selected and used to train a classifier that, in turn, is applied to data of unknown categories to derive a classification. Unsupervised classification first groups all data into several clusters that are further classified in the second stage based on sample data selected based on the resulting clusters. In general, in images with high spectral separable among categories of interest, unsupervised classification is liked, whereas supervised classification is applied in images with low spectral separable [3]. This paper focus on the study of supervised data for object-based and pixel-based classification. There are three major steps involved in the supervised classification, 1] Training: The user identifies representative training areas or samples and develops a numerical description of the spectral signature of each land cover class of interesting area, 2] Classification: Each pixel in the image is classified into the land cover class based on its like to the input training pixel and if the pixel is not matching to any predefined class signature then it is classified as unknown or unclassified, and 3] Accuracy assessment: The classified image is compared with reference image or ground reference data to check the accuracy of the classification. Steps of supervised and unsupervised classification are shown in Figure 1 [4].
Figure 1. Supervised and unsupervised classification.
Pixel-based and Object-based Classification
An image object is defined as a group of pixels sharing similar spectral and/or textural properties. One of the differences between pixel-based and object-based approach relates to the processing unit. As their names show pixel-based on the pixels, while objects are the
basic unit of object-based approach. Generally, various feature classes such as shape, size, shadow, colour, association, texture, site, pattern of the objects are used for classification. Object-oriented classification based on image segmentation. That divides the image into the homogeneous objects and classifies these objects based on spatial, spectral, relational, textural and contextual information classification. The accuracy of object-oriented classification depends on the quality of the image segmentation. In this research, a comparative pixel-based and object-based land cover classification was developed in which advantages of both pixels and objects were different. This approach attempts to resolve the problems related with pixel-based classification such as spectral confusion, mixed pixels and sensitivity to noise, and to reduce the unreliability of object feature information produced by over or under segmentation of the image in object-based classification. The comparative pixel-based and object-based method reduces the unreliability of object feature information produced by over or under segmentation of the image through a comparative mechanism. The experiment shows that the comparative pixel-based and object-based approach produces higher classification accuracy than either pixel-based classification or object-oriented classification [5].
Attributes Classification Approaches
Pixel Based
Object Based Spectral/colour Used Used Form/shape Not
used
Used
Area/Size Not used
Used
Texture Not used
Used
Content Not used
Used
Table 1. Attributes used in pixel-object based approaches
Manual, Automated, Hybrid Classification
methods to do initial classification, further manual methods are used to refine classification and correct errors. Hybrid classification approaches integrate the elements of supervised and unsupervised algorithms. Several hybrid methods have also been use to improve classification accuracy [3].
Pixel-Based Versus Object-Based Classification
Volker Walter (2004), A change detection approach based on an object-based classification of remote sensing data is introduced. The approach classifies not single pixels but groups of pixels that represent. The approach is based on a supervised maximum likelihood classification. The results show that approximately 8.6% of all objects (82 objects from 951) are marked as changes. From these 82 objects, 45% are real changes, 31% are potential changes, and 23% are wrongly classified. That means that the amount of interactive checking of the data can be decreased significantly. A change in the landscape can only be detected if it affects a large part of an object because the object-based classification uses the existing object geometry. For example, a forest object has a size of 5000 m2 and in that forest object a small settlement area with 200 m2 is built up, then this approach will fail. Lastly, they also proved land-use class could be classified very accurately in pixel-based classification [6]. In addition, hierarchical clustering methods for land cover mapping problem. The hierarchical technique adopts MSC, NPSO and GSO algorithm for splitting the data set by satisfying BIC and K-means algorithm is used to merge the data set. We observe that though computationally GSO is slower than MSC and NPSO is slower than GSO, and is less efficient [7].
Immaculate Dopido (2012), Quantitative and comparative analysis of different feature extraction techniques for hyperspectral image classification, including unmixing-based and more traditional (supervised and unsupervised) approaches. The main goal is to use spectral unmixing and classification, as complementary techniques are more suitable for the classification of pixels dominated by a single land cover class, while the former are devoted to the characterization of mixed pixels. Because hyperspectral images often contain areas with both pure and mixed pixels, quantitative and comparative assessment has been conducted using four representative hyperspectral images collected by two different instruments (AVIRIS and ROSIS) over a variety of test sites and in the framework of supervised classification scenarios dominated by the limited availability of training samples. Our experimental results indicate that the unsupervised data of our newly developed technique which are physically meaningful and significant from a spatial point of view, resulting in good classification accuracy. When compared to the other feature extraction techniques tested in this work [9]. In addition, new method based on an MC system is proposed marker-selection method is incorporated into a new multiple spectral–spatial classification (MSSC) scheme (MSSC-MSF) based on the construction of an MSF from region markers. The spatial and spectral information are accurate hyperspectral image classification. This method gives accurate results for yields different data sets. That data set containing large spatial structures and small and complex structures, with spectrally dissimilar or spectrally confusing classes [10].
Landsat[8] DTs, SVMs
and ANN
Water, farmland, Non-forest land, sparse Non-forest, Afforest land, unused and others.
SVM can be more accurate than ANN and DTs as well as conventional probabilistic classifiers such as the MLC. SPOT-5
Crop, mixed grassland, exposed rock soil, wetland, riparian, water
No statistical difference between object-based and pixel-based classifications was found when the same machine learning algorithms
machine
Corn, alfalfa, sorghum, soybeans, winter wheat, fallow
Average overall accuracy (98.7%), and producer accuracy winter cereal stubble, vineyard, olive orchards, urban soil, spring-sown sunflower, burnt crop stubble, dark bare soil, light bare soil
Pixel-object based classification (83.87% and 69.64%)
Greece SVM object-pixel based
Sea, bare land, permanent crops, heterogeneous
agriculture areas, sparsely vegetated area, scherloplyllous
vegetation
The SVM classifier versus the object-
Oriented approach suggested relatively high overall accuracy and Kappa accuracy for the object-oriented approach (Overall accuracy 81.3% Kappa coefficient 0.779) than the SVM classifier. (Overall accuracy 76.23% Kappa coefficient 0.719) LISS III
Sand, River, Submerged area,
Sea water, Trees, pool
Overall accuracy
Other vegetation, oil palm, water bodies, Pools , Trees/shrubs Lakes/ponds
Object based classification Overall accuracy 95.20%. Overall kappa statistics 0.94. per-pixel classifier
Overall accuracy 87.80%. Overall kappa statistics 0.86. Landsat
Afforest land, sparse forest, non-forest land, farmland, water, unused,
Guangdong Province
others ANN 83.32%
Kappa statistics SVM 0.85 DT 0.88
ANN 0.79
HIS[20] In Budapest,
the centrally located
capital of
Hungary
maximum likelihood classifier
for
pixel-level method (MLCPL)
and two
object-oriented methods maximum likelihood classifier for object-level method (MLCOL)
Grass Areas, Forest Areas, Developed , Fallow, Water
MLCOL (accuracy,77.33% kappa coefficient 0.68)
MLCPL (accuracy 86.18% kappa coefficient 0.81)
hybrid method (accuracy 90.53% kappa coefficient 0.86)
Classification Accuracy Assessment
Classification accuracy assessment, one needs to know the sources of errors. Errors from the classification itself, sources of errors, that is like position errors resulting from the registration, interpretation errors, and poor quality of training or test samples, all affect classification accuracy. In the process of accuracy assessment, it is commonly assumed that the difference between an image classification result and the reference data is due to the classification error. A classification accuracy assessment generally includes three basic
components
: sampling design, response design, and estimation and analysis procedures.II. Conclusion
A comparative pixel-object classification approach using a SVM, K-NN, DT and MLC was developed and achieved more accurate results of the other methods. Pixel-object classification is able to make correct decisions between pixel-based classification and object-based classification features through the posterior probability of class membership. That shows while sometimes may add misinformation, which produces poor classification results and objects sometimes may add more useful information to solve the confusion resulting from similar reflectance on pixels. Lastly, comparative pixel-object classification
utilizes the advantages of both pixel-based classification and object-based classification.
Most of the papers show that both concatenate and parallel combination can enhance classification accuracy, but their performances are affected by different factors such as selected member classifiers, classifier combination criterion, etc. Furthermore, according to our experimental results, diversity measures can play active guidance for the selection of multiple classifiers combination.
III. REFERENCES
[1] Alavipanah SK, Ghazanfari K, Khakbaz B,”Remote sensing and image understanding as reflected in poetical literature of Iran. In: Proceedings of remote sensing for science, education, and natural and cultural heritage”, 30th symposium of European association of remote sensing laboratories, 31st May–3rd June, UNESCO Headquarters, Paris, France (2010). [2] Brian D. Wardlow, Stephen L. Egbert, ”Large
area mapping using time-series MODIS 250 m NDVI data an assessment for the U.S. Central Great Plans” Elsevier 0034-4257s-@ (2007). [3] Sunitha Abburu, PhD, Suresh Babu Golla,
Computer Applications (0975 – 8887) Volume 119 – No.8, June (2015).
[4] Shridhar D. Jawak1, Prapti Devliyal2, Alvarinho J. Luis1, “A Comprehensive Review on Pixel Oriented and Object Oriented Methods for Information Extraction from Remotely Sensed Satellite Images with a Special Emphasis on Cryospheric Applications” Advances in Remote Sensing, 2015, 4, 177-195 (2015).
[5] M. Song, D. L. Civco & J. D. Hurd, “A competitive pixel-object approach for land cover classification”, International Journal of Remote Sensing, 26:22, 4981-4997 (2005).
[6] Volker Walter,” Object-based classification of remote sensing data for change detection” Elsevier ISPRS Journal of Photogrammetric & Remote Sensing 58 (2004).
[7] J. Senthilnath, Student Member, IEEE S.N.Omkar, V. Mani, tejovanthn, P.G. Diwakar, and Archana Shenoy B, Hierarchical Clustering Algorithm for Land Cover Mapping Using Satellite Images, journal of selected topics in applied earth observations and remote sensing, IEEE vol. 5, no. 3, June (2012).
[8] Xidong Jiang, Meizhen Lin, Junlei Zhao, Woodland cover change assessment using decision trees, support vector machines and artificial neural networks classification algorithms, Fourth International Conference on Intelligent Computation Technology and Automation IEEE (2011).
[9] Inmaculada Dopido, Alberto Villa, Member, IEEE, Antonio Plaza, Senior Member, IEEE, and Paolo Gamba, Senior Member, IEEE” A Quantitative and Comparative Assessment of Unmixing-Based Feature Extraction Techniques for Hyperspectral Image Classification”, journal of selected topics in applied earth observations and remote sensing, vol. 5, no. 2, April (2012). [10] Yuliya Tarabalka, Student Member, IEEE, Jon
Atli Benediktsson, Fellow, IEEE, Jocelyn Chanson, Senior Member, IEEE, and James C. Tilton, Senior Member, IEEE Multiple Spectral– Spatial Classification Approach for Hyperspectral Data. IEEE On geosciences and remote sensing, IEEE vol. 48, no. 11, November (2010).
[11] Giorgos Mountrakis, Jungho Im, Caesar Ogole, “Support vector machines in remote sensing: A
review” Elsevier ISPRS Journal of Photo grammetry and Remote Sensing 66 (2011). [12] J R Otukei & T Blaschke, “Land Cover Change
Assessment Using Decision Trees, support Vector machines and maximum likelihood classification algorithms, International Journal of Applied Earth Observation and Geo information 12S, pp.S27-S31, (2010).
[13] Bor-Chen Kuo, Member, IEEE, Hsin-Hua Ho, Cheng-Hsuan Li, Chih-Cheng Hung, Member, IEEE and Jin-Shiuh Taur, Senior Member IEEE, “A Kernel-Based Feature Selection Method For SVM with RBF Kernel for Hyperspectral Image Classification” IEEE journal of selected topics in applied earth observations and remote sensing, vol. 7, no. 1, January (2014).
[14] Dennis C. Duro, Steven E. FranklinMonique G. Dube A comparison of pixel-based and object-based image analysis with selected machine learning algorithms for the classification of Agricultural landscapes using SPOT-5 HRG imagery, Elsevier (2011).
[15] Brian D. Wardlow, Stephen L. Egbert, ”Large area mapping using time-series MODIS 250 m NDVI data an assessment for the U.S. Central Great Plans” Elsevier 0034-4257 (2007).
[16] Isabel Luisa Castillejo-Gonzalez, Francisca Lopez-Granados, Alfonso Garcia-Ferrer, Jose Manuel Pena-Barraganb, Montserrat Jurado-Expositob, Manuel Sanchez de la Ordena, Maria Gonzalez-Audicanac, Object- and pixel-based analysis for mapping crops and their Agro environmental associated measures using Quick Bird imagery, Computers and Electronics In Agriculture Elsevier 68 207–215 (2009).
[17] George P. Petropoulos, Chariton Kalaitzidis, Krishna Prasad Vadrevu, support vector Machine and object-based classification for obtaining land-use/cover cartography from Hyperion Hyperspectral imagery, Elsevier (2015).
[18] Pooja A P, Jayanth J, Dr Shivaprakash Koliwad Professor and Head (R), Dept of ECE Malnad Collage of Engineering, Hassan, Karnataka, India Classification of RS data using Decision Tree Approach, International Journal of Computer Applications (0975 – 8887) Volume 23 – No.3, June (2011).
classification approaches for land -use/land-Cover mapping using SPOT 5 imagery, Go-cart International, Vol. 29, No. 4, 351–369 (2014). [20] Soe W. Myint, Patricia Gober, Anthony Brazel,
Susanne Grossman-Clarke, Qihao Weng, Per-pixel vs. object-based classification of urban land cover extraction using high spatial Resolution imagery Remote Sensing of Environment, Elsevier 115 (2011).