ABSTRACT
CHANG, KUNG-YEN. Identification of Protein Isoforms in Mass Spectrometry Based Proteomic Analyses Using Alternative Splicing Databases. (Under the direction of Dr. David C. Muddiman).
Tandem mass spectrometry has been one of the most effective high-throughput approaches for protein identification and quantification. Database searching is the most frequently used approach for automated peptide assignment of tandem mass spectra. Protein identifications are inferred by grouping the peptide-spectrum matches. However, MS/MS search engines depend on protein databases to provide candidates for consideration. Alternative splicing of precursor messenger RNA expands the diversity of eukaryotic proteome in different tissues and developmental stages by allowing individual genes to generate multiple protein isoforms with different functions. Aberrant splicing has been implicated in various diseases including cancer. Many protein databases only include a limited number of isoforms to keep minimal redundancy. As a result, the database search will not be able to identify the true protein isoforms even with high quality tandem MS data and accurate intact precursor ion mass. The primary goal of the studies described in this dissertation is to investigate whether total protein identifications will increase after introducing the eligible splice isoforms for database searching. The related topics including the performance of search algorithms, the evaluation of alignment programs, and temporal profiles of potential isoforms are investigated as well.
errors. The findings of two isoform proteins having different functional domains were reported in both organisms. The comparison of search engines showed large variations between the splice variants identified by different algorithms. The consensus peptides from multiple algorithms were used to select the top candidates for valid identifications. The alternative splicing databases generated from different alignment programs varied in size but the majority of predicted sequences were identical. Similar lists of putative isoforms were found in M. oryzae spores regardless of what alignment program was used to produce the alternative splicing database. The consistency was probably derived from the rational constraints applied during construction. In the temporal analysis of spore development induced by cAMP in M. oryzae, the expression profile of one putative isoform altered while the other protein seemed unaffected.
Identification of Protein Isoforms in Mass Spectrometry Based Proteomic Analyses Using Alternative Splicing Databases
by
Kung-yen Chang
A dissertation submitted to the Graduate Faculty of North Carolina State University
in partial fulfillment of the requirements for the degree of
Doctor of Philosophy
Bioinformatics
Raleigh, North Carolina February 25, 2011
APPROVED BY:
_______________________________ ______________________________
Dr. David C. Muddiman Dr. Steffen Heber
Committee Chair
________________________________ ________________________________
DEDICATION
BIOGRAPHY
ACKNOWLEDGMENTS
I express my sincerest appreciation to all of the people in my journey. I would like to give special thanks to my advisor, Dr. David C. Muddiman, for all of his patience, help and guidance which make my work possible. I also would like to thank to my other committee members Dr. Steffen Heber, Dr. Dahlia M. Nielsen, and Dr. Michael B. Goshe for their insightful comments and suggestions.
I would like to thank Dr. Adam Hawkridge for his encouragement and discussions. I also would like to acknowledge all former and current members in the W. M. Keck FT-ICR mass spectrometry laboratory for their support and friendships.
TABLE OF CONTENTS
LIST OF TABLES ... viii
LIST OF FIGURES ... ix
Chapter 1. Introduction ...1
1.1 Protein identification in mass spectrometry-based proteomics ...2
1.1.1 Protein identification using tandem mass spectrometry ...2
1.1.2 Database search algorithms...4
1.2 Alternative splicing and protein databases ...7
1.2.1 Protein identification using tandem mass spectrometry ...7
1.2.2 Investigation of current alternative splicing databases ...9
1.3 Statistical assessment of search results...12
1.4 Synopsis of Completed Research ...13
1.5 References ...15
Chapter 2. Detection of Alternative Splice Variants at the Proteome Level in Aspergillus flavus ...18
2.1 Introduction ...19
2.2 Experimental...23
2.2.1 Original Protein Database of A. flavus ...23
2.2.2 Construction of Alternative Splicing Database ...23
2.2.3 SILAC Experiment ...26
2.2.5 Calculation of False Discovery Rate...27
2.2.6 Validation of AS Peptides ...27
2.3 Results ...28
2.4 Discussion...37
2.5 References ...40
Chapter 3. Identification of Alternative Splice Variants in Aspergillus flavus through Comparison of Multiple Tandem MS Search Algorithms ...45
3.1 Introduction ...46
3.2 Experimental...48
3.2.1 RefSeq Proteins ...48
3.2.2 Alternative Splicing Database ...49
3.2.3 Experimental Spectra ...50
3.2.4 Database Search ...50
3.2.5 False Discovery Rate ...51
3.3 Results ...51
3.4 Discussion...61
3.5 References ...64
Chapter 4. Detection of Protein Isoforms in Magnaporthe oryzae by nano-LC LTQ Orbitrap Mass Spectrometry and Alternative Splicing Databases ...67
4.1 Introduction ...68
4.2 Experimental...71
4.2.2 Alternative Splicing Databases ...71
4.2.3 nano-LC separation and Orbitrap mass spectrometry analysis ...72
4.2.4 Database Search ...72
4.3 Results ...73
4.4 Discussion...82
4.5 References ...85
APPENDIX ...88
LIST OF TABLES
Table 2.1. List of proteins identified from alternative splicing database. ...29
Table 3.1. False discovery rates for peptide identifications with different search algorithms.53 Table 3.2. Number of identified peptides and proteins by algorithms with a FDR < 2%. ...54
Table 3.3. Overlap of identified peptides and proteins between algorithms with a FDR < 2% ...54
Table 3.4. Number of MS/MS spectra assigned to different peptide sequences by algorithms ...56
Table 3.5. Number of peptides and proteins identified at different false discovery rates. ...56
Table 3.6. List of consensus peptides specific to putative isoforms with a FDR < 2%.. ...57
Table 4.1. Numbers of empty alignment by programs. ...75
Table 4.2. Numbers of conserved splice sites in presumed introns by alignment programs ...75
Table 4.3. Overlap between alternative splicing databases. ...75
Table 4.4. Comparison of putative isoforms identified in unstimulated spores using SIM4, BLAT, GMAP, SPIDEY, and SPLIGN alternative splicing databases. ...76
Table 4.5. Putative isoforms identified in unstimulated spores using GMAP alternative splicing database. ...77
Table 4.6. CDS of identified MG6 proteins and putative isoforms ...79
LIST OF FIGURES
Figure 1.1. A generalized workflow of protein identification using shotgun proteomics ...3
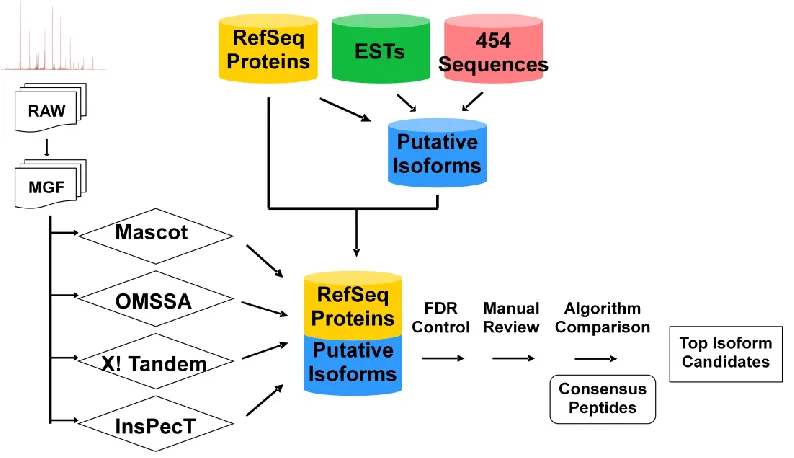
Figure 2.1. Integration of alternative splicing database in bottom-up proteomic analysis ...22
Figure 2.2. Detection of alternative splicing and generation of putative alternative splicing variants ...24
Figure 2.3. NADH-cytochrome b5 reductase ...31
Figure 2.4. Cystathionine beta-synthase ...33
Figure 2.5. Pyruvate decarboxylase PdcA ...34
Figure 2.6. Mitochondrial F1 ATPase subunit alpha ...36
Figure 3.1. Overview of study design ...48
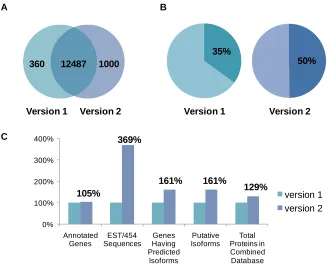
Figure 3.2. Comparison of different versions of Aspergillus flavus genome ...52
Figure 3.3. Overlap of peptide and protein identifications using different search algorithms 55 Figure 3.4. Identification of consensus peptide FAVETAITDVINAQR ...59
Figure 3.5. Conserved domain analysis of Aspergillus flavus UDP-glucose 4-epimerase isoforms...60
Figure 4.1. Overview of study ...70
Figure 4.2. Constraints applied in building alternative splicing databases ...74
CHAPTER 1
1.1 Protein identification in mass spectrometry-based proteomics
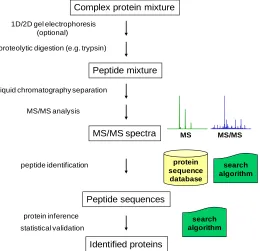
Mass spectrometry has become the major high-throughput approach to study proteomes of organisms these days. In a typical “bottom-up” approach for mass spectrometry-based proteomic analysis, the protein mixture is proteolytically digested, followed by analysis of single- or multi-dimensional chromatography coupled to tandem mass spectrometry, then the acquired spectra are searched against protein sequence databases to find the matched proteins.1, 2 In practice, a major portion of acquired spectra find no matched sequence entry in protein databases.3 This is attributed to a number of reasons including quality of spectra, search engine algorithms, sequence polymorphisms, post-translational modifications, and transcriptional variations by RNA splicing and editing.3, 4 1.1.1 Protein identification using tandem mass spectrometry
thousands of proteins in a yeast-cell lysate could be identified in a single experiment using multidimensional protein identification technology (MudPIT), which incorporates multidimensional high-pressure liquid chromatography (LC/LC), tandem mass spectrometry (MS/MS) and database-searching algorithms.1, 2
Complex protein mixture
1D/2D gel electrophoresis (optional)
liquid chromatography separation proteolytic digestion (e.g. trypsin)
Peptide mixture
protein sequence
database
peptide identification
Peptide sequences
protein inference
Identified proteins statistical validation
search algorithm MS MS/MS
MS/MS analysis
MS/MS spectra
search algorithm
The overview of shotgun proteomics analysis is schematically illustrated in Figure 1.1.6 The method starts with digestion of sample proteins into peptides using proteolytic enzymes such as trypsin. Peptides are separated by one- or multidimensional liquid chromatography and subjected to MS/MS analysis to sequence the peptides. One of many advantages of tandem mass spectrometry over traditional analytical methods is obtaining structural information by performing two mass analyses, either “in space” or “in time”. For “in space” configurations, the primary and secondary analyses are performed sequentially as
Figure 1.1. A generalized workflow of protein identification using shotgun proteomics
ions travel through the instrument. For “in time” configurations, analyses are performed consecutively within the same analyzer. In both cases, the first MS analysis step is used to measure ions according to their m/z values. Subsequently, peptide ions (precursor ions) are selected for further processing. Then each selected precursor ion is fragmented into smaller pieces (product ions) in the dissociation step. The resulting product ions are separated in the second mass analysis step with respect to their m/z values and are recorded as a MS/MS spectrum. Peptides are then identified based on searching MS/MS spectra against protein sequence databases. Sequences of the identified peptides are used to infer the proteins which present in the original protein mixture. Statistical validation is included in both peptide assignment and protein inference processes.
The Mass Measurement Accuracy (MMA) of MS spectra is describe in parts-per-million (ppm) and calculated using Equation 1.1.
experimental theoretical 6 theoretical
M - M
MMA = 10
M (1.1)
1.1.2 Database search algorithms
observed and in silico fragment ions such as b- and y- ions. A scoring function is then used to calculate a score which represents how well each theoretical spectrum matches the observed spectrum. The most used commercial MS/MS search algorithms are Mascot7 (Matrix Science Ltd.) and SEQUEST8 (Thermo Fisher Scientific Inc.). Open source search algorithms are also available, including Open Mass Spectrometry Search Algorithm (OMSSA)9 and X! Tandem10 distributed by the National Center for Biotechnology Information (NCBI) and the Global Proteome Machine Organization, respectively.
SEQUEST8 is a heuristic algorithm, which correlates the acquired experimental MS/MS spectrum with a theoretical spectrum and calculates a score based on the similarity between the two. In fact, SEQUEST uses two scoring functions. The initial one is used to rapidly determine the best 200 peptide candidates for each MS spectrum, and a second function rescores the 200 hits. The final SEQUEST score computation is achieved by converting the theoretical fragment masses into an artificial spectrum and by computing a “cross-correlation”, (a * e) (t), between the artificial spectrum a and the experimental mass list e with delay t. In addition to the Xcorr score, SEQUEST exports several other factors, e.g., initial score Sp and the difference between the best and second-best scores. The BioWorks software package provided by Thermo Fisher Scientific Inc. has started reporting a probability-based score to prioritize and rank the SEQUEST hits.
parent mass as constraints on the search space. For each peptide, Mascot reports a probability-based “Ions Score”, which is defined as (-10) * log10 (P), where P is the absolute
probability that the observed match between the experimental data and the database sequence is a random event. The absolute probability P is equal to E * N-1, where E is the expect value and N is the number of proteins in the database. Details of the scoring algorithm has never been published nor patented.
OMSSA9 is a probability-based matching algorithm using classical hypothesis testing based on an explicit model of matching statistics, the same statistical method used in BLAST12. OMSSA takes experimental MS/MS spectra, determines precursor charge states, filters noise peaks, extracts m/z values, and then compares these m/z values to calculated m/z
values derived from the peptides produced by an in silico digestion of a protein sequence library. The theoretical peptides must have a mass within a user specified tolerance of the precursor mass. OMSSA models the distribution of random matches after the Poisson distribution instead of relying on peak fitting or the entries in a sequence library. The resulting search hits are ranked by E-value. This E-value remains valid for searches that include variable post-translational modifications.
the individual spectrum-to-sequence assignments. If more than one peptide has been found for a protein, the expectation values for the peptides are combined using a simple Bayesian model to calculate the probability of having multiple peptides from the same protein.
1.2 Alternative splicing and protein databases
Alternative pre-mRNA splicing (AS) is a mechanism which removes the intervening introns (non-coding sequences) and joins the flanking exons (coding regions) in different arrangements. By allowing a single gene to generate distinct mRNAs and therefore multiple protein variants, this process enables eukaryotes to generate complexity and diversity of proteome from a limited number of genes. The use of junction arrays to monitor alternative splicing events estimated that at least 74% of human multi-exon genes are alternatively spliced.13 The available transcriptome data indicated that an average of 3.9 splicing patterns can be expressed from a single human gene.14 Alternative splicing has been found to play important roles in many cellular and developmental processes.15-17 Aberrant splicing has been implicated in various diseases including cancer.18 Current genome annotations are commonly generated by a computational pipeline and could contain errors. A significant number of alternative splicing variants may not be included in the existing gene models and absent from the protein databases. The public resources of protein databases and alternative splicing databases are investigated.
1.2.1 Investigation of public protein databases
identification include UniProt19, RefSeq20, Ensembl21, and NCBI “nr” database. The UniProt Knowledgebase (UniProtKB) is an expertly curated database consisting of two sections, Swiss-Prot and TrEMBL. Swiss-Prot contains manually annotated records with information extracted from literature and curator-evaluated computational analyses. TrEMBL contains high quality computationally analyzed records enriched with automatic annotation and classification. NCBI‟s Reference Sequence (RefSeq) database is a curated non-redundant sequence database of genomes, transcripts and proteins. RefSeq (release 33, Jan 16, 2009) includes 7,773 organisms spanning prokaryotes, eukaryotes and viruses, with records for more than 6.4 million protein sequences. The NCBI default protein sequences database (nr) is a non-redundant set of all CDS translations from GenBank along with all RefSeq, Swiss-Prot, PDB, PIR and PRF proteins. Ensembl‟s primary focus is providing gene annotation and comparative genome integration for chordate genomes. Ensembl (release 51, Nov 18, 2008) supports 48 genomes, 41 of which are vertebrates and a total of 32 mammals.
alternative splicing, alternative promoter usage and/or alternative translation initiation, resulting in close to 34,000 human protein sequences (Swiss-Prot release 14.1, Sep 2, 2008). 1.2.2 Investigation of current alternative splicing databases
Besides the general protein databases, many groups independently developed alternative splicing databases which focused on detection and storage of AS sequences, such as ASG22, HOLLYWOOD23, ECGene24, ASAP II25, and ASTD26. These AS databases were constructed based on either searches of the scientific literature or automated large-scale mapping of transcripts and genomic sequences.
Alternative Splicing Gallery (ASG)22 database for human genes was developed using the approach of splicing graph. EST and mRNA data (Ensembl, RefSeq, STACK, TIGR and UniGene) were mapped to Ensembl genes using BLAST and sim4. The results showed that over 65% of the investigated genes had evidence for alternative splicing.
HOLLYWOOD23 database was built upon exon/intron annotation and splicing information derived from the alignments of cDNAs and ESTs against Ensembl genes using GENOA. The database also integrated the knowledge of exonic splicing enhancers and silencers, and the information of mammalian interspersed repeat sequences. HOLLYWOOD database currently contains the splicing patterns of human and mouse genes.
available in ECgene, including human, mouse, rat, worm, fruit fly, zebrafish, dog, chicken and Rhesus monkey.
ASAP II25 used UniGene clusters of ESTs to identify splices. The UniGene ESTs were clustered so that a single cluster roughly corresponded to a gene. Possible splice sites were identified by EST alignments to the genome. Existence of "mutually exclusive" splices pointed to an alternative splicing event. ASAP II now provides splicing variants for 15 animal species from human to nematodes. Comparative genomics is a major focus for the ASAP II database. The comparative analysis of splice variants identified orthologous exons, introns and alternative splice events across 17 genomes using UCSC BLASTZ multigenome alignments. Orthologous exons and introns were defined by sharing at least one splice site in multigenome alignments.
Most of AS transcripts detected by ESTs and other sequence data to genomic regions are poorly annotated and their functions are mostly unknown. The gap can be filled by the information extracted from single-gene studies published in the scientific literature. Literature Support for Alternative Transcripts (LSAT)27 database extracted information for more than 4,000 genes that expressed multiple transcripts from about 14,000 MEDLINE abstracts using a two-step text-mining procedure. In the information retrieval step, a support vector machine (SVM) classifier was trained using inductive learning to identify sentences containing information about alternative transcripts from MEDLINE abstracts. In the information extraction step, information including gene names, events, tissues, species, specificity, number of isoforms, and experimental methods were extracted. The results indicated that alternative splicing, alternative polyadenylation, and alternative promoter usage worked in concert to generate and regulate transcript diversity. The study identified 959 instances of tissue-specific splicing. The results also suggested that the nervous system preferentially relied on alternative splicing over other mechanisms to generate transcript diversity.
1.3 Statistical assessment of search results
MS/MS search algorithms use their own unique scoring functions to decide the similarity between observed spectra and candidate peptides. The best-scoring peptide-spectrum match (PSM) is returned by the algorithms for each observed peptide-spectrum. There is a need to have confidence measures for the reported list of PSMs. The most commonly used statistical measure of significance is p-value. Assuming the null hypothesis (“the peptide was not identified by the tandem mass spectrometer”) is correct, the p-value is defined as the probability of obtaining a result equal to or more extreme than what was actually observed. A low p-value means that the probability of the observation occurring by chance is small. The
p-value is a measure of significance in terms of the false positive rate, which is the rate that truly null features are called significant.
In large-scale protein identifications by mass spectrometry, a p-value threshold is inadequate because the statistical test is performed so many times. An accepted method for multiple testing correction is to estimate the false discovery rate (FDR). The false discovery rate represents the percentage of significant PSMs that are incorrect. FDR is defined to be the expected ratio of the number of false positives among all significant tests or represented in terms of false positives (FP) and true positives (TP), as seen in Equation 1.2.28
# false positive features
FDR E E
# significant features
FP
TP FP
(1.2)
using a Markov model with parameters derived from the target sequences. The idea of a „decoy‟ database is to preserve the general composition of the target database while minimizing the overlapping peptide sequences between the target and decoy databases. For a given score threshold, the FDR can be computed as the ratio of the number of matches searching a decoy peptide database above the threshold and the number of matches searching the original peptide database above the threshold.30 Different groups compute FDR is different ways. Besides the ratio of Decoy/Target, an alternative form of FDR computation is (2 * Nd) / (Nd + Nt) where Nt is the number of target peptide matches above a certain
threshold and Nd is the number of decoy peptide matches passing the same threshold.31
1.4 Synopsis of Completed Research
The research presented in this dissertation describes the implementation and application of alternative splicing databases for the identification of splice isoforms in mass spectrometry based proteomic analyses. The hypotheses to test include: the mechanism of alternative splicing is involved in the generation of the expressed proteins in the model organism; and the existing isoforms can be detected in the analysis of tandem mass spectrometry after the candidate sequences are provided by the alternative splicing database.
The first implementation of the alternative splicing database based on ESTs in
and the existing set of tandem mass spectra. The limitations in tandem mass spectrometry analysis for isoform identifications are discussed. Other plausible explanations for the discoveries are explored. Synthesized peptides are used to validate the identifications of several isoform specific peptides.
Due to a major update of the Aspergillus flavus genome and a collection of newly available transcripts, the alternative splicing database needs to be rebuilt. Chapter 3 describes the investigation of different search engines on identifying splice variants using the updated database. The protein identifications are separated into two groups, originally annotated proteins and putative splice isoforms, for comparison. The peptide assignments are validated through the consensus approach at a relatively low cost. The functional domains existing in the sequences of the putative splice isoforms are analyzed.
1.5 References
1. Link, A. J.; Eng, J.; Schieltz, D. M.; Carmack, E.; Mize, G. J.; Morris, D. R.; Garvik, B. M.; Yates, J. R., III, Direct analysis of protein complexes using mass spectrometry.
Nat. Biotechnol. 1999, 17, (7), 676-682.
2. Washburn, M. P.; Wolters, D.; Yates, J. R., III, Large-scale analysis of the yeast proteome by multidimensional protein identification technology. Nat. Biotechnol.
2001, 19, (3), 242-247.
3. Johnson, K. L.; Ovsyannikova, I. G.; Poland, G. A.; Muddiman, D. C., Identification of class II HLA-DRB1*03-bound measles virus peptides by 2D-liquid chromatography tandem mass spectrometry. J. Proteome Res. 2005, 4, (6), 2243-2249.
4. Roth, M. J.; Forbes, A. J.; Boyne, M. T., II; Kim, Y. B.; Robinson, D. E.; Kelleher, N. L., Precise and parallel characterization of coding polymorphisms, alternative splicing, and modifications in human proteins by mass spectrometry. Mol. Cell. Proteomics 2005, 4, (7), 1002-1008.
5. Wu, C. C.; MacCoss, M. J., Shotgun proteomics: tools for the analysis of complex biological systems. Curr. Opin. Mol. Ther. 2002, 4, (3), 242-250.
6. Nesvizhskii, A. I., Protein identification by tandem mass spectrometry and sequence database searching. Methods Mol. Biol. 2007, 367, 87-119.
7. Perkins, D. N.; Pappin, D. J.; Creasy, D. M.; Cottrell, J. S., Probability-based protein identification by searching sequence databases using mass spectrometry data.
Electrophoresis 1999, 20, (18), 3551-3567.
8. Eng, J. K.; McCormack, A. L.; Yates, J. R., III, An approach to correlate tandem mass spectral data of peptides with amino acid sequences in a protein database. J. Am. Soc. Mass Spectrom. 1994, 5, (11), 976-989.
9. Geer, L. Y.; Markey, S. P.; Kowalak, J. A.; Wagner, L.; Xu, M.; Maynard, D. M.; Yang, X.; Shi, W.; Bryant, S. H., Open mass spectrometry search algorithm. J. Proteome Res. 2004, 3, (5), 958-964.
10. Craig, R.; Beavis, R. C., TANDEM: matching proteins with tandem mass spectra.
Bioinformatics 2004, 20, (9), 1466-1467.
12. Altschul, S. F.; Madden, T. L.; Schaffer, A. A.; Zhang, J.; Zhang, Z.; Miller, W.; Lipman, D. J., Gapped BLAST and PSI-BLAST: a new generation of protein database search programs. Nucleic Acids Res. 1997, 25, (17), 3389-3402.
13. Johnson, J. M.; Castle, J.; Garrett-Engele, P.; Kan, Z.; Loerch, P. M.; Armour, C. D.; Santos, R.; Schadt, E. E.; Stoughton, R.; Shoemaker, D. D., Genome-wide survey of human alternative pre-mRNA splicing with exon junction microarrays. Science 2003, 302, (5653), 2141-2144.
14. Stamm, S.; Riethoven, J. J.; Le Texier, V.; Gopalakrishnan, C.; Kumanduri, V.; Tang, Y.; Barbosa-Morais, N. L.; Thanaraj, T. A., ASD: a bioinformatics resource on alternative splicing. Nucleic Acids Res. 2006, 34, (Database issue), D46-D55.
15. Black, D. L., Mechanisms of alternative pre-messenger RNA splicing. Annu. Rev. Biochem. 2003, 72, 291-336.
16. Modrek, B.; Lee, C., A genomic view of alternative splicing. Nat. Genet. 2002, 30, (1), 13-19.
17. Blencowe, B. J., Alternative splicing: new insights from global analyses. Cell 2006, 126, (1), 37-47.
18. Pajares, M. J.; Ezponda, T.; Catena, R.; Calvo, A.; Pio, R.; Montuenga, L. M., Alternative splicing: an emerging topic in molecular and clinical oncology. Lancet Oncol. 2007, 8, (4), 349-357.
19. UniProt Consortium, The Universal Protein Resource (UniProt) 2009. Nucleic Acids Res. 2009, 37, (Database issue), D169-D174.
20. Pruitt, K. D.; Tatusova, T.; Klimke, W.; Maglott, D. R., NCBI Reference Sequences: current status, policy and new initiatives. Nucleic Acids Res. 2009, 37, (Database issue), D32-D36.
22. Leipzig, J.; Pevzner, P.; Heber, S., The Alternative Splicing Gallery (ASG): bridging the gap between genome and transcriptome. Nucleic Acids Res. 2004, 32, (13), 3977-3983.
23. Holste, D.; Huo, G.; Tung, V.; Burge, C. B., HOLLYWOOD: a comparative relational database of alternative splicing. Nucleic Acids Res. 2006, 34, (Database issue), D56-D62.
24. Kim, P.; Kim, N.; Lee, Y.; Kim, B.; Shin, Y.; Lee, S., ECgene: genome annotation for alternative splicing. Nucleic Acids Res. 2005, 33, (Database issue), D75-D79.
25. Kim, N.; Alekseyenko, A. V.; Roy, M.; Lee, C., The ASAP II database: analysis and comparative genomics of alternative splicing in 15 animal species. Nucleic Acids Res.
2007, 35, (Database issue), D93-D98.
26. Koscielny, G.; Le Texier, V.; Gopalakrishnan, C.; Kumanduri, V.; Riethoven, J. J.; Nardone, F.; Stanley, E.; Fallsehr, C.; Hofmann, O.; Kull, M.; Harrington, E.; Boue, S.; Eyras, E.; Plass, M.; Lopez, F.; Ritchie, W.; Moucadel, V.; Ara, T.; Pospisil, H.; Herrmann, A.; J, G. R.; Guigo, R.; Bork, P.; Doeberitz, M. K.; Vilo, J.; Hide, W.; Apweiler, R.; Thanaraj, T. A.; Gautheret, D., ASTD: The Alternative Splicing and Transcript Diversity database. Genomics 2009, 93, (3), 213-220.
27. Shah, P. K.; Jensen, L. J.; Boue, S.; Bork, P., Extraction of transcript diversity from scientific literature. PLoS Comput. Biol. 2005, 1, (1), e10.
28. Storey, J. D.; Tibshirani, R., Statistical significance for genomewide studies. Proc. Natl. Acad. Sci. U. S. A. 2003, 100, (16), 9440-9445.
29. Elias, J. E.; Gygi, S. P., Target-decoy search strategy for increased confidence in large-scale protein identifications by mass spectrometry. Nat. Methods 2007, 4, (3), 207-214.
30. Käll, L.; Storey, J. D.; MacCoss, M. J.; Noble, W. S., Assigning significance to peptides identified by tandem mass spectrometry using decoy databases. J. Proteome Res. 2008, 7, (1), 29-34.
CHAPTER 2
Detection of Alternative Splice Variants at the Proteome Level in Aspergillus flavus
Kung-Yen Chang, D. Ryan Georgianna, Steffen Heber, Gary A. Payne, and David C. Muddiman
2.1 Introduction
Protein identification is the key part of mass spectrometry-based proteomic analysis. In a typical “Bottom-Up” approach, proteins of interest are separated by gel electrophoresis, digested by a specific enzyme, and followed by analysis of single- or multi-dimensional chromatography coupled to tandem mass spectrometry. The acquired mass spectral data are then used to search against databases to find matched proteins. In practice, a major portion of acquired spectra find no matched sequence entry in protein databases.1 Probable explanations include quality of spectrum, search engine algorithm, sequence polymorphism, post-translational modification, and transcriptional variation by RNA splicing and editing.1, 2
277 genes or 4.2% of the total.9 These data suggest that alternative splicing in fungi is more prevalent than previously thought.
One of the challenges in mass spectrometry-based proteomics is that tandem MS peptides can only identify the proteins if the target database contains the correct sequences for peptide mapping. Today‟s protein databases vary in many aspects such as level of curated annotation, size of records and species, and degree of sequence redundancy. Currently, only a small percentage of estimated alternative splicing variants are deposited in the major protein databases. Databases like Swiss-Prot10 and RefSeq11 were originally designed to keep a minimum level of redundancy. Among 408,099 sequence entries in Swiss-Prot (release 14.7, Jan 20, 2009), only 27,169 additional sequences (6.6%) are produced by alternative splicing, initiation or promoter usage, or ribosomal frameshifting. Considering the possibility that true protein isoforms are actually absent from the target database, the search will not be able to identify the correct protein even with high quality tandem mass data and accurate intact precursor ion mass.
hybrid approaches13-15 which infer short sequence tags (partial sequences) by de novo
sequencing, followed by a database search using these tags to find the peptides in the sequence database, may be helpful for the analysis of post-translationally modified peptides and splice variants.
Many groups independently developed alternative splicing databases which focus on detection and storage of AS sequences, such as ASG16, HOLLYWOOD17, ECGene18, ASAP II19, ASTD20, and LSAT21. The detected or generated alternatively spliced isoforms may vary between different databases due to different input data, genome assembly, method for alignment and level of stringency.19 Most AS databases above are not actively updated on a regular schedule. In addition, many AS databases only provide limited query and download functions and focus on selected species. These limitations hinder the utilization of existing AS databases in proteomic studies.
splicing is essential for amine-regulated gene expression in Aspergillus oryzae,28 a widely used industrial and food fungus which is almost genetically identical to A. flavus. Combined with the biological and economic importance, established knowledge of its genome and proteome, and existence of splicing events in filamentous fungi, A. flavus proves to be an effective model organism.
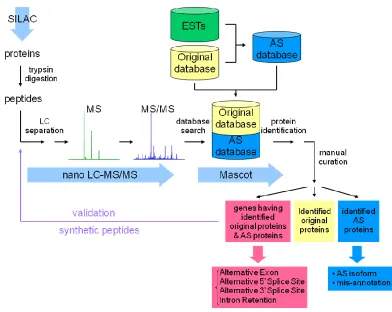
Without an AS database of A. flavus available, we built our own AS database to test two hypotheses: 1) that we can confidently identify more proteins using an AS database combined with accurate mass precursor and tandem-MS data; and 2) that fungus undergoes sufficient alternative splicing that it can be detected at the proteome level. The overview of our study is illustrated in Figure 2.1.
2.2 Experimental
2.2.1 Original Protein Database of A. flavus
The whole genome sequencing of A. flavus strain NRRL 3357, which provided 5-fold sequence coverage, was carried out at The J. Craig Venter Institute (JCVI, formerly TIGR). Automated annotation was also conducted at JCVI and additional manual annotation was coordinated through North Carolina State University (NCSU).29 A collection of 12,832 annotated protein sequences acquired from The Center for Integrated Fungal Research at NCSU is referred as the 'original database' in the remainder of the article.
2.2.2 Construction of Alternative Splicing Database
EST was only allowed to be assigned to one gene. If an EST was similar to several different genes, it was assigned to the top ranked hit. The cut-off expect value in BLAST mapping was 0.001. The screening mapped 16,121 ESTs to 4,497 genes.
To consider possible exons located in upstream and downstream regions of originally annotated genes, we extended both 5‟ and 3‟ ends of genes by 3 kb which equaled to twice the length of the longest intron found in the original database. The gene transcript derived from the previous annotation was considered as another EST to the gene. The alignments of
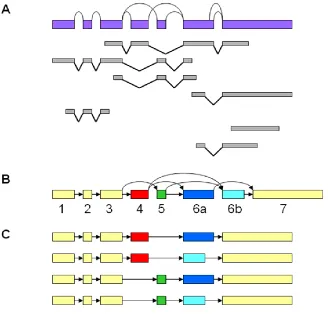
transcript and ESTs to genomic sequences were performed using the SIM4 program31, which unveiled the boundaries of exons and introns. The large amount of information carried in ESTs was merged and integrated into a single splicing graph.32 In the splicing graph, paths represented transcripts and vertex with multiple incoming or outgoing edges corresponded to alternative splice sites. Alternative splicing events were detected as bifurcations in the graph (Figure 2.2A). This procedure might not identify truncated transcripts.16 While comparing genomic positions of boundaries belonging to the same exon, a 10 bp allowance was made. If two or more 5‟ or 3‟ splice sites of the same exon were located within 10 bp, the predominant one was kept. Otherwise, they were considered alternative splice sites. It should be noted that this procedure might result in losing potential variants. The updated information and detected alternative splicing events reconstructed the gene model. In our graphic representation of gene structure, nodes and edges represented exons and introns, respectively (Figure 2.2B). All putative protein isoforms of a gene were predicted by visiting all paths in the graph, and followed by generating the corresponding sequences (Figure 2.2C).
2.2.3 SILAC Experiment
We used the existing mass spectra to test the newly constructed alternative splicing database. The original purpose of the experiments was to study the relative change of protein levels between conducive (28 °C) and non-conducive (37 °C) temperatures for aflatoxin biosynthesis. The experiment was previously described in full detail.26 In short, different labeled cultures of A. flavus were grown for 24 h at 28 °C or 37 °C. Extracted protein samples were separated on 12.5% SDS-PAGE gel. Forty bands were sliced from each lane. Samples were reduced, alkylated, and followed by trypsin digestion for 18 h at 37 °C. Then each in-gel digested samples was analyzed by nanoflow LC-MS/MS on a LTQ-FT (ThermoFisher Scientific).
2.2.4 Database Search
To study the effects of the new AS database on protein identification, the newly predicted alternatively spliced variants were combined with the originally annotated proteins. The existing set of experimental spectra as described previously26 was searched against the combined database. The protein search algorithm used in the analysis was Mascot Server version 2.2.04 (Matrix Science Ltd.). The search allowed two missed cleavage sites, 5 ppm peptide tolerance, 1 Da MS/MS fragment ion tolerance, two variable modifications, Deamidated (NQ) and Oxidation (M), and one fixed Cys modification, Carbamidomethyl (C).
Mascot incorporates a probability based implementation of the Mowse scoring algorithm33. The Mascot score is reported as -10 * Log10(P), where P is the absolute
E * N-1, where E is the expect value and N is the number of proteins in the database. The significance threshold for the search was 0.05 (p < 0.05). An event is significant if it would be expected to occur at random with a frequency of less than 5%. Knowing the size of the combined database, the corresponding cutoff Mascot score would be: (-10) * log((1 / (12832 + 9807)) * 0.05) = 56.56.
2.2.5 Calculation of False Discovery Rate
Controlling the false discovery rate (FDR) is a commonly accepted approach to multiple testing correction in large-scale mass spectrometry-based proteomic studies. FDR represents the percentage of significant peptide-spectrum matches (PSMs) and can be estimated using the target-decoy strategy. The „target‟ database was the expanded A. flavus
protein database. A corresponding „decoy‟ database was created by reversing the sequences in the target database. Two separate searches were performed against the target and decoy databases individually using identical search parameters. At the significance threshold of 0.05 (p < 0.05) in Mascot searches, 14,615 target PSMs and 407 decoy PSMs above the threshold were counted. A FDR of 2.78% was estimated by computing the ratio of decoys and targets.34 It means that if we accept 100 tandem mass spectrum assignments, then we expect less than three of those identifications to be incorrect.
2.2.6 Validation of AS Peptides
identification of isoforms. We ordered the synthetic peptides of the detected endogenous peptide sequences. The synthetic peptides were analyzed by nLC-MS/MS. The tandem mass spectra from the synthetic peptides were compared to those from the corresponding endogenous peptides.
2.3 Results
To study the importance of alternative splicing in proteomic analysis, a customized AS database of A. flavus was built based on ESTs. The original database consisted of 12,832 previously annotated proteins but no splice isoforms. The newly constructed AS database provided additional 9,807 eligible alternatively spliced variants and expanded the size of the original database by 76%. According to our predictions, 1,292 A. flavus genes had multiple protein isoforms, 8.59 putative isoforms per gene on average.
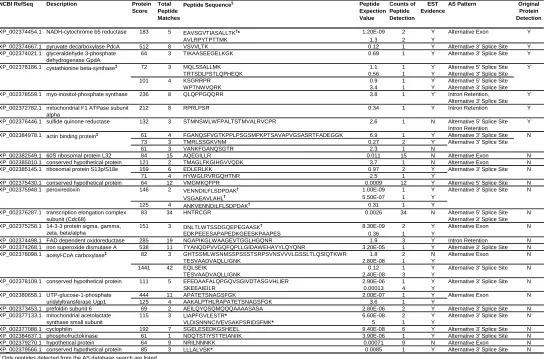
Table 2.1. List of proteins identified from alternative splicing database.
NCBI RefSeq Description Protein Score
Total Peptide Matches
Peptide Sequence§ Peptide
Expection Value Counts of Peptide Detection EST Evidence
AS Pattern Original Protein Detection
XP_002374454.1 183 5 EAVSGVTIASALLTK†* 1.20E-09 2 Y
AVLRPYTPTTMK 1.3 2 Y
XP_002374667.1 pyruvate decarboxylase PdcA 512 8 VSVVLTK 0.12 1 Y Alternative 3' Splice Site Y XP_002374021.1 glyceraldehyde 3-phosphate
dehydrogenase GpdA
64 3 TIKAASEEGELKGK 0.69 1 Y Alternative 3' Splice Site Y
XP_002378186.1 72 3 MQLSSALLMK 1.1 1 Y
TRTSDLPSTLQPHEQK 0.56 1 Y
101 4 KSGRRPR 0.9 1 Y
WPTNWVQRK 3.4 1 Y
XP_002378559.1 myo-inositol-phosphate synthase 236 8 QLQPPGQQRR 3.8 1 Y Intron Retention, Alternative 3' Splice Site
Y XP_002372782.1 mitochondrial F1 ATPase subunit
alpha
212 8 RPRLPSR 0.34 1 Y Intron Retention Y
XP_002376446.1 sulfide quinone reductase 132 3 STMNSWLWFPALTSTMVALRVCPR 2.6 1 N Alternative 5' Splice Site Intron Retention
Y XP_002384978.1 61 4 FGANQSFVGTKPPLPSGSMPKPTSAVAPVGSASRTFADEGGK 6.9 1 Y Alternative 3' Splice Site
73 3 TMRLSSGKVNM 0.27 2 Y
61 3 VANKFGANQSGTR 2.3 1 N
XP_002382549.1 60S ribosomal protein L32 84 15 AQEGILLR 0.011 15 N Alternative Exon N
XP_002385010.1 conserved hypothetical protein 121 2 TMAGLFKGIHGVVQDK 3.7 1 N Alternative Exon N
XP_002385145.1 159 6 EDLERLKK 0.97 2 Y N
71 4 HYWGLRVRGQHTNR 2.5 1 Y
XP_002375430.1 conserved hypothetical protein 64 12 VMGMKQFPR 0.0009 12 Y Alternative 5' Splice Site N
XP_002375948.1 146 2 VENNDILFLSDPDAK† 1.00E-09 1 Y N
VSGAEAVLAHL† 5.50E-07 1 Y
125 4 ANKVENNDILFLSDPDAK† 0.31 1 Y
XP_002376287.1 transcription elongation complex subunit (Cdc68)
83 34 HNTRCGR 0.0026 34 N Alternative 5' Splice Site
Alternative 3' Splice Site N
XP_002375258.1 151 3 DNLTLWTSSDGQEPEGAASK† 8.30E-09 2 Y N
EDKPEEESAPAPEDKGEESKPAAPES 0.36 1 Y
XP_002374498.1 FAD dependent oxidoreductase 285 19 NGAPIKGLWAAGEVTGGLHGQNR 1.9 3 Y Intron Retention N XP_002374268.1 iron superoxide dismutase A 538 11 TYANQDPVVGQFQPLLGIDAWEHAYYLQYQNR 3.20E-05 1 Y Alternative 3' Splice Site N XP_002378098.1 82 3 GHTSSMLWSNMSSPSSSTSRPSVNSVVVLGSSLTLQSIQTKWR 1.8 2 N Alternative Exon N
TESVAADVAQLLIGNK 2.80E-08 1 Y
1441 42 EQLSEIK 0.12 1 Y N
TESVAADVAQLLIGNK 2.40E-08 3 Y
XP_002378109.1 111 5 EFEDAAFALQPGQVSGIVDTASGVHLIER 2.90E-06 1 Y N
SKEEAIEILR 0.00013 4 Y
XP_002380658.1 444 11 APATETSNAGSFGK 2.00E-07 1 Y N
125 4 AAKALPTHLRAPATETSNAGSFGK 3.6 1 Y
XP_002373453.1 prefoldin subunit 6 69 2 AEILQYQSQMQQQAAAASASA 2.80E-06 2 Y Alternative 3' Splice Site N
XP_002377133.1 115 3 LIAPFGVLESTR* 6.60E-08 2 Y N
VLDISNNNCIVEVSAKPSRIDSFMK* 5 1 Y
XP_002377088.1 cyclophilin 192 7 SGELESEDKGSHEEL 9.40E-08 6 Y Alternative 3' Splice Site N XP_002384637.1 phosphofructokinase 61 1 NDQTSTIYSTTEIANIIK 3.90E-06 1 Y Alternative 3' Splice Site N
XP_002379270.1 hypothetical protein 64 9 NRILNNNKK 0.00071 9 N Alternative Exon N
XP_002379566.1 conserved hypothetical protein 85 3 LLLALVSK* 0.0085 1 Y Alternative 3' Splice Site N §
Only peptides detected from the AS database search are listed. †
Peptides which were validated by synthetic peptides. ‡
Genes which had the identifications of multiple different isoforms. * Peptides which were included in the latest gene annotation.
mitochondrial acetolactate synthase small subunit UTP-glucose-1-phosphate uridylyltransferase Ugp1 14-3-3 protein sigma, gamma, zeta, beta/alpha
Alternative 3' Splice Site ribosomal protein S13p/S18e
peroxiredoxin
Alternative 5' Splice Site Alternative 3' Splice Site
Alternative 3' Splice Site
Alternative 3' Splice Site Alternative Exon Alternative 3' Splice Site
Alternative 3' Splice Site
Alternative Exon
Alternative 3' Splice Site acetyl-CoA carboxylase‡
conserved hypothetical protein
Y Y
N cystathionine beta-synthase‡
NADH-cytochrome b5 reductase
actin binding protein‡
Alternative Exon
were subsequently synthesized and analyzed by nLC-MS/MS to validate the identifications.35 At the end, the Mascot search identified 29 new proteins encoded by 26 A. flavus genes from the existing tandem mass spectra (Table 2.1). Only one new protein was identified by a single peptide. Up to 41 previously unseen MS/MS peptides were included in the matches, 34 of them had EST evidence. For those identified peptides which had no overlapped ESTs, they were mapped to genome sequences considered as transcription regions in previous annotation. All 41 peptide sequences were absent in the original protein database, indicating they were derived from different gene models. The alignments of tandem MS peptides to genomic sequences suggested that the variants were generated by several patterns of alternative splicing, including cassette alternative exons, alternative 5‟ splice site, alternative 3‟ splice site and intron retention.
Peptide sequences resulting from proteolytic digestion of the sample proteins expressed in higher eukaryotes can be present in multiple protein isoforms. These shared peptides cannot be used to discriminate between different alternative splice variants. A solid conclusion of the detection of alternative isoforms would be possible if different protein products from one gene were identified by individually unique peptides. Nine genes from our results had at least two protein variants supported by different sets of tandem MS peptides. Four patterns of alternative splicing are presented in the following examples.
y7
b4 y3
y4 b 6
y6
y9
b11 y11
b14 y12
y7
b3 y3
y4 y6 y9 y11 b14 y12 y10 b13 b9 y8 b8 y5 y2
200 600 1000 1400
m/z
200 600 1000 1400
m/z Synthetic
Endogenous
730 732 m/z
[M+2H+]2+
[M+2H+]2+
730 732 m/z
MMA = -0.480 ppm
MMA = -0.822 ppm
MS/MS MS MS/MS MS K T L L A S A I T V G S V A E
b ions →
←y ions
K T L L A S A I T V G S V A E
b ions →
←y ions
Alternative Exon
y7
b4 y3
y4 b 6
y6
y9
b11 y11
b14 y12
y7
b3 y3
y4 y6 y9 y11 b14 y12 y10 b13 b9 y8 b8 y5 y2
200 600 1000 1400
m/z
200 600 1000 1400
m/z Synthetic
Endogenous
730 732 m/z
[M+2H+]2+
[M+2H+]2+
[M+2H+]2+
[M+2H+]2+
730 732 m/z
MMA = -0.480 ppm
MMA = -0.822 ppm
MS/MS MS MS/MS MS K T L L A S A I T V G S V A E
b ions →
←y ions
K T L L A S A I T V G S V A E
b ions →
←y ions
K T L L A S A I T V G S V A E
b ions →
←y ions
K T L L A S A I T V G S V A E
b ions →
←y ions
Alternative Exon EAVSGVTIASALLTK AVLRPYTPTTMK AS Prediction Original Prediction VFTGGDQGWVDLK VFTGGDQGWVDLK VTLVYGNVTEDDILLKK TVLPEPK DQGELSGILK DQGELSGILKELGYNKDQVYK
1 2 3 4 5b
1 2 5a
EST EAVSGVTIASALLTK AVLRPYTPTTMK AS Prediction Original Prediction VFTGGDQGWVDLK VFTGGDQGWVDLK VTLVYGNVTEDDILLKK TVLPEPK DQGELSGILK DQGELSGILKELGYNKDQVYK
1 2 3 4 5b
1 2 5a
EST
alternative initiation of translation: a ubiquitous mRNA coding for the myristylated membrane-bound form, and an erythroid mRNA which generates both the soluble form and a nonmyristylated membrane-binding form.37 In comparison with the original protein of A. flavus NADH-cytochrome b5 reductase, the AS protein contained two additional exons in the middle and ended with a shorter exon (Figure 2.3). Two unique peptides EAVSGVTIASALLTK (spectrum see Figure 2.3) and AVLRPYTPTTMK were specific to the AS protein. Not only were both peptides aligned in the intron region of the original protein, they specified the splice sites of the two alternative exons and proved the translation across the constitutive and alternative exons in the AS protein. The additional exons also caused a frame shift of protein translation and resulted in an early stop site for the AS protein. Four peptides which were aligned to the last exon of the original protein, beyond the stop site of the AS variant, allowed the identification of the original protein. The peptide of the sequence EAVSGVTIASALLTK was synthesized and analyzed by the same LTQ-FT to validate the identification (Figure 2.3). Due to the higher abundance of synthetic peptide, stronger signal was observed in the tandem mass spectrometry measurements but the sequence ions of the endogenous and synthetic peptides were consistent.
613m/z614 [M+3H+]3+
MMA = 2.395 ppm
MS/MS MS Endogenous y3 b5 b9 y7
b ions →
←y ions K Q E H P Q L T S P L D S T R T
200 500 m/z 800 1100
Alternative 5’ Splice Site
613m/z614 [M+3H+]3+
[M+3H+]3+
MMA = 2.395 ppm
MS/MS MS Endogenous y3 b5 b9 y7
b ions →
←y ions K Q E H P Q L T S P L D S T R T b ions →
←y ions K Q E H P Q L T S P L D S T R T
200 500 m/z 800 1100
Alternative 5’ Splice Site
AIVAGAGTGGTITGLSR
DYNFGKDDVVVVILPDSIR
TRTSDLPSTLQPHEQK
3b
1 2 3a
4b 4a ISEVVTDPR MQLSSALLMK ISEVVTDPR AS Prediction Original Prediction EST AIVAGAGTGGTITGLSR DYNFGKDDVVVVILPDSIR TRTSDLPSTLQPHEQK 3b
1 2 3a
4b 4a ISEVVTDPR MQLSSALLMK ISEVVTDPR AS Prediction Original Prediction EST
cystathionine beta-synthase gene uses multiple transcription initiation sites to yield at least five mRNA isoforms differing at their 5‟ ends.40
The original protein of A. flavus
cystathionine beta-synthase was composed of four exons but the AS protein had only two exons with alternative 5‟ sites (Figure 2.4). Peptide TRTSDLPSTLQPHEQK (spectrum see
100 300 m/z 500 700
y1 b2
y6 y5
373m/z374 [M+2H+]2+
MMA = -0.940 ppm
MS/MS MS
Endogenous V S V V L T K
b ions →
←y ions
Alternative 3’ Splice Site
100 300 m/z 500 700
y1 b2
y6 y5
373m/z374 [M+2H+]2+
[M+2H+]2+
MMA = -0.940 ppm
MS/MS MS
Endogenous V S V V L T K
b ions →
←y ions
K T L V V S
V S V V L T K V
b ions →
←y ions
Alternative 3’ Splice Site
VSVVLTK
DELRELFANEEFASAPCLQLVELHMPRDDCPASLK P1 P2 P3P4P5 P6 P7
P3P4P5
1 2 3 5
4b 4a
1 2 3
AS Prediction Original Prediction EST LDTPLDLSLPPNDPEKEDYVVDVVLK AVHGVPGDYNLVALDYLPK NNLNPIIFVICNEGYTIER YIHGWEAVYNDIQPWDFLNIPVAFGAK P1
P2 P6
P7 EQVESSDLILSIGAIK NYGGVYAGTGSNPGVR SDFNTTGFSYR P3 P4 P5 VSVVLTK DELRELFANEEFASAPCLQLVELHMPRDDCPASLK P1 P2 P3P4P5 P6 P7
P3P4P5
1 2 3 5
4b 4a
1 2 3
AS Prediction Original Prediction EST LDTPLDLSLPPNDPEKEDYVVDVVLK AVHGVPGDYNLVALDYLPK NNLNPIIFVICNEGYTIER YIHGWEAVYNDIQPWDFLNIPVAFGAK P1
P2 P6
P7 EQVESSDLILSIGAIK NYGGVYAGTGSNPGVR SDFNTTGFSYR P3 P4 P5 LDTPLDLSLPPNDPEKEDYVVDVVLK AVHGVPGDYNLVALDYLPK NNLNPIIFVICNEGYTIER YIHGWEAVYNDIQPWDFLNIPVAFGAK P1
P2 P6
P7 EQVESSDLILSIGAIK NYGGVYAGTGSNPGVR SDFNTTGFSYR P3 P4 P5
Figure 2.4) confirmed the boundaries and linkup of the two exons for the AS protein, where peptides AIVAGAGTGGTITGLSR and DYNFGKDDVVVVILPDSIR showed the original
protein used different splice sites and translation activity occurred in the intron of the AS protein. The transcription start sites used by the two proteins were different and not in-frame. The different reading frame explained that peptide MQLSSALLMK was only found in the AS protein. The two reading frames became in-frame later in the translation, as evidenced by the shared peptide ISEVVTDPR.
Pyruvate decarboxylase (EC 4.1.1.1) catalyses the decarboxylation of pyruvic acid to acetaldehyde and carbon dioxide. Pyruvate decarboxylase has been reported in obligate aerobic filamentous fungi like Aspergillus nidulans.41 Three pyruvate decarboxylase isozymes, encoded by three structural genes PDC1, PDC5 and PDC6, have been found in yeast.42 The first three exons were constitutive exons in the original and AS proteins of A. flavus pyruvate decarboxylase PdcA, and the 3‟ splice sites of the fourth exon were alternative (Figure 2.5). For the original protein, peptide DELRELFANEEFASAPCLQLVELHMPRDDCPASLK was derived from the splicing and joining of the fourth and fifth exons, indicating one alternative 3‟ splice sites of exon four. For the AS protein, the coding region for the peptide VSVVLTK (spectrum see Figure 2.5) appeared to be inside the intron of the original protein, indicating an elongated exon four with another alternative 3‟ site as well as an alternative stop site.
200 400 m/z 600 800 y2 b5 y6 y4 b3
441m/z442 [M+2H+]2+
MMA = 2.610 ppm Endogenous MS/MS MS R S P L R P R
b ions →
←y ions
Intron Retention
200 400 m/z 600 800
y2
b5
y6
y4
b3
441m/z442 [M+2H+]2+
[M+2H+]2+
MMA = 2.610 ppm Endogenous MS/MS MS R S P L R P R
b ions →
←y ions
R S P L R P
R P R L P S R
R
b ions →
←y ions
Intron Retention
EGQVSKETEASLKEIIQSFNK EIIQSFNK
EVAAFAQFGSDLDAATK P1
P1 P2 P3
P4 RPRLPSR
STVAQLVKTLEENDAMK TGEIVDVPVGPELLGR
QAVAYRQMSLLLR VVDALGNPIDGK
P1
P2 P4
P3 3
1 2
5a
5b1 5b2
4 3
1 2 4
6 AS Prediction Original Prediction EST EGQVSKETEASLKEIIQSFNK EIIQSFNK EVAAFAQFGSDLDAATK P1
P1 P2 P3
P4 RPRLPSR
STVAQLVKTLEENDAMK TGEIVDVPVGPELLGR
QAVAYRQMSLLLR VVDALGNPIDGK
P1
P2 P4
P3 STVAQLVKTLEENDAMK TGEIVDVPVGPELLGR
QAVAYRQMSLLLR VVDALGNPIDGK
P1
P2 P4
P3 3
1 2
5a
5b1 5b2
4 3
1 2 4
6 AS Prediction Original Prediction EST
transcript variants of human ATP5A1 gene encoding the same protein have been identified. Besides the four constitutive exons, the last exon was intact in the original protein of A. flavus mitochondrial F1 ATPase subunit alpha but broken into two smaller exons in the
corresponding AS protein (Figure 2.6). The detection of the peptide EVAAFAQFGSDLDAATK suggested the intron in the AS protein was kept in the original protein. In addition, peptide RPRLPSR (spectrum see Figure 2.6) specific to the AS protein and peptides EGQVSKETEASLKEIIQSFNK / EIIQSFNK specific to the original protein were mapped back to the same coding region. These unique peptides resulted from the change of reading frames which was caused by the intron retention in the original protein.
For 17 new proteins identified from the AS database, there was no detection of the corresponding protein from the original database. In that case, MS/MS peptides alone might not be sufficient to tell the finding was the product of alternative splicing or the revision of gene annotation.
2.4 Discussion
encoded by 26 genes from the same data. The increase in the number of proteins identified from original to that of the AS database supported the hypothesis regarding to practical value of the AS database. Traditionally, the confirmation of alternatively spliced isoforms relies on the detection of different mRNA transcripts. By taking advantage of existing tandem MS data and an appropriate AS database, alternatively spliced variants can be detected more efficiently at the translation level in a large scale.
Considering a sample size of 556 original proteins identified by tandem MS analysis instead of the total 12,832 annotated genes of A. flavus, identifications of multiple protein variants of nine genes suggested that 1.6% of fungal genes were estimated to be alternatively spliced. The number is far less than the estimates in mammals like 40-60% for human genome but close to the scale of the estimated 4.2% in the basidiomycetous yeast.9 The observation supported the hypothesis regarding to the choice of the fungus model and the sufficient sensibility of the tandem MS experiment.
Current genome annotations are commonly generated by a computational pipeline and could contain errors. Recently, several research groups have already taken advantage of shotgun proteomic data to improve annotated genomes, including Homo sapiens44,
Arabidopsis thaliana45, Drosophila melanogaster46, and Caenorhabditis elegans47. It is consistently reported that many peptides were mapped to genome sequences not considered as transcription regions previously. In fact, the most recent annotation of A. flavus genome (May 27, 2009) showed that three gene models in Table 2.1 had been updated and six peptides discovered in this study can be found in the latest gene models. This suggested that the peptides identified from the AS database are correct and significant. Although we can‟t definitively rule out the possibility that some identifications as splice variants might be annotation errors, even with all the efforts of validation, alternative splicing is the most plausible explanation for those genes which have two different proteins identified.
2.5 References
1. Johnson, R. S.; Davis, M. T.; Taylor, J. A.; Patterson, S. D., Informatics for protein identification by mass spectrometry. Methods 2005, 35, (3), 223-236.
2. Roth, M. J.; Forbes, A. J.; Boyne, M. T., II; Kim, Y. B.; Robinson, D. E.; Kelleher, N. L., Precise and parallel characterization of coding polymorphisms, alternative splicing, and modifications in human proteins by mass spectrometry. Mol. Cell. Proteomics 2005, 4, (7), 1002-1008.
3. Black, D. L., Mechanisms of alternative pre-messenger RNA splicing. Annu. Rev. Biochem. 2003, 72, 291-336.
4. Modrek, B.; Lee, C., A genomic view of alternative splicing. Nat. Genet. 2002, 30, (1), 13-19.
5. Blencowe, B. J., Alternative splicing: new insights from global analyses. Cell 2006, 126, (1), 37-47.
6. Pajares, M. J.; Ezponda, T.; Catena, R.; Calvo, A.; Pio, R.; Montuenga, L. M., Alternative splicing: an emerging topic in molecular and clinical oncology. Lancet Oncol. 2007, 8, (4), 349-357.
7. Johnson, J. M.; Castle, J.; Garrett-Engele, P.; Kan, Z.; Loerch, P. M.; Armour, C. D.; Santos, R.; Schadt, E. E.; Stoughton, R.; Shoemaker, D. D., Genome-wide survey of human alternative pre-mRNA splicing with exon junction microarrays. Science 2003, 302, (5653), 2141-2144.
8. Black, D. L., Protein diversity from alternative splicing: a challenge for bioinformatics and post-genome biology. Cell 2000, 103, (3), 367-370.
9. Galagan, J. E.; Henn, M. R.; Ma, L. J.; Cuomo, C. A.; Birren, B., Genomics of the fungal kingdom: insights into eukaryotic biology. Genome Res. 2005, 15, (12), 1620-1631.
10. Bairoch, A.; Boeckmann, B., The SWISS-PROT protein sequence data bank. Nucleic Acids Res. 1991, 19 Suppl, 2247-2249.
11. Pruitt, K. D.; Tatusova, T.; Maglott, D. R., NCBI reference sequences (RefSeq): a curated non-redundant sequence database of genomes, transcripts and proteins.
Nucleic Acids Res. 2007, 35, (Database issue), D61-D65.
13. Mann, M.; Wilm, M., Error-tolerant identification of peptides in sequence databases by peptide sequence tags. Anal. Chem. 1994, 66, (24), 4390-4399.
14. Tabb, D. L.; Saraf, A.; Yates, J. R., III, GutenTag: high-throughput sequence tagging via an empirically derived fragmentation model. Anal. Chem. 2003, 75, (23), 6415-6421.
15. Tanner, S.; Shu, H.; Frank, A.; Wang, L. C.; Zandi, E.; Mumby, M.; Pevzner, P. A.; Bafna, V., InsPecT: identification of posttranslationally modified peptides from tandem mass spectra. Anal. Chem. 2005, 77, (14), 4626-4639.
16. Leipzig, J.; Pevzner, P.; Heber, S., The Alternative Splicing Gallery (ASG): bridging the gap between genome and transcriptome. Nucleic Acids Res. 2004, 32, (13), 3977-3983.
17. Holste, D.; Huo, G.; Tung, V.; Burge, C. B., HOLLYWOOD: a comparative relational database of alternative splicing. Nucleic Acids Res. 2006, 34, (Database issue), D56-D62.
18. Kim, N.; Shin, S.; Lee, S., ECgene: genome-based EST clustering and gene modeling for alternative splicing. Genome Res. 2005, 15, (4), 566-576.
19. Kim, N.; Alekseyenko, A. V.; Roy, M.; Lee, C., The ASAP II database: analysis and comparative genomics of alternative splicing in 15 animal species. Nucleic Acids Res.
2007, 35, (Database issue), D93-D98.
20. Koscielny, G.; Le Texier, V.; Gopalakrishnan, C.; Kumanduri, V.; Riethoven, J. J.; Nardone, F.; Stanley, E.; Fallsehr, C.; Hofmann, O.; Kull, M.; Harrington, E.; Boue, S.; Eyras, E.; Plass, M.; Lopez, F.; Ritchie, W.; Moucadel, V.; Ara, T.; Pospisil, H.; Herrmann, A.; J, G. R.; Guigo, R.; Bork, P.; Doeberitz, M. K.; Vilo, J.; Hide, W.; Apweiler, R.; Thanaraj, T. A.; Gautheret, D., ASTD: The Alternative Splicing and Transcript Diversity database. Genomics 2009, 93, (3), 213-220.
21. Shah, P. K.; Jensen, L. J.; Boue, S.; Bork, P., Extraction of transcript diversity from scientific literature. PLoS Comput. Biol. 2005, 1, (1), e10.
22. Yu, J.; Cleveland, T. E.; Nierman, W. C.; Bennett, J. W., Aspergillus flavus
genomics: gateway to human and animal health, food safety, and crop resistance to diseases. Rev. Iberoam. Micol. 2005, 22, (4), 194-202.
23. Squire, R. A., Ranking animal carcinogens: a proposed regulatory approach. Science
1981, 214, (4523), 877-880.
24. Wogan, G. N., Aflatoxins as risk factors for hepatocellular carcinoma in humans.