Financial
Institutions
Center
Is the Offer Price in IPOs
Informative? Underpricing,
Ownership Structure, and
Performance
by Chitru S. Fernando Srinivasan Krishnamurthy Paul A. Spindt 01-33-BThe Wharton Financial Institutions Center
The Wharton Financial Institutions Center provides a multi-disciplinary research approach to the problems and opportunities facing the financial services industry in its search for competitive excellence. The Center's research focuses on the issues related to managing risk at the firm level as well as ways to improve productivity and performance.
The Center fosters the development of a community of faculty, visiting scholars and Ph.D. candidates whose research interests complement and support the mission of the Center. The Center works closely with industry executives and practitioners to ensure that its research is informed by the operating realities and competitive demands facing industry participants as they pursue competitive excellence.
Copies of the working papers summarized here are available from the Center. If you would like to learn more about the Center or become a member of our research community, please let us know of your interest.
Franklin Allen Richard J. Herring
Co-Director Co-Director
The Working Paper Series is made possible by a generous grant from the Alfred P. Sloan Foundation
Is the Offer Price in IPOs Informative?
Underpricing, Ownership Structure, and Performance
Chitru S. Fernando Srinivasan Krishnamurthy
Paul A. Spindt*
This version: February 2002
Wharton Financial Institutions Center Working Paper # 01-33
Keywords: Initial public offerings; IPO offer price; stock splits JEL classification: G12; G14; G24; G32
* Fernando is at the University of Michigan Business School, Ann Arbor, MI 48109. Tel. (734) 936-1332.
Krishnamurthy is at the School of Management, SUNY - Binghamton University, Binghamton, NY 13902. Tel:(607) 777-6861.Spindt is at the A.B. Freeman School of Business, Tulane University, New Orleans, LA 70118.Tel. (504) 865-5413. Please address all correspondence to Chitru Fernando, University of Michigan Business School, 701 Tappan Street, D3260, Ann Arbor, MI 48109. Tel: (734) 936-1332; Fax: (734) 764-3146; Email:
We are very grateful to Jay Ritter for extensive comments and assistance on this research. We thank Franklin Allen, Rick Boebel, N.K. Chidambaran, Ranjan D’Mello, Hemang Desai, Mark Flannery, Rick Green, Prem Jain, Ernst Maug, Tom Noe, Robert Parrino, Cliff Smith, Katherine Spiess, Venkat Subramaniam, Sheridan Titman, and seminar participants at the Securities and Exchange Commission, Texas A&M University, Tulane University, and the 1999 FMA Annual Meeting for valuable discussions and comments. Shalabh Tandon and Valentin Dimitrov provided excellent research assistance. We remain responsible for all errors.
Is the Offer Price in IPOs Informative?
Underpricing, Ownership Structure, and Performance
ABSTRACT
When firms go public in an IPO, they must choose a number of shares to offer and a price level for those shares. Given an estimated total value, this division would seem to have little economic significance. Casual empiricism and the evidence from stock splits, however, suggest that firms do not choose their IPO share price level arbitrarily. We ask whether IPO prices are informative, in the sense that they relate systematically to other choices made by the firm and to firm characteristics. We find that IPO prices are informative in this sense. We find that the relationship between IPO price level and underpricing is U-shaped, and demonstrate economically significant differences across firms choosing different IPO prices in the amounts of money left on the table due to underpricing. We also find that institutional ownership and underwriter reputation are greater at higher price levels, and that post-IPO turnover is lower for high-priced IPOs than for mid-priced IPOs. Moreover, firms choosing a higher (lower) stock price level experience lower (higher) mortality rates. Taken together, our results provide strong evidence that the corporate decision that involves picking a share price level has economic significance.
1
Underwriters generally tend to price the stock of initial public offerings at between $10 and $20 per share. Occasionally, they use an IPO price of $20 or more to create prestige for the issue. If the stock is priced below $5 per share, it would be considered “penny stock” and, therefore, subject to onerous SEC rules applicable to brokers. The institutional investment community also tends to shun “penny stock” issues. To get to a price range of $10 to $20, you may need to change your stock capitalization (by stock splits or reverse stock splits) to achieve the desired IPO price, based upon the valuation of your company and the proportion of your company to be sold in the IPO. – Frederick Lipman (2000) in The Complete Going Public Handbook.
Firms have the opportunity to choose deliberately a level for their stock price both when they choose to split their seasoned shares and when they select an IPO offering price. At the IPO stage, once the firm has estimated its total value and the fraction of this value it wants to sell to the public, the division – often established with a pre-IPO stock split – into a total number of shares times a price per share would seem to have little economic significance. However, casual empiricism suggests that firms do not make this choice arbitrarily. Underwriters specifically advise their clients on setting the
price level.1 In this paper, we ask whether IPO price levels are informative, in the sense that they
relate systematically to other choices made by the firm and to firm characteristics, and find that they are.
Why should one price level be preferred to another? The stock splits literature provides some guidance, because when firms split their stock, they choose a new, “split-to,” price level for their shares. But the stock splits literature (reviewed in Section I) is divided on the question of whether
1 As noted by Lipman (2000) in the excerpt above, this decision seems to receive careful consideration. See also Blowers
et al. (1999) and Deloitte & Touche (2000). Listing requirements by NYSE and Nasdaq also limit companies’ pricing choices. These listing requirements impose minimum levels on the public float, market capitalization and number of shareholders.
2
firms split their shares to achieve a desired stock price level or to communicate managers’ private
information about the prospects of the firm.2 In any case, while we can, and have, learned much
about a firm’s price “preferences” from the stock splits literature, seasoned stock splits always occur in a historical context and cannot tell us much about a firm’s pricing choices apart from this context. Conroy and Harris (1999), for example, show that investors benchmark stock splits to a firm’s expected stock price level based on the price level it has historically maintained. But IPOs have no such history. Also, in a seasoned stock split, there is an installed base of public shareholders and analysts whose beliefs may be affected by the announcement of the price level change. IPOs have no such installed base. Moreover, the question of what systematic differences exist across firms
choosing different price levels has not been examined in the stock splits literature.3
In this paper, we show that the choice of a price level in an IPO is part of a bundle of choices the firm makes when going public, which includes the choice of underwriter and investor base. Using a sample of 5619 IPOs from 1981-1998, we examine the relationship between IPO price, and variables such as underpricing, ownership, underwriter reputation, turnover, and performance, that have been shown to be important in previous research on IPOs.
First, we examine the relationship between IPO price level and underpricing and find that this relationship is U-shaped. Prior research, e.g. Chalk and Peavy (1987) and Ibbotson, Sindelar and
2 Surveys of managers by Baker and Gallagher (1980) and Baker and Powell (1993) suggest that maintaining a preferred
price level is the primary motivation for stock splits. Studies by Lakonishok and Lev (1987), Muscarella and Vetsuypens (1996), Angel (1997), Fernando, Krishnamurthy and Spindt (1999) and Schultz (2000) provide empirical support for such a preference. In contrast, evidence of superior earnings and dividends around the split (Fama, Fisher, Jensen and Roll (1969); Asquith, Healy and Palepu (1989)) or superior performance following the split (Ikenberry, Rankine and Stice (1996), Desai and Jain (1997)) support the hypothesis that firms split their stock to signal private information.
3 An exception is Angel (1997), who investigates how measures of idiosyncratic risk, firm size and visibility affect
split-to prices in a sample of ssplit-tock splits. Also, studies by Lamoureux and Poon (1987), Maloney and Mulherin (1992), and Schultz (2000) have documented investor reactions to stock splits that may have implications for a firm’s choice of a price level.
3
Ritter (1988), has reported an inverse relationship between offer price and underpricing, with low-priced IPOs being more underlow-priced than others. We show that underpricing is higher for low-low-priced and for high-priced IPOs. That underpricing increases with price for high-priced IPOs is a new result that has not been documented previously. We investigate whether this new finding may be an artifact of the Hanley (1993) partial adjustment phenomenon and find that it is not. Regardless of whether we use the mid-point of the initial filing price range or the final offer price, our findings are the
same.4 The U-shape is robust even when we explicitly control for the price adjustment. When we
divide our sample into pre and post-1990 subsamples to allow for differences arising from the Penny Stock Reform Act of 1990, we find the U-shaped pattern in both subsamples. The U-shape remains when we control for firm size, offer size, initial turnover, fractional offer price revision and underwriter reputation.
To provide an estimate of the economic significance of the higher underpricing of high-priced IPOs, we calculate the incremental money left on the table for high-priced IPOs, relative to the
median firm in the price category at the base of the U.5 When we use the final offer price as our
measure of the IPO offer price, the average (median) incremental money left on the table is $7.9 million ($2.2 million). The total incremental money left on the table for high-priced IPOs is nearly $20 billion, and constitutes about 81 percent of the total money left on the table in these IPOs. As compared to the total money left on the table in all 5619 IPOs in our sample, this is about 68 percent. When we use the initial filing price as our measure of the IPO offer price, the average (median)
4 The initial filing price range is the price range within which the firm initially expects the offer price to lie, as disclosed
in its preliminary registration statement filed with the Securities and Exchange Commission. The final offer price is the price at which the offering eventually occurs, which may or may not be within the initial filing range.
5 See Loughran and Ritter (2001) for details on the computation and economic significance of money left on the
4
incremental money left on the table is $10.0 million ($0.9 million). The total incremental money left on the table for high-priced IPOs is around $4 billion, and constitutes about 57 percent of the total money left on the table in these IPOs. As compared to the total money left on the table in all 5619 IPOs in the sample, this is about 14 percent. Hence, our finding of higher underpricing for higher-priced IPOs is both statistically and economically significant.
Second, we provide new evidence on the relationship between IPO price and ownership structure of the post-IPO firm. Prior research has shown that ownership structure affects firm value (e.g. Morck, Shleifer and Vishny (1988) and McConnell and Servaes (1990)). In the context of IPOs, Field (1995) shows that investment by institutional investors is positively related to performance. Other research by Booth and Chua (1996), Brennan and Franks (1997), Stoughton and Zechner (1998) and Mello and Parsons (1998) suggests that the ownership structure is an important consideration driving the firm's IPO decisions. However, these papers do not establish a link between IPO price and post-IPO ownership structure. Falkenstein (1996) and Gompers and Metrick (2000) observe that institutional investors tend to avoid investing in low-priced stocks, a fact possibly relevant for IPO placement. We extend their findings by showing that higher priced IPOs experience more institutional investment. As in the case of the U-shape in underpricing, this result is both statistically and economically significant. Institutional investors may prefer high-priced issues because they are more liquid and have lower transactions costs (as in Gompers and Metrick (2000)), because they are viewed as more prudent investments (as in Del Guercio (1996)) or because they are thought to have higher quality (as in Badrinath, Gay and Kale (1989) or Lipman (2000)). Since more reputed underwriters are likely to have better access to institutional investors, we also investigate
5
whether high-priced IPOs are more likely to be underwritten by more reputed underwriters. Our empirical results confirm that this is true.
Our finding of a U-shaped relationship between IPO price and underpricing and a positive relationship between offer price and institutional ownership suggests that different theories of IPO underpricing may apply to high and low-priced IPOs. Our finding of higher underpricing of high-priced IPOs is consistent with theories that suggest an important role for institutional investors, such as Benveniste and Spindt (1989), who model underpricing as the cost of compensating informed investors for truthfully revealing the information they have, and Stoughton and Zechner (1998), who model underpricing as compensation for future monitoring services. Our findings for low-priced IPOs are consistent with theories that suggest an important role for small uninformed investors, such as Rock (1986), who models IPO underpricing as compensation to uninformed investors for the winner’s curse, Brennan and Franks (1997), who show that firms may choose to ration the allocation of shares in favor of small, diffuse investors in order to preserve private benefits of control, and Booth and Chua (1996), who argue that firms may choose a lower price to promote diffuse ownership.
Third, we investigate whether the pattern of trading in the immediate after-market is systematically related to IPO prices. Prior research has examined trading behavior immediately following the IPO. Krigman, Shaw and Womack (1999) show that initial turnover of the firm’s shares is positively related to underpricing, and that block trades, presumably by institutions, account for a large fraction of initial turnover. Moreover, there is considerable evidence (e.g. McInish and Wood (1992)) that transactions costs are inversely related to the price, which may also influence trading. When we examine the relationship between offer price and initial turnover, we find an
6
inverted U-shaped relationship. Low-priced IPOs trade relatively less, perhaps because they are more expensive to trade and/or because they are bought by retail investors who do not flip their IPO allocations. Surprisingly, high-priced IPOs also trade relatively less, although they are relatively more underpriced. Since institutional ownership is most concentrated in these IPOs, this finding is significant, given the results of Krigman, Shaw and Womack (1999). Our results suggest that high-priced IPOs are bought by institutions as long-term holdings, whereas intermediate-high-priced IPOs are more likely to be flipped by the institutions that receive them in the initial allocation.
Finally, we analyze whether the IPO price is related to a firm's viability. Since institutions are widely thought to be better-informed investors, our finding that institutions seem to prefer buying and holding high-priced IPOs also suggests that high-priced IPOs may outperform low-priced IPOs. We analyze whether IPO price can explain the likelihood that a firm will later experience financial distress. We find that high-priced IPOs are less likely to delist due to financial distress in the first five years after the IPO. These results are robust to controlling for market capitalization and
underwriter reputation.6 High-priced IPOs appear to be better firms. Hanley (1993) finds no
connection between underpricing and long-run performance of IPOs. Our results suggest that the connection is non-monotonic: high-priced IPOs are more underpriced than intermediate-priced IPOs but subsequently perform better while low-priced IPOs are also more underpriced but subsequently perform worse.
6
These results are consistent with the findings of Seguin and Smoller (1997) who show (for their sample of newly listed Nasdaq stocks) that the share price contains information about the long-run performance of listed firms. They find that the probability of distress delisting decreases monotonically with the initial price (defined as the closing price at the end of the first listed day) after controlling for market capitalization. They also show that low-priced stocks earn lower risk-adjusted returns than high-priced stocks.
7
Our finding of systematic differences across firms that pick different price levels when going public contradicts the widely held belief that the choice of one price level over another is a “neutral mutation.” It is possible that an unobserved variable drives the choice of price, underpricing,
ownership, etc.However, as suggestedespecially by the U-shaped relationship between IPO price
and underpricing, our results may also be indicative of an optimal stock price. While the splits literature has provided evidence of a preferred stock price, it has not conclusively established, as we
do, that the choice of one price over another is associated with significant economic effects.7
The rest of the paper is organized as follows. In the next section, we review the relevant literature on the significance of the stock price level. Section II describes our data. In Section III, we present our results on the relationship between IPO price and underpricing. In Section IV, we document the links between IPO price and ownership structure, and between IPO price and underwriter reputation. We report the relationship between IPO price and initial turnover in Section V. Section VI presents our results on how IPO price is related to distress delisting. Section VII concludes.
I. The Significance Of The Stock Price Level
In this section, we review the literature that pertains to the significance of the stock price level, to provide the context for our analysis. The existing literature in this area can be classified into two streams.
One stream of literature has investigated splits of seasoned stock issues (where a firm changes its share price level). Surveys of managers by Baker and Gallagher (1980) and Baker and
7
8
Powell (1993) have documented that maintaining a preferred price level is the primary motivation for managers to undertake stock splits. Several studies have provided empirical support for such a preference. Lakonishok and Lev (1987) argue that stock splits are undertaken primarily to restore share prices to a “normal” range following a period of unusual growth. Muscarella and Vetsuypens (1996), who study American Depositary Receipts (ADRs), report that prior to their issuance in the U.S., “ADRs are deliberately ‘packaged’ (in terms of the number of home shares represented by one
ADR) to achieve a target U.S. price level.” 8 Angel (1997) suggests that firms seek to maintain their
stock price in an optimal trading range in order to achieve an optimal tick size. Fernando, Krishnamurthy and Spindt (1999) show that splits increase marketability of shares to retail investors, and Schultz (2000) concludes that splits broaden the shareholder base by encouraging the purchase of a firm’s stock by small investors.
But the stock splits literature is divided on the question of whether firms split their shares to achieve a desired stock price level or to signal private information. Fama, Fisher, Jensen and Roll (1969) and Asquith, Healy and Palepu (1989) argue in favor of the signaling hypothesis by providing evidence of superior earnings and dividends by splitting firms around the split. Moreover, Ikenberry, Rankine and Stice (1996) and Desai and Jain (1997) demonstrate that splitting firms significantly outperform by about 7 percent in the year following the split and by about 12 percent in the three years following the split. Conroy and Harris (1999) suggest that both hypotheses may be valid by showing that investors benchmark stock splits to a firm’s expected stock price level based on the price level it has historically maintained. They show that abnormal returns following the announcement of a split and analysts’ forecast revisions are significantly higher when the split factor
9
is larger than anticipated. Hence, it is difficult to isolate the effect of the price change from the signaling effect.
The second stream of literature has studied whether institutional investors invest differentially in stocks trading at different price levels. Falkenstein (1996) and Gompers and Metrick (2000) provide evidence that institutions seem to avoid investing in low-priced stocks. This preference could be driven by the higher transactions costs associated with low priced stocks. McInish and Wood (1992) show that the percentage bid-ask spread decreases with price levels. It is also possible that institutions may avoid investing in low-priced stocks, since these may be viewed negatively as "penny stocks". While the existing evidence links price level and institutional investment in seasoned stocks, it is as yet unknown whether this institutional preference for high-priced stocks also applies in the case of IPOs.
Taken together, the extant literature strongly suggests that systematic differences may exist across firms choosing different price levels when they go public. We explore this issue rigorously in the rest of the paper.
II. Data
A. The Sample
From the Global Financing Database of the Securities Data Company (SDC), we identify all initial public offerings of common stock by domestic (US) firms during the period 1981 to 1998. We require that the stock market data for the firm be available on the Center for Research in Security Prices (CRSP) tapes. We also require that the initial filing information be available. We then use
10
several screens to get the final sample of IPOs. We exclude IPOs of closed-end funds, REITS, and ADRs, retaining only IPOs of corporations (CRSP share code 10 or 11) in our sample. We include IPOs if common stock was the only security that was issued, and exclude IPOs where the issue was for units comprised of common stock and some other security. We also require that the IPO be listed on CRSP NYSE/AMEX/Nasdaq combined tapes not more than two months (42 trading days) after the offer date. This restriction reduces the possibility that our sample firms have traded elsewhere. Finally, to avoid possible data errors, we check that (a) the offer date is on or before the first trading date on CRSP, (b) the number of shares outstanding on the CRSP tapes is not less than the number of shares offered in the US and (c) the percentage institutional ownership is less than 100 percent. This gives us a final sample of 5619 IPOs.
We collect offering data (filing price which is computed as the mid-point of the initial price range, offer price, number of shares offered and offer date) and the identity of the lead underwriters from the SDC database. The closing price at the end of the first trading date, number of shares outstanding after the IPO and trading volume are taken from the CRSP tapes. Data on institutional ownership after the IPO comes from various issues of the S&P Stock Guide. The underwriter reputation ranking is from Carter and Manaster (1990) for IPOs prior to 1985 and from Carter, Dark and Singh (1998) for subsequent IPOs.
For each firm, we calculate underpricing as the raw return from the offer price to the closing price on the first trading day. Firm size is the market value of equity, computed as the product of the offer price and the number of shares outstanding on the first trading day. Similar to Chen and Ritter (2000), we compute issue amount as the gross proceeds from the IPO (offer price times number of
11
shares offered) excluding over-allotments.9 We adjust firm size and issue amount for price level
changes using a seasonally adjusted GDP deflator.10 The offer fraction is the number of shares
offered in the IPO as a percentage of the total number of shares outstanding after the IPO. For any given day, we compute the daily share turnover as the ratio of daily trading volume to the number of shares issued in the IPO (the 'float'). Average turnover is defined as the average of the daily share turnover over 100 days starting with the second week after listing. The first week (initial) turnover is the average of the daily share turnover over the first five days (one-day) of trading. The fractional offer price revision is the difference between the initial filing price and the final offer price, divided by the initial filing price. We measure post-offer institutional ownership using various issues of the
S&P Stock Guide.11 We report institutional ownership as a fraction of the total shares outstanding
after the IPO.
B. Sample Characteristics
The average size of the firms in our sample (in constant 1998 dollars) is about $161 million and the median is about $75 million (Table I). The post-IPO institutional ownership averages about 11 percent. The average IPO exhibits substantial trading activity in the post-IPO period. The mean initial turnover is about 53 percent, suggesting that a little more than half the number of shares issued in the IPO changes hands on the first day itself. This is comparable to the mean initial turnover of
9
Ellis, Michaely and O'Hara (2000) find that 41 percent of the entries on SDC relating to actual use of the overallotment option are incorrect.
10
We obtain data on GDP price deflator (chain type) from the Dallas Federal Reserve Bank at http://www.dallasfed.org.
11 If the data is available in the S&P Stock Guide that is issued three months after the offer date, we use that as our
measure of institutional ownership. If the data is not available in that issue, we use the Stock Guide issued six months after the offer date. If the data is still unavailable, we set it as missing.
12
61.9 percent documented in Ellis, Michaely and O'Hara (2000). The mean daily turnover in the first week is almost 17 percent, and averages 1.9 percent in the 100 trading days starting with the second week after listing.
[Insert Table I about here]
The average (median) offer price is $11.06 ($11.00) per share. The mean filing price is higher at $11.28. On average, the offer price is revised downwards by 1.9 percent from the initial filing price, and the median revision is zero. This is similar to the findings in Hanley (1993), who documents a mean (median) revision of -4.3 (0.0) percent for a sample of 1430 IPOs from 1983 to 1987. The average ranking for the lead underwriters is 7.3. The average (median) issue amount excluding any over-allotments (constant 1998 dollars) is approximately $45 million ($24 million). This is larger than the average gross proceeds of $15 million for a sample of 1526 IPOs during 1975-1984 documented by Ritter (1991). An average of almost 35 percent of the post-issue firm is sold in the IPO. The IPOs in our sample exhibit a mean underpricing of 13.12 percent, which is similar to what other researchers have documented. However, the median underpricing is much lower at 5.68 percent. We compute the average money left on the table as the product of the number of shares sold in the IPO multiplied by the first day's price change. The average IPO left $5 million on the table, but the median is much smaller at $0.8 million. The mean (median) money left on the table is about 3 percent (1 percent) of the mean (median) IPO equity market value.
III. IPO Price and Underpricing
In this section, we document the relationship between IPO price and underpricing in our sample of IPOs. Controlling for firm size, fractional offer price revision, initial turnover, offer
13
fraction, and underwriter reputation, underpricing exhibits a robust U-shaped pattern in IPO price. Both high-priced and low-priced IPOs are more underpriced relative to intermediate-priced IPOs.
A. Underpricing and IPO Price – Univariate Tests
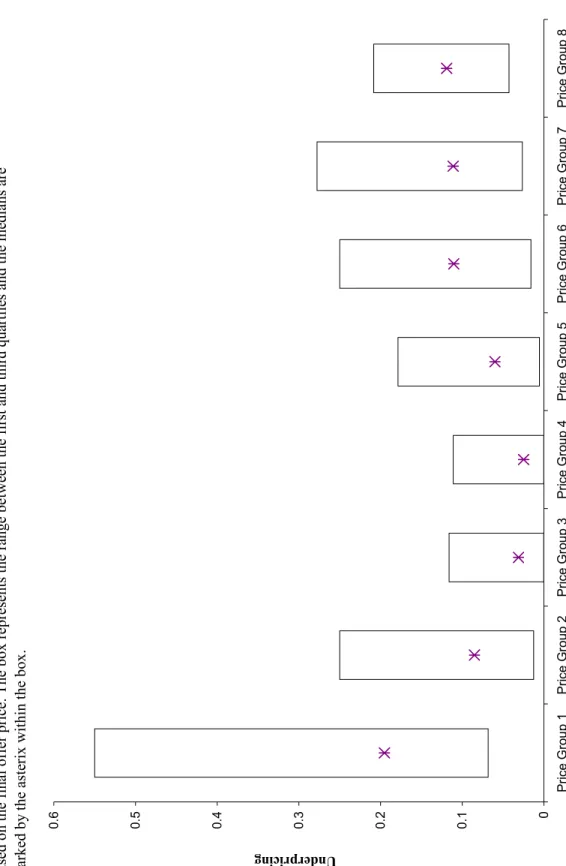
We first examine the univariate relationship between IPO price and underpricing. We divide the sample into eight portfolios based on either the final offer price or the mid-point of the initial pricing range (filing price). We create portfolios at $3 intervals to ensure that we have adequate dispersion in price among the portfolios. Portfolio 1 consists of the IPOs with price less than $3 per share, and portfolio 8 consists of those IPOs priced at $21 or more per share. We report the underpricing for each of these portfolios. The results in Table II show a pronounced U-shaped pattern in underpricing as a function of both the final offer price and the initial filing price. Considering the final offer price based portfolios first (Panel A), the median underpricing in portfolio 1 is 19.53 percent. It declines monotonically through portfolio 4, which averages 2.5 percent. The underpricing then starts increasing and is 11.90 percent in portfolio 8. A similar pattern emerges when we
examine the 25th and 75th percentile of underpricing in each of the portfolios.12 When we construct
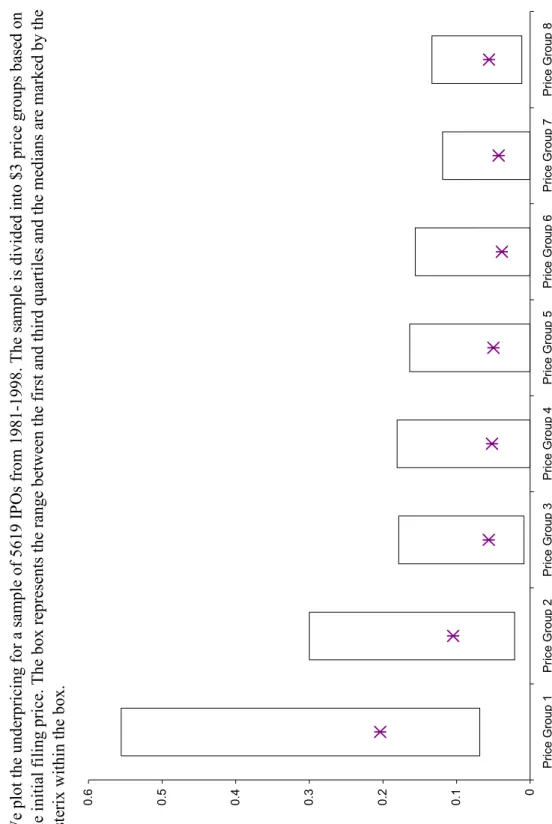
portfolios using the initial filing price instead of the final offer price, we observe a similar pattern (Panel B). The median underpricing declines from 20.38 percent in portfolio 1 to 3.85 percent in portfolio 6. The median underpricing increases to 5.59 percent in portfolio 8. The pattern is similar
when we examine the 25th and 75th percentile underpricing, suggesting that the underpricing is higher
both for high-priced and low-priced IPOs. The patterns are illustrated in Figures 1 and 2.
12 The mean underpricing measures in our sample appear to be distorted by the large number of outlier observations that
experienced very high price run-ups during our sample period, especially in the 1990s. Hence, we focus on the median underpricing measures, which are more reliable under these conditions.
14
[Insert Table II, and Figures 1 and 2, about here]
The evidence above indicates that IPO underpricing varies unconditionally in a non-linear fashion with both initial filing price and the final offer price. However, Stoll and Whaley (1983) document a positive association between market value of equity and price per share for common stocks. There is evidence that a similar positive relationship between offer price and firm size exists in our sample. The Pearson correlation between initial filing price (final offer price) and firm size is 0.38 (0.40). Thus, it is not clear if the variation in underpricing is due to firm size rather than price. In addition, other variables have been shown in the prior literature to affect IPO underpricing. We turn our attention to these issues below and verify whether this non-linear pattern is robust to these controls.
B. Underpricing and IPO Price – Multivariate Tests B.1 Control Variables
The winner’s curse hypothesis as developed by Rock (1986) argues that underpricing arises to compensate uninformed investors for the adverse selection problem they face. Koh and Walter (1989) provide empirical support for the Rock (1986) model. We expect adverse selection to be more of an issue if the ex-ante information asymmetry is higher. Therefore, ceteris paribus, IPOs that are more likely to be subject to depressed valuation due to information asymmetry will exhibit higher underpricing. As argued by Beatty and Ritter (1986) and Tinic (1988), smaller issues are more likely to be speculative in nature and offered by start-up firms. Moreover, in the presence of fixed information costs, the relative cost of information may be high even for larger firms when a smaller fraction of their equity is offered to the public. Hence, we use offer fraction (number of shares
15
offered as a percentage of total shares outstanding after the IPO) and log of the issue amount ($ million) as alternative proxies for ex-ante uncertainty of the IPO. We expect a negative relationship between underpricing and both offer fraction and log of issue amount. On the other hand, an investment banker could use underpricing as a way to reduce marketing effort, which will be greater for larger issues (Baron (1982)). This would imply a positive relationship between both offer fraction and log of issue amount, and underpricing.
Benveniste and Spindt (1989) argue that underwriters use underpricing (along with preferential allocation) to induce informed investors to reveal their private information. They suggest that if favorable information is revealed in the pre-market, the underwriter responds by increasing the offer price to partially reflect this information. These IPOs would be priced in the upper part of the initial offer price range. Their allocation is rationed and they would be more underpriced. Under this partial adjustment hypothesis, we expect to see a positive relationship between underpricing and the fractional offer price revision. Hanley (1993) empirically shows that underpricing is positively related to the percentage revision in offer price from the original filing price. Hence, we include offer price revision as a control variable.
Several theoretical and empirical papers suggest that underwriter reputation is related to underpricing. For example, Carter and Manaster (1990) develop a model in which more reputed underwriters market lower-risk and higher-quality IPOs. Hence, we include underwriter reputation as a control variable. Confirmatory evidence that underwriter reputation is negatively related to underpricing is presented in Carter and Manaster (1990) and Carter, Dark and Singh (1998). However, a recent article by Beatty and Welch (1996) documents that this relationship may have reversed in the 1990s. Various signaling theories (e.g. Allen and Faulhaber (1989) and Grinblatt and
16
Hwang (1989)) hypothesize that underpricing is a positive signal of a firm’s value, since only “good firms” will be able to recoup the cost of underpricing in a subsequent equity issue. But the available empirical evidence in Jegadeesh, Weinstein and Welch (1993) and Michaely and Shaw (1994) does not support the implications of the signaling models. To the extent that underwriter reputation acts as an alternative signal of firm quality, we would expect IPOs marketed by more reputed underwriters to be underpriced by a smaller amount.
We include the initial turnover as an additional control variable. Ellis, Michaely and O'Hara (2000) show that the trading volume in the "hot" IPOs is more than double that of the other IPOs. Krigman, Shaw and Womack (1999) show that the mean initial turnover in "cold" IPOs is 46.5 percent, compared to 150.4 percent for the "extra hot" IPOs. Hanley (1993) also finds a similar result. Increased turnover in the after-market could be a measure of the extent of rationing in the pre-market. This could be especially true if the participation of some investors in the pre-market is limited. In that case, the offer price adjustment may not fully reflect all the information available in the aggregate market. This information would be revealed as investors trade in the aftermarket. Hence, we would expect a positive relationship between initial turnover and underpricing. Additionally, we include log of firm size as a control variable to verify if IPO price is related to underpricing, independent of firm size.
B.2 Regression Results
Since our focus is on the relationship between price and underpricing, we estimate multivariate regressions of underpricing on either the initial filing price or the final offer price, after including the control variables. The univariate results we report above suggest that underpricing is
17
higher both for high-priced and for low-priced IPOs. To capture this nonlinear pattern, we use both price and its square as our main explanatory variables. The results in Table III support this nonlinear pattern in underpricing - the coefficients on price and its square are negative and positive respectively, and are statistically significant at the one-percent level. These results hold both when we use the initial filing price and the final offer price.
[Insert Table III about here]
We report the results of OLS regressions of underpricing on the explanatory variables and control variables in Table III. In the first set of regressions, we include only the price and its square. The coefficients in the filing price and its square are negative and positive respectively, and are statistically significant at the one-percent level (model 1). When we use the final offer price instead of the initial filing price, the inferences are similar (model 2). This result confirms the univariate pattern we have documented earlier. In model 3, we regress the control variables on underpricing. The coefficients on initial turnover and fractional offer price revision are significantly positive at better than the one-percent level of significance (t = 17.0 and t=28.0 respectively). Firm size and the offer fraction are negatively related to underpricing (t = -4.0 and -5.4 respectively). However, underwriter reputation is unrelated to underpricing, possibly because the relationship has changed in the 1990s as has been documented in prior research.
We include filing price and the square of filing price as our main explanatory variables along with all the control variables in the full model (model 4). The coefficients on filing price and its square are in turn significantly negative (t = -8.5) and significantly positive (t = 5.9), as predicted by our univariate results. The coefficients for initial turnover, firm size and fractional offer price revision are significantly positive. Offer fraction remains negatively related to underpricing, and
18
underwriter reputation is not significant. This evidence of a non-linear U-shaped relationship between underpricing and the IPO price strongly supports the univariate results that we have documented earlier. In model 5, we re-estimate the full model by including the final offer price and its square instead of filing price and its square. The results are unchanged, the coefficients on price and its square are negative and positive respectively, and are significant at the one-percent level.
To summarize, the results strongly support a U-shaped relationship between underpricing and both initial filing price and the final offer price. The coefficients on price and its square are of the correct sign and statistically significant at the one-percent level or better in all regression specifications in Table III. We use the initial filing price since the choice of initial filing price is made before the IPO is marketed. The final offer price incorporates information that the firm and underwriter acquire in the pre-marketing. However, our inferences are similar if we use offer price instead of filing price. We control for the partial adjustment phenomenon in two ways: by (a) using the mid-point of the initial filing price (which is chosen before selling activities commence); and (b) including the offer price revision as a control variable. We also include initial turnover, firm size, offer fraction and underwriter reputation as additional control variables. Our results are robust to these controls. This result is new to the literature. In the next subsection, we conduct a variety of robustness checks to verify that our inferences are unchanged.
B.3. Robustness Checks
In this section, we report the results of various robustness checks to confirm the veracity of our results. We re-estimate models 4 and 5 in Table III to investigate whether the coefficients on filing price and its square (or final offer price and its square) are negatively and positively related to
19
underpricing, after including all the control variables. The results indicate that the finding of a non-linear relationship between price and underpricing is robust across all the specifications that we
investigated. We report our results in brief as follows. 13
As shown by Ruud (1993), Schultz and Zaman (1994) and Aggarwal (2000), underwriters may stabilize stock prices in the after-market. They could (i) post a stabilizing bid at or just below the offer price; (ii) use penalty bids to reduce flipping of overpriced IPOs; or (iii) oversell the issue and cover their short position through after-market purchases. The underpricing could thus be left-censored at zero percent. Consequently, we re-estimate both the full model regressions in Table III
using a Tobit model instead of the OLS specification.14 Our main result that underpricing exhibits a
U-shaped pattern in filing price remains unchanged.
In our sample selection, we allow the sample firms to be initially listed up to 42 trading days after the offer date. Most of our sample firms list within three days of the offer date. However, it is likely that a few firms in our sample could have traded on the bulletin board or elsewhere and that the closing price that we use is stale. We repeat this analysis using a sub-sample of IPOs which listed on an exchange (NYSE / AMEX / Nasdaq) within three days of the IPO offer date. Our inferences are unchanged. The coefficients on price and its square are still significantly negative and positive, respectively.
The 1990s has seen a tremendous growth in the number of high tech and internet related IPOs. Several IPOs have seen tremendous price increases in the first day of trading, which is very different from the earlier period. Beatty and Welch (1996) note that contrary to prior research,
13
20
underwriter reputation was positively related to underpricing in their sample of IPOs (1992-1994). Besides, the Penny Stock Reform Act became effective during 1991. This imposed a heavy burden on market making activities for low-priced stocks. Consistent with this, Seguin and Smoller (1997) show that after 1991, penny stocks constituted only a very small fraction of all firms listing on the Nasdaq. Consequently, the characteristics of IPOs in the two periods may be different. Hence, it is interesting to verify whether our results are robust across time. We divide our sample into two periods 1981-1990 and 1991-1998. We replicate both the full model regressions in Table III for these two sub-periods separately. Our main conclusion - that there is a U-shaped pattern in underpricing - is unaltered. In both sub-periods, the coefficients on filing price and its square (or final offer price
and its square) are negative and positive respectively, and are statistically significant. 15
As additional checks, we replicate our results (a) excluding low-priced IPOs (less than $4); (b) excluding both low-priced IPOs and outliers (underpricing > 100%); (c) replacing the offer fraction with the log of gross proceeds of the IPO, and (d) including a dummy variable for exchange listing (1=NYSE/AMEX, 0=Nasdaq). Our inference of a statistically significant non-linear relationship between price and underpricing is unchanged.
Our results thus far suggest that underpricing is statistically higher both for high-priced and for low-priced IPOs. That underpricing is higher for low-priced IPOs has already been documented earlier (e.g. Chalk and Peavy (1987)). However, our finding that underpricing is also higher for high-priced IPOs is new to the literature. To provide an estimate of the economic significance of this 14
Strictly speaking, the data is not left-censored at zero percent since we also observe that some IPOs are overpriced (negative underpricing). However, the Tobit specification has been used in the literature (see Ruud, (1993)).
15
Consistent with Beatty and Welch (1996), we find that the coefficient on underwriter reputation is negative only in the 1981-1990 period, but is not significant in the 1991-1998 period.
21
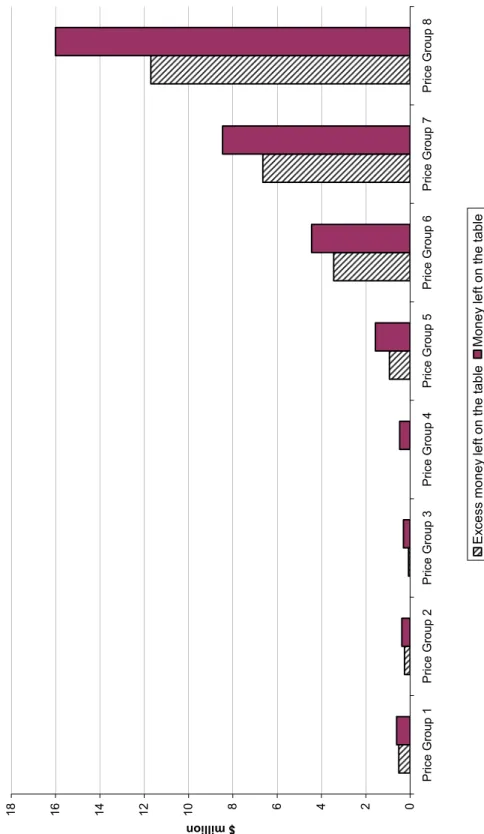
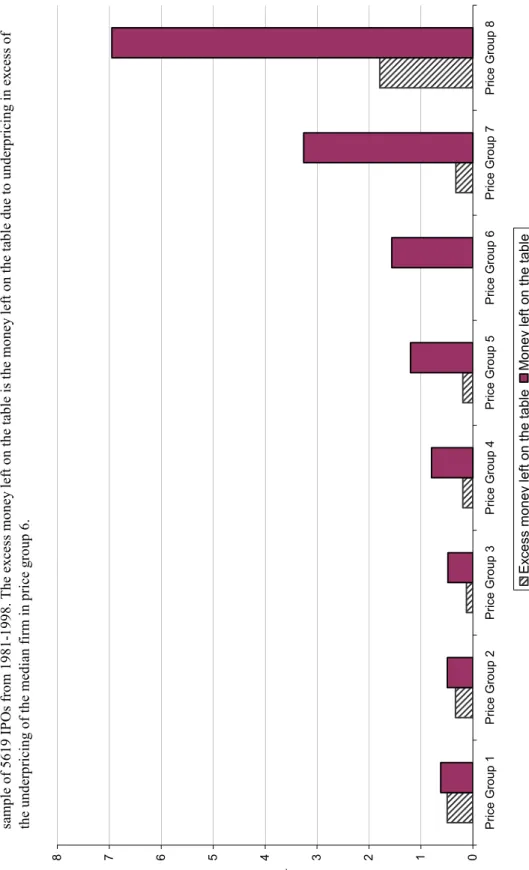
result, we calculate the incremental money left on the table, as follows. The results in Panel A of Table II suggest that the underpricing is higher in final offer price based portfolios 5-8. In the absence of the upswing in underpricing, we assume that the expected underpricing in these portfolios would be similar to that of a typical, median firm in portfolio 4, i.e. 2.5 percent. Hence, the expected end of first day price would be 2.5 percent higher than the final offer price. The incremental price change on the first day is the difference between the actual day one closing price and the expected day one closing price, computed as above. For a given firm in portfolios 5-8, we compute the incremental money left on the table by multiplying the number of shares offered in the IPO and the incremental price change on the first day. The average (median) incremental money left on the table is $7.9 million ($2.2 million). The total money left on the table for high-priced IPOs is nearly $20 billion, and constitutes about 81 percent of the total money left on the table in these IPOs. As compared to the total money left on the table in all 5619 IPOs in the sample, this is about 68 percent. We illustrate this further in Figure 3 by plotting the excess money left on the table for a median firm across each offer price group, relative to the median firm in price group 4. A U-pattern is clearly evident. We replicate this analysis for the filing price based portfolios 7-8. The average (median) incremental money left on the table is $10.0 million ($0.9 million). The total money left on the table for high-priced IPOs is around $4 billion, and constitutes about 57 percent of the total money left on the table in these IPOs. As compared to the total money left on the table in all 5619 IPOs in the sample, this is about 14 percent. The pattern across the different filing price groups for a median firm in each group is illustrated in Figure 4, again revealing a U-shape. Figures 5 and 6 plot the money left on the table and the excess money left on the table separately across each of the price groups for a median firm in each group, for final offer price and initial filing price, respectively. It is very
22
evident that the major economic effect of the underpricing U-shape is for high-priced IPOs. Hence, our finding of higher underpricing for the higher-priced IPOs is not only statistically significant, but is also economically very significant since it constitutes a large fraction of the total amount of money left on the table in IPOs.
[Insert Figures 3-6 about here]
The robust and significant relationship between IPO price and underpricing that we document in this section has implications for existing theories of IPO underpricing. Since many of these theories explain underpricing in the context of ownership structure, we next turn to the issue of how IPO price may be linked to ownership structure.
IV. IPO Price, Ownership, and Underwriter Reputation
In this section, we document the relationship between IPO price and institutional investment in our sample of IPOs. Controlling for size differences across firms, average turnover, underwriter reputation and underpricing, we establish that institutional investment is higher in IPOs that are offered at a higher price. We also show that high-priced IPOs are underwritten by more reputed underwriters.
A. IPO Price and Institutional Investment
We begin our analysis by exploring whether the IPO price is related to the ownership structure that results after the IPO. Specifically, we investigate whether institutions invest more in high-priced IPOs. In Section I, we reviewed the literature that links the price level and institutional investment in seasoned firms. In addition to price level, there could be other characteristics that
23
influence the investment decision of institutional investors. There is some evidence that institutions prefer investing in larger stocks. One reason could be the effect of prudent-man laws in biasing institutional investment towards higher quality, large capitalization stocks, as documented by Del Guercio (1996). Additionally, reputed underwriters have an incentive to protect their reputational capital by underwriting high quality IPOs. Thus, we expect a positive relationship between institutional ownership and both firm size and underwriter reputation. Falkenstein (1996) shows that mutual fund demand is higher for stocks with higher monthly turnover. If higher trading volume indicates lower transactions costs, we expect the average turnover to be positively related to institutional ownership. It is possible that based upon the extent of underpricing, some institutions will have flipped their shares in the aftermarket (Krigman, Shaw and Womack (1999)). Hence, we include underpricing as an additional explanatory variable.
In Table IV, we report the results of various regressions using the percentage post-IPO institutional ownership as the dependent variable and either the initial filing price or the final offer price as our primary explanatory variable. Based on the discussion above, we include log of firm size, underwriter reputation, average turnover and underpricing as control variables. Univariate regressions in models 1 and 2 show that both filing and offer prices are significantly positively related to institutional ownership. When we include all the control variables in model 3, we show that consistent with our discussion above, underwriter reputation is significantly positively related to institutional ownership. However, firm size and average turnover are negatively related to institutional ownership. When we include the filing price or the offer price in models 4 and 5, we find that they remain significantly positive (t-value = 8.1 and 6.0 respectively). An increase in the
24
4.6 percent in institutional investment. This increase is economically significant, representing almost 40 percent of the mean institutional investment of around 11 percent in our sample. A similar increase in the final offer price from $7 to $14 is associated with an increase of 3.5 percent in institutional investment, which is about 35 percent of the average institutional investment in our sample. Hence, post-IPO institutional ownership is significantly impacted by the price level, both statistically and in economic terms.
[Insert Table IV about here]
B. IPO Price and Underwriter Reputation
We have shown that institutional investment is higher in high-priced IPOs. Since more reputed underwriters are likely to have access to a large pool of institutional investors, we expect that high-priced IPOs, that are directed more towards institutions, will be underwritten by more reputed underwriters. We estimate the following regression using the average underwriter reputation (AVGUW) as the dependent variable, and the natural log of market capitalization (LNMVE) and either the IPO filing price (FILPRC) or the final offer price (OFRPRC) as explanatory variables (t-values in parentheses):
AVGUW = 2.5789 + 0.0980 * FILPRC + 0.8021 * LNMVE
(29.2) (13.7) (28.7)
Adj. R2 = 41.6%; N = 4749
AVGUW = 2.6537 + 0.0528 * OFRPRC + 0.9091 * LNMVE
(29.0) (7.8) (30.8)
Adj. R2 = 40.1%; N = 4749
(1)
25
The results strongly suggest that high-priced IPOs are more likely to be underwritten by more reputed underwriters. The coefficient on both filing price and offer price is positive and significant at less than the one-percent level of significance. This result holds after we control for market capitalization, adjusted for inflation.
C. Implications For Theories Of IPO Underpricing
The evidence presented above demonstrates a positive relationship between IPO prices and post-IPO institutional ownership, even after controlling for size differences across IPOs, underwriter reputation, underpricing and average turnover. In the previous section, we have documented a similarly robust U-shaped relationship between underpricing and the IPO price. Taken together, this evidence has significant implications for extant theories of IPO underpricing that are based on differences across investors.
These models of IPO underpricing are based on the information asymmetries that prevail between the different classes of investors associated with the IPO. For example, Benveniste and Spindt (1989) model the IPO process as one where underwriters rely on a clientele of large informed investors to provide information about the value of the firm being offered. The underwriter uses this information to refine the value of the offering. Underpricing in the Benveniste and Spindt (1989) model represents compensation to these investors for truthfully revealing their information. A recent paper by Stoughton and Zechner (1998) suggests that firms may choose to ration the allocation of IPO shares in favor of large, institutional investors for the monitoring benefits they are expected to provide. Underpricing represents compensation for expected future monitoring services.
26
example, Brennan and Franks (1997) suggest that the managers may want to consume perquisites or other private benefits of control. These entrenched managers would not want to subject themselves to monitoring by large outside shareholders. Since small, dispersed shareholders are less likely or less able to monitor the managers' actions, these firms will market the IPO mainly to small investors. It is also possible that some firms may not gain from increased monitoring by institutional investors, but could face a significant cost. If some institutional investors are more interested in short-term price appreciation, they could force the firm to forego potentially valuable long-term investments (such as R&D). A recent article by Bushee (1998) suggests that ownership by institutions that engage in momentum trading significantly increases the probability that managers reduce R&D to reverse an earnings decline. Beatty and Welch (1996) suggest that some high quality firms may choose a lower price. The lower price results in an increase in the trading commissions, and hence increases analyst following (as in Brennan and Hughes (1991)). These firms may choose a lower price, but not for "value-decreasing" reasons. Both types of firms will choose a lower price, and will be targeted towards a more retail investor clientele who are less able to differentiate between good and bad firms. The resulting pooling equilibrium will lead to a winner's curse problem and underpricing as in Rock (1986). There is a higher propensity for such investors to invest in low-priced IPOs. This could be because it is easier for retail investors to get an allocation of such IPOs due to a combination of reduced interest from large investors and a higher float. This could also be because retail investors seem to prefer lower prices, as suggested by the findings of Schultz (2000). The Rock (1986) framework suggests that underpricing will increase as the offer price drops. The prediction that low-priced IPOs targeted more towards retail investors will exhibit higher underpricing is also consistent with other explanations of IPO underpricing. Booth and Chua (1996) argue that firms may choose a
27
lower price to promote diffuse ownership. Since this would be associated with higher total information costs, these issues would be underpriced by larger amounts. Chalk and Peavy (1987) advance the explanation that the higher underpricing of low-priced IPOs that they observe in their sample represents a premium for above-average risk associated with stocks priced at $1.00 or less. Ibbotson, Sindelar and Ritter (1988) show that IPOs priced at less than $3.00 exhibit much larger underpricing, on average, than high-priced IPOs. They hypothesize that more speculative issues tend to have offering prices below $3.00.
The U-shaped pattern between IPO price and underpricing, together with the relationship between IPO price and ownership structure, suggests that different theories of IPO underpricing may apply to high and low-priced IPOs. Theories that explain underpricing as the reward to institutional investors for the information they provide during the IPO process or the monitoring they provide after the IPO are consistent with the underpricing behavior of high-priced IPOs. Theories that explain underpricing as compensation to uninformed retail investors for the costs associated with the winner’s curse, diffused ownership or above-average risk are consistent with the underpricing behavior of low-priced IPOs.
In addition to deriving their implications from the characteristics of investors who participate in an IPO, the above theories of IPO underpricing also have significant implications for trading in the immediate aftermath of the IPO. We turn to this question in the next section.
V. IPO Price and Initial Turnover
Thus far, we have shown that high-priced IPOs are associated with higher institutional investment. We have also shown that such IPOs display higher underpricing relative to
intermediate-28
priced IPOs. As noted by Benveniste and Wilhelm (1997), it is common knowledge that institutional investors are better informed and have significantly greater ability to obtain IPO allocations. Since our findings suggest that they are selective in picking IPOs, whether they proceed to flip or hold their IPO allocations is an interesting empirical question. The Benveniste and Spindt (1989) framework provides no a priori reason for them to hold their allocation beyond the first trading day, at which time they are fully rewarded for the information they provided during the pre-marketing phase of the IPO. On the other hand, if firms also target institutional investors for their monitoring services, as suggested by Stoughton and Zechner (1998), they may continue to hold their allocations for a longer term to reap continuing rewards from their monitoring activity. In the latter case, high-priced IPOs will exhibit relatively lower turnover in the aftermarket. On the other hand, low-priced IPOs that are sold primarily to retail investors may also trade less in the immediate aftermarket. These IPOs may be subject to higher transaction costs, since transactions cost is inversely related to price (e.g. McInish and Wood (1992)). Additionally, small investors may be less willing or able to trade after
the IPO.16 Hence, if investors buy both high-priced and low-priced IPOs with a longer investment
horizon than investors in intermediate-priced IPOs, we expect lower initial turnover in both low-priced and high-low-priced IPOs relative to intermediate-low-priced IPOs.
We use initial turnover (as a fraction of shares issued in the IPO) as the dependent variable and estimate its relationship with filing price (or offer price) in a regression framework. Since price and size are related, we include the log of market value as a control variable. Krigman, Shaw and Womack (1999) show that initial turnover is positively related to underpricing, hence we include
16 There is considerable anecdotal evidence that retail investors are more likely to hold their allocations and less likely to
move out of the stock as a group. This may be due in part to the fact that these investors seem to face many more restrictions against flipping than large investors.
29
underpricing as a control variable. They also show that block trades, presumably by large institutional investors, account for a large fraction of the initial turnover. If institutions trade more often than individuals, we expect a positive relationship between institutional ownership and initial turnover. The opposite would be true if institutions are more likely to be buy-and-hold investors. In addition, if there is positive information revealed in the pre-market, we could expect that the demand for these shares would be high. The high demand during the pre-marketing phase results in rationing the allocation of the IPO, and we expect that these IPOs will exhibit high turnover in the immediate aftermarket. Hence, we include the fractional revision in offer price as an additional control variable and expect it to be positively related to initial turnover.
We find a non-linear relationship between IPO price and turnover (Table V). When we include only the filing price and its square in Model 1 (or offer price and its square in Model 3), the coefficients on the price and the squared term are positive and negative respectively, and are significant at the one-percent level. When we include the control variables also (Models 2 and 4), underpricing, log of firm size and the fractional offer price revision are significantly positively related to initial turnover. Institutional ownership is not significantly related to initial turnover. Consistent with our expectations, the coefficients on filing price and square of filing price (offer price and its square) remain significantly positive and negative, respectively. In models 5 through 8, we repeat our analysis using the average turnover in the first week as the dependent variable instead of the initial turnover. The results are unchanged. Turnover, whether measured over the first day or the first week, is lower both for high-priced and for low-priced IPOs.
[Insert Table V about here]
30
to higher transactions costs associated with these stocks or due to the long-term investment horizon of investors in these stocks. It is more significant that high-priced IPOs also seem to trade relatively less. Our turnover results provide a basis for differentiating between the types of IPOs to which the Benveniste and Spindt (1989) and Stoughton and Zechner (1998) models of IPO underpricing apply. Institutional investors in intermediate-priced IPOs may be more inclined to cash out quickly, thereby locking in the rewards for their information. In contrast, investors in high-priced IPOs seem less inclined to do so, suggesting that they hold these stocks for a longer period to reap benefits both from the information they provide during the pre-IPO phase and from the monitoring services they provide during the post-IPO phase.
If institutional investors have superior stock-picking ability and are successful in reducing agency problems through their monitoring activities, the firms they invest in at the IPO stage (i.e. high-priced IPOs) should outperform their peers. Seguin and Smoller (1997) show that high- priced firms perform better in the aftermarket. In the following section, we analyze the link between IPO price and the likelihood of delisting due to financial distress.
VI. IPO Price and Delisting Due To Financial Distress
Ritter (1991) and Loughran and Ritter (1995) document that IPOs underperform in the three to five years following the offering. However, a recent paper by Brav and Gompers (1997) provides evidence that most of the under-performance is concentrated in the small, non-venture backed IPOs. Furthermore, Seguin and Smoller (1997) show that low-priced stocks are more likely to end up in financial distress. Our findings hitherto also suggest the possibility that there may be systematic differences in long-run performance between high-priced and low-priced IPOs. Additionally, Seguin
31
and Smoller (1997) and Carter, Dark and Singh (1998) show that IPOs marketed by more reputed underwriters perform better in the long run than those sold by less reputed underwriters. We investigate whether IPO price helps explain long-run performance after controlling for differences in firm size and underwriter reputation.
We analyze whether IPO filing price can help explain the likelihood that a firm would experience financial distress. As in Seguin and Smoller (1997), we consider a firm to be distressed if in the five years after the offering, it does not trade on the NYSE/AMEX/Nasdaq and has been delisted for reasons other than due to a merger or an exchange offer. We use as our dependent variable a dummy that takes the value ‘1’ if the firm is viable at the end of five years after the IPO and ‘0’ otherwise. In logistic regressions (Table VI), our main explanatory variable is the filing price or offer price. We use log of firm size and underwriter reputation as control variables. When we include only the filing price (Model 1) or offer price (Model 4), both are significant and positively related to firm viability. When we include the control variables in models 2 and 5, the coefficients on log of equity value and the average underwriter reputation are positive and significant. This is consistent with the findings in Seguin and Smoller (1997) and Carter, Dark and Singh (1998). When we include the IPO price in models 3 and 6, we find that IPO price (both filing and offer price) is significantly positively related to firm viability. High-priced IPOs are less likely to delist due to financial distress within five years after the IPO. The coefficients on firm size and underwriter reputation remain significantly positive. Since our sample firms include IPOs until 1998 for which we do not have five post-IPO years, we confirm these results using a subsample of firms from 1981-1993. In unreported regressions, the coefficients on filing and offer price remains positive and significant.
32
[Insert Table VI about here]
Thus, high-priced IPOs are less likely to be delisted for distress related reasons than low-priced IPOs. High-low-priced IPOs seem to be better firms, adding to the list of systematic differences between high-priced and low-priced IPOs that we have documented in this paper.
VII. Concluding Remarks
Our study makes several contributions to the literature. We ask whether IPO price levels are informative. We find that they are. We show that the price level in an IPO is related to other choices the firm makes, including the choice of underwriter and ownership structure. We find that the relationship between IPO price level and underpricing is U-shaped, that institutional ownership is greater at higher price levels, that higher-priced IPOs are underwritten by higher-reputation underwriters, and that post-IPO turnover is lower for high-priced IPOs than for mid-priced IPOs. These results suggest a possible differentiation between alternate theories of IPO underpricing. We also show that IPO price level is related to firm quality, at least when quality is (inversely) measured by mortality. We find that firms choosing a higher (lower) stock price, higher (lower) reputation underwriters, and a more (less) institutional investor base, experience lower (higher) mortality rates. Overall, our findings help to resolve an important question that has been pending in the stock splits literature, namely, whether the corporate decision that involves picking a share price level has economic significance. Our results provide strong evidence that it does.
Many questions remain. A key issue that arises from this research is whether firms and their underwriters pick the IPO price level as an explicit signal of the firm’s quality. If it is a signal of quality, our long-run results suggest that it is credible. However, as in the case of stock splits, it is
33
difficult to ascertain the mechanism that preserves incentive compatibility. In the model developed by Allen, Bernardo and Welch (2000), low-quality firms seek to avoid the attention of institutions, since the presence of institutions in their shareholder base make it more likely that a firm’s true quality will be revealed. The choice of a low offer price will deter institutional investment. However, as noted by Bushee (1998), high-quality firms may also seek to avoid institutional investors.
An alternate possibility is that the offer price is a manifestation of more basic economic measures of the firm. What we show is that high-priced IPOs are more underpriced and have lower turnover relative to intermediate-priced IPOs, and they have more institutional investment, higher-reputation underwriters and higher long-run performance relative to all other IPOs. There is no comprehensive economic theory linking these variables to stock price levels.
A third possibility is that there is an optimal price level at which a firm should go public, at least from the standpoint of the amount of money left on the table. While the stock splits literature has not been able to dispel the notion that the choice of one price level over another is merely a neutral mutation, our results demonstrate that the differences in the amount of money left on the table are both economically and statistically significant across different price levels.
Differentiating between these alternative possibilities is a subject for future research. So too is the question of why investors should care about stock price levels. The evidence from stock and mutual fund share splits indicates that some investors may have preferences with regard to share price levels. Our findings suggest that in IPOs, companies and their underwriters make explicit choices regarding price level, possibly by taking account of such investor preferences in addition to the firm’s fundamental characteristics. The price level seems to be a useful collective measure of these choices.
34
REFERENCES
Aggarwal, Reena, 2000. Stabilization activities by underwriters after initial public offerings, Journal of Finance 55, 1075-1103.
Allen, Franklin, Antonio E. Bernardo and Ivo Welch, 2000. A theory of dividends based on tax clienteles, Journal of Finance 55, 2499-2536.
Allen, Franklin, and Gerald R. Faulhaber, 1989. Signaling by underpricing in the IPO market, Journal of Financial Economics 23, 303-323.
Angel, James, 1997. Tick size, share prices and stock splits, Journal of Finance 52, 655-681. Asquith, Paul, Paul Healy and Krishna Palepu, 1989. Earnings and stock splits, Accounting
Review 64, 387-403.
Badrinath, S.G., Gerald D. Gay and Jayant R. Kale, 1989, Patterns of Institutional Investment, Prudence, and the Managerial “Safety-Net” Hypothesis, Journal of Risk and Insurance 56, 605-629.
Baker, H. Kent, and Patricia L. Gallagher, 1980, Management's view of stock splits, Financial Management 9, 73-77.
Baker, H. Kent, and Gary E. Powell, 1993, Further evidence on managerial motives for stock splits, Quarterly Journal of Business and Economics 32, 20-31.
Baron, David P., 1982, A model of the demand for investment banking advising and distribution services for new issues, Journal of Finance 37, 955-976.
Beatty, Randolph P., and Jay R. Ritter, 1986, Investment banking, reputation and the
underpricing of initial public offerings, Journal of Financial Economics 15, 213-232. Beatty, Randolph P., and Ivo Welch, 1996, Legal liability and issuer expenses in initial public
offerings, Journal of Law and Economics 39, 545-603.
Benveniste, Lawrence M., and Paul A. Spindt, 1989, How investment bankers determine the offer price and allocation of new issues, Journal of Financial Economics 24, 213-232. Benveniste, Lawrence M., and William J. Wilhelm, 1997, Initial public offerings: going by the
book, Journal of Applied Corporate Finance 10(1), 98-108.
Blowers, Stephen C., Peter H. Griffith and Thomas L. Milan, 1999, The Ernst & Young Guide to the IPO Value Journey, John Wiley & Sons, New York, NY.