Khan, W, Hussain, A, Alaskar, H, Baker, T, Ghali, F, Jumeily, D and
Al-Shamma’a, AI
Prediction of Flood Severity Level Via Processing IoT Sensor Data Using Data
Science Approach
http://researchonline.ljmu.ac.uk/id/eprint/12971/
Article
LJMU has developed LJMU Research Online for users to access the research output of the University more effectively. Copyright © and Moral Rights for the papers on this site are retained by the individual authors and/or other copyright owners. Users may download and/or print one copy of any article(s) in LJMU Research Online to facilitate their private study or for non-commercial research. You may not engage in further distribution of the material or use it for any profit-making activities or any commercial gain.
The version presented here may differ from the published version or from the version of the record. Please see the repository URL above for details on accessing the published version and note that access may require a subscription.
For more information please contact [email protected]
http://researchonline.ljmu.ac.uk/
Citation
(please note it is advisable to refer to the publisher’s version if you
intend to cite from this work)
Khan, W, Hussain, A, Alaskar, H, Baker, T, Ghali, F, Jumeily, D and
Al-Shamma’a, AI Prediction of Flood Severity Level Via Processing IoT Sensor
Data Using Data Science Approach. IEEE Internet of Things Magazine. ISSN
2576-3180 (Accepted)
XXX-X-XXXX-XXXX-X/XX/$XX.00 ©20XX IEEE
Prediction of Flood Severity Level Via Processing
IoT Sensor Data Using Data Science Approach
Wasiq Khan, Member, IEEE, Abir Jaafar Hussain, Member, IEEE, Haya Alaskar, Member, IEEE, Thar Baker1, Member, IEEE, Fawaz Ghali, Member, IEEE, Dhiya A-Jumeily, Senior member, IEEE, Ahmed Al-Shamma’a, Senior Member, IEEE
Abstract—The ‘riverine flooding’ is deemed a catastrophic phenomenon caused by extreme climate changes and other ecological factors (e.g., amount of sunlight), which are difficult to predict and monitor. However, the use of internet of things (IoT), various types of sensing including social sensing, 5G wireless communication and big data analysis have devised advanced tools for early prediction and management of distrust events. To this end, this paper amalgamates machine learning models and data analytics approaches along-with IoT sensor data to investigate attribute importance for the prediction of risk levels in flood. The paper presents three river levels: normal, medium and high-risk river levels for machine learning models. Performance is evaluated with varying configurations and evaluations setup including training and testing of support vector machine and random forest using principal components analysis-based dimension reduced dataset. In addition, we investigated the use of synthetic minority over-sampling technique to balance the class representations within dataset. As expected, the results indicated that a “balanced” representation of data samples achieved high accuracy (nearly 93%) when benchmarked with “imbalanced” data samples using random forest classifier 10-folds cross-validations.
Keywords—IoT sensor data, Extreme climate changes, River flow I. INTRODUCTION
River flooding incidents have been increased over recent years, due to the climate changes and other environmental factors. In fact, it reached a devastating effects level in the last couple of years (e.g., over 14.9 million people in 10 provinces were affected in China in 2017 China flood). Hence, floods have enormous impacts on human lives and their properties and the infrastructure of the surrounding buildings. While the prevention of such a catastrophic phenomenon is not possible, we envisage that the combinatorial use of machine learning, IoT sensor data, and data science approaches can help in the early prediction of flood river levels, and provide rescue services with a preliminary sign of time and locations of the flood for effective responses. Accurate prediction of river flooding is, in fact, a challenging research problem knowing that the river flood stage analysis is distinguished by temporal and spatial variations. River flow activity is nonlinear and influenced by various aspects such as riverbed terrain, the rainfall process, and climatic characteristics. Various predictive measures have been suggested for the prevention of the effects of floods [6-9].
There are two different approaches for the prediction of river flow. The first approach utilizes mathematical models to investigate water flow hydrodynamic. In this case, a large amount of input data (such as topography data and rainfall forecasts) is required for the prediction. Besides, the selection of the model parameters needs to be carefully interpreted and utilized due to the difficulty to adjust and estimate the values that fit with the model. These types of models do not perform
1 Corresponding author Dr Thar Baker, ([email protected]) is with the
Department of Computer Science, Liverpool John Moores University, Liverpool, L3 3AF, United Kingdom
well when data is restricted and due to the long processing time, they usually need to generate acceptable results for flood warnings [1].
The second approach is a data-driven for the prediction of river flow in which the statistical relationship between the outputs and their input are considered. Artificial Neural Network (ANN) models and machine learning algorithms are considered as common data-driven methodologies. ANN offers the ability to interpret the linearity and nonlinearity properties of the data and eliminate the need to provide any assumptions. As such, ANN provides appropriate tools for predicting stream flow [2]. There have been several studies about the detection of river flood using machine learning algorithms. For instance, Ganguly et al. [3] indicate that linear regression, in their cases, generates improved results compared to random forest and multilayer perceptron. Tehrany et al. [4] use two machine learning algorithms, namely Support Vector Machine (SVM) and Decision Tree for the analysis of spatial correlations between the level of importance for detecting flood areas and flood conditioning factors such as flow accumulation, elevation, and lithology. The authors utilize two datasets; the first dataset uses parameters such as curvature, altitude and stream power index; whilst the other one uses parameters such as geology, soil, distance from roads and distance from rivers. Other researchers have looked at flood risk maps using hydraulic and hydrological data by utilizing two machine learning algorithms, Unbiased Efficient Statistical Tree and Genetic Algorithm Rule-Set Production [5]. In their models, flood conditioning factors include various parameters such as curve number, precipitation, distance to river and slope. Their simulation results indicate that the genetic model generates a value of 93.5% for accuracy while the Unbiased Efficient Statistical Tree machine learning generates a value of 89.2% for accuracy.
Major contributions of this work include a) Proposing a data-driven approach to detect river levels severity using IoT sensor data; b) Utilizing the principal component analysis (PCA) to rank the most significant features based on corresponding loadings on the principal components; c)
investigating the imbalanced class representations within the dataset and use of synthetic minority over-sampling technique to balance the data distributions, and measure the corresponding impacts on the performances of SVM and random forest classifiers algorithms.
The reminder of this paper is organized as follows. Section II provides details about the proposed methodology. Section III addresses the hypothesis and evaluation setup. Simulation results and discussion are provided in Section IV, followed by Conclusion in Section V.
II. PROPOSED METHODOLOGY
Research problem in this study focuses the use of advanced analytics and machine learning algorithms to predict the flood severity levels. The proposed methodology entails a composite of data processing and machine learning techniques which are described in the following sections.
A. Data Description
The data used throughout this research work publicly available at [14]. It is collected by the Environment Agency Dartmouth Flood Observation over 31 years using 4214 data points. The data consists of various sensory information that is collected from many cities around the world. The data comprise 11 features representing duration in days, monsoonal rain, number of displaced, the number of dead, snowmelt and ice jams, centroid, magnitude, total annual flood, torrential rain, heavy rain, the affected area, and tropical storm. Three classes are used in this study including Class 1 (C1), Class 2 (C2) and Class 3 (C3) representing normal, abnormal and high-risk river water levels, respectively.
B. Data Pre-processing
The original dataset consists of missing values that are removed after the outlier elimination using interquartile ranges (IQR) of attributes. The cleaned dataset is then normalised using min-max normalisation technique. The cleaned data comprise 1943 samples. These samples consist of 1181, 306 and 456 samples for classes C1, C2 and C3, respectively. These numbers are clearly imbalanced and may lead to misclassification. To resolve this issue and get a balanced representation of data for each class, we use Synthetic Minority over-sampling technique [15], which synthesizes the new minority-class samples between the existing minority-class samples using the specified neighbours. The final dataset constitutes a fair representation of samples in each class with 892, 918 and 854 samples for C1, C2, and C3, respectively.
C. Principal Component Analysis & Attribute Importance
An investigation of the attribute importance is performed via PCA. The component loadings in the method represent the correlation coefficient between the variables in the dataset and components (obtained through PCA). The component rotations provide the maximized sum of variances of the squared loadings. The absolute sum of component rotations gives the degree of importance of the corresponding attributes in the dataset.
(A)
(B)
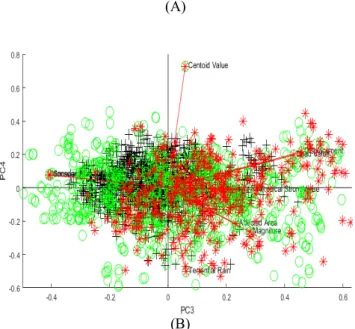
Fig. 1. Principal components, corresponding variance and impact on target classes; Class 1 is -+-, Class 2 is the green -o- and Class 3 is -*-.
Figure 1 (A and B) represents the principal components distributions with respect to target class, original attributes and corresponding impacts of the target classes. For instance, in Fig. 1.A, centroid value has a clear impact on C1 while affected area and magnitude influence C3. The first four PCs cover approximately 66% of the overall PCs variance. Also, Fig. 1 (A and B) clearly demonstrates the non-linearity of the problem based on PCs data distribution.
Fig. 2. Attribute importance based on PCs loadings
Figure 2 provides a clear sign of the importance of some attributes over the others within the original dataset. For instance, there is a clear difference in the measure of the dead value (high importance) and heavy rain value (low importance). Overall, the dead value and displacement and torrential rain values are identified with high importance while heavy rain, monsoonal rain, tropical storm, and snowmelt and ice jam values indicate low importance in the principal components’ variance distribution.
D. Classification Algorithms
We use two well-known machine learning algorithms: SVM and random forest to classify the river severity data. SVM was initially introduced by Vapnik and Cortes in 1995 [10]. It uses the separation hyperplane to allow the prediction process to assess whether an example is above or below the separation line. It has been successfully used for solving the complex regression and classification problems. There are numerous applications of the SVM within diverse domains including handwritten recognition, stock market analysis, weather prediction, and image processing [11], to name but a few. The technique aims to improve the accuracy of the hypothesis function based on four main concepts; separation of hyperplane, maximum margin hyperplane, soft margin creation and kernel function utilisation [12]. When the separation is not linear as in our case (see Fig. 1), the hyperplane is transformed into a higher dimensional hyperplane to separate the data. Furthermore, SVM allows the use of optimal line to the maximum margin using a Lagrange multiplier. The algorithm has the ability to create a soft margin which allows the data to be on the opposite side of the hyperplane without affecting the classifier accuracy. As mentioned earlier, flood data is not linearly separable for which SVM provides a kernel function that is used to separate the non-linear data points within higher dimension space. In addition to the SVM, we used the random forest which consists of a number of classifications and regression trees generated using randomly nominated subsets of predictor variables and training datasets to model the outputs in random forest setting. The algorithm utilises ensemble of decisions trees without pruning, and two randomization processes including bagging and random feature selection, which is needed for the flood severity data set due to its nonlinearly and multiclass problem. Those two processes allow the model to be more accurate and resistant to the overfitting problem [13] that will be useful for the reliable decision of flood severity prediction.
III. PERFORMANCE EVALUATION DESIGN
Multiple evaluations are designed for the performance measure of the proposed approach, based on various parametric configurations and tuning, datasets and selected attributes. The SVM and random forest classifiers are trained and tested on:
A) PCA based dimension reduced dataset (principal components covering 90% of variance distribution) B) Selected attributes in based on attribute importance
measured through PCA
C) Original dataset (with imbalanced class representation) versus synthetic minority over-sampling technique based balanced dataset
A and B are used to test the following hypothesis:
HAB_0: There is no significant difference between the
classification accuracy from classifiers when trained-over entire feature-space VS reduced dimensions based on PCA.
HAB_1: There is a significant difference between the
classification accuracy from classifiers when trained-over entire feature-space VS reduced dimensions based on PCA.
Whilst, A to C are used to test the following hypothesis:
HC_0: There is no significant difference between the
performance of classifiers trained-over imbalanced vs balanced representations for each target class
HC_1: There is a significant difference between the
performance of classifiers trained-over imbalanced vs balanced representations for each target class.
To set the baseline for (A-C), number of classification trials were conducted to compare the classifiers’ (SVM, random forest) performance to select the parametric configurations and model tuning including type of kernel (e.g., radial, polynomial), cost, number of neurons in each layer, batch size, and time stamp. Standard 10-fold cross validation train/test trials were run by partitioning the entire dataset into training and testing proportions of 70% and 30%, respectively. It was ensured that the test data contains fair distribution for all classes. Following the baseline results, the classifiers’ parameters were set imperially to get the optimistic performance. For (A-C), several statistical metrics (i.e., sensitivity, specificity, accuracy, positive prediction rate, negative prediction rate) are used to evaluate the performance of classification algorithms. Algorithm 1 shows the proposed approach for prediction of flood severity levels using IoT sensor river-data and advanced data analytics algorithms.
ALGORITHM 1:PROPOSED ALGORITHM FOR FLOOD SEVERITY LEVEL
CLASSIFICATION AND PERFORMANCE EVALUATION
Inputs:
Sensor flood dataset FD with set of p* attributes
p* =
{
Monsoonal Rain, Duration in day, Number of Dead, Numberof Displaced, Snowmelt and Ice Jams, Magnitude, Centroid, Total annual flood, Heavy Rain, Torrential Rain, Total of Affected area,
Tropical Storm
}
Output:
Flood severity level classification for 3 classes C: {C1: Normal, C2:
Abnormal, C3: Dangerous}
Procedure:
Step 1: Apply data cleansing and standardisation
Step 2: Use synthetic minority over-sampling technique to balance C1, C2 and C3 samples in FD
Step 3 (Attribute Importance): Measure PCA based attribute significance:
-Use the PCA algorithm to transform the FD into orthogonal principal components (PCs)
-Let v = 0 representing the overall percentage of variance within the PCs and vPC = [] (initially set as empty) to store the PCs identified as important.
Foreach PC:
IF v< 95:
Store current PC into a vector vPC v = v + variance of current PC; End Loop
-Rank the attributes within the FD based on absolute sum of loadings for all vPC
-Store the top-ranked attributes p to be used for the classification where p ⊆p*
Step 4 (Model Evaluation): Let 𝑴𝑳 = {𝑺𝑽𝑴, 𝑹𝑭} is set of classifiers {Section II (D)} used to classify C1, C2 and C3. Training/Validation/Testing of the ML is performed recursively using following steps.
i. Set Training Data for all pwithin FD to be 60% of overall dataset
ii. Set Validation Data for all pwithin FD to be 20%
of overall dataset
iii. Set Test Data for all pwithin FD to be 20% of
overall dataset
iv. Initialize a classifier from ML following the corresponding configurations
v. Train classifier until it converges
vi. Store the output 𝑶 from each classifier in ML as [Confusion matrix, Classification] = Repeat Steps i-vi s.t in each iteration (1: 10), Test Data belongs to unseen samples for selected attributes from the FD.
IV. RESULTS AND DISCUSSION
Table 1 summarizes the statistical results achieved for experiments (A and B) using 10-fold cross-validation where two classifiers including SVM and random forest are trained and tested over balanced proportions of data samples for each class. Multiple experiments are conducted based on (a) full list of attributes (11 in total), (b) first 8 principal components covering over 95% of the variance in the data, and (c) only important attributes (7 in total, as illustrated in Fig. 2).
TABLE 1:CLASSIFIERS PERFORMANCES COMPARISON BASED ON BALANCED
DATASET USING SMOT USING 10-FOLD CV
Classifier Class Sensitivity Specificity Accuracy FScore Overall Accuracy Al l a tt rib ut es (1 1) SVM C1 0.93 0.92 0.92 0.93 0.91 C2 0.89 0.95 0.92 0.86 C3 0.82 0.96 0.89 0.84 Random Forest C1 0.90 0.94 0.93 0.93 0.92 C2 0.91 0.94 0.92 0.85 C3 0.84 0.96 0.90 0.84 1 st 7 Im po rt an t at tr ib ut es SVM CC12 0.78 0.75 0.89 0.89 0.83 0.82 0.85 0.68 0.81 C3 0.71 0.87 0.79 0.55 Random Forest C1 0.88 0.97 0.93 0.92 0.93 C2 0.93 0.93 0.93 0.83 C3 0.88 0.95 0.92 0.85 Pr in ci pa l Co m po ne nts (1 st 8 PC s) SVM C1 0.89 0.92 0.90 0.91 0.89 C2 0.87 0.94 0.90 0.83 C3 0.81 0.94 0.88 0.80 Random Forest C1 0.94 0.88 0.91 0.92 0.88 C2 0.61 0.96 0.79 0.73 C3 0.98 0.91 0.94 0.76
Both classifiers performed almost similar in terms of the overall classification accuracy (~92%) with the balanced representation of data while using all attributes. In case of the SVM algorithm, the accuracy is reduced to 81% with the 7 important attributes identified in Fig 2. T-test outcomes with p-value of 0.0003 with t-score=5.1 at a confidence interval of 0.05, reject the null hypothesis HAB 0 which indicates that there
is a significant difference between the accuracy means in two cases. On the other hand, random forest classifier performed optimistic with the reduced dimensions of data (i.e. only 7 attributes) with the overall accuracy of 93% which indicate a clear validation of PCA based attribute importance. The p-value and t-score of 0.08 and -1.96, respectively indicate the acceptation of null hypothesis HAB 0 in this case. This means
there is no significant difference of random forest
performance while using entire attribute-space compared to only essential attributes. Likewise, the overall accuracy for both classifiers with PCs (1st 8 in our case) is almost similar to a mean difference of 3% in the overall accuracy.
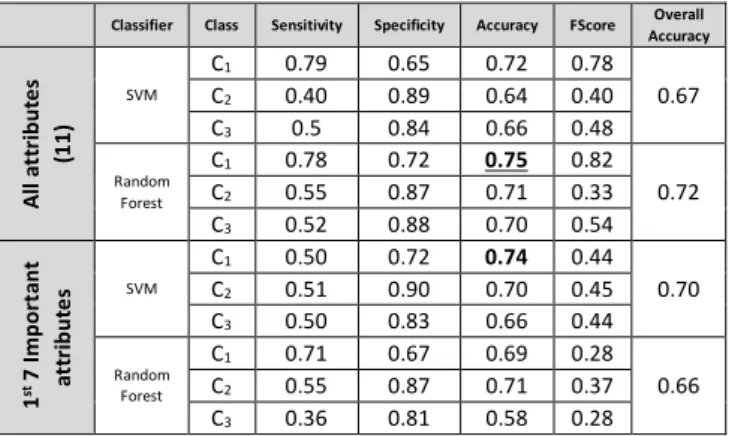
TABLE 2: CLASSIFIERS PERFORMANCES COMPARISON BASED ON
IMBALANCED ORIGINAL DATASET
Classifier Class Sensitivity Specificity Accuracy FScore Overall Accuracy Al l a tt rib ut es (1 1) SVM C1 0.79 0.65 0.72 0.78 0.67 C2 0.40 0.89 0.64 0.40 C3 0.5 0.84 0.66 0.48 Random Forest C1 0.78 0.72 0.75 0.82 0.72 C2 0.55 0.87 0.71 0.33 C3 0.52 0.88 0.70 0.54 1 st 7 Im po rt an t at tr ib ut es SVM C1 0.50 0.72 0.74 0.44 0.70 C2 0.51 0.90 0.70 0.45 C3 0.50 0.83 0.66 0.44 Random Forest C1 0.71 0.67 0.69 0.28 0.66 C2 0.55 0.87 0.71 0.37 C3 0.36 0.81 0.58 0.28
To investigate the hypothesis HC 0, experiment C is
conducted to compare the classifiers performance with the outcomes from experiments A and B. Table 2 demonstrates the statistical outcomes of both classifiers while using original imbalanced dataset. Additional experiments are performed to investigate the difference between using full attributes versus only important attributes mentioned earlier. It can be observed that the performance of both classifiers in all cases is significantly dropped. To measure the significance of the performance difference for using balanced and imbalanced datasets, statistical test is used at the confidence interval of 0.05. In case of SVM, p-value of 1.8e-8 and t-score 15.01 give a clear indication of rejecting the null hypothesis. Similarly, for random forest, the test produced p-value<2.2e-16 and a t-score 62.61 which also reject the HC_0.
This means that balancing the data representations for each class significantly improved the classification algorithm performances.
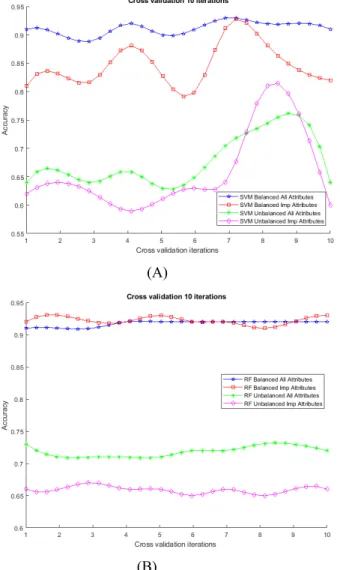
Fig. 3 (A and B) shows the performance comparison for both classification algorithms in terms of overall accuracy for three classes while trained over various combinations of attributes using 10-fold cross validation and tested over the corresponding unseen datasets. It can be observed that the balanced representation of data samples achieved high accuracy in all cases as compared to that of imbalanced data samples. Furthermore, the optimistic performance is achieved by random forest throughout the 10-folds (with approximately 93% accuracy) while using the selected important attributes which indicates the reliability of PCA based attribute importance measurement and feature selection presented in Fig. 2. Even with the imbalanced dataset, the selected attributes outperformed specifically in case of SVM classifier. Also, the p-values and t-scores mentioned earlier indicate the inter and intra relationships between the performance of the classifiers with balanced and imbalanced proportion of the dataset. These statistics and visual results signify the difference between the performance of classifiers is significantly less in case of balanced dataset when compared to that of imbalanced dataset outcomes. For instance, the t-score for SVM using balanced dataset (all attributes) and SVM using balanced dataset (only 7 important attribute) is
only 5.1; which is on the other hand, significantly high with a value of 15 when calculated for imbalanced data distributions.
(A)
(B)
Fig. 3. Comparison of Random Forest (RF) and SVM performance using balanaced & imbalanced datasets, full attributes & important attributes
V. CONCLUSION AND FUTURE WORK
Table 1 summarizes the statistical results achieved for experiments (A and B) using 10-fold cross-validation where two classifiers including SVM and random forest are trained and tested over balanced proportions of data samples for each class. Multiple experiments are conducted based on (a) full list of attributes (11 in total), (b) first 8 principal components covering over 95% of the variance in the data, and (c) only important attributes (7 in total, as illustrated in Fig. 2). This paper presents a data science approach for the classification of IoT sensor river data. Three sets of experiments were conducted in this study to investigate the classification accuracy of the SVM and random forest classifiers. In the first set of experiments, PCA based dimension reduced dataset was utilised for training, testing, and validation. Whereas in the second set of experiments, selected attributes based on attribute importance measured through PCA were fed to the classification algorithms. In the final set of experiments, the original dataset (with imbalanced class representation) versus
Synthetic Minority over-sampling Technique based balanced dataset was used for the classification purpose. Our analysis indicated that balanced representation of data samples achieved significantly high accuracy in all cases when benchmarked with imbalanced data samples. The random forest achieved a high accuracy of 93% using 10-folds cross-validations utilising important attributes values. This clearly indicates that PCA based attribute importance measurement and feature selection along with machine learning and data science algorithms can provide a powerful tool for the prediction and classification of the flood severity levels. Future direction will involve the use of hybrid techniques incorporating expert decision model into our developed data analytics techniques to provide another solution for our complex decision and analytic problem, in which expert judgements and opinion will be incorporated as inputs to our technique.
REFERENCES
[1] K.C. Thirumalaiah, M. Deo, “Hydrological forecasting using neural networks.”, Journal of Hydrologic Engineering, Vol. 5, 2000, pp. 180– 189.
[2] Ö.. I.Kis, “A combined generalized regression neural network wavelet model for monthly stream flow prediction.” KSCE J. Civ. Eng., Vol. 15, 2011, pp. 1469–1479.
[3] K. K. Ganguly, N. Nahar, M. B. Hossain, “A machine learning-based prediction and analysis of flood affected households: A case study of floods in Bangladesh”, International Journal of Disaster Risk Reduction, Vo. 34, 2019, pp. 283-294.
[4] M. S. Tehrany, S. Jones, F. Shabani, “Identifying the essential flood conditioning factors for flood prone area mapping using machine learning techniques”, Catena, Vol. 175, 2019, pp. 174-192.
[5] H. Darabi, B. Choubin, O. Rahmati, A. T. Haghighi, B. Pradhan, B. Klove, “Urban flood risk mapping using the GARP and QUEST models: A comparative study of machine learning techniques”, Journal of Hydrology, Vol. 569, 2019, pp. 142-154.
[6] Z. Zheng, T. Wang, J. Weng, S. Mumtaz, A. K. Bashir, C. S. Hussain, “Differentially Private High-Dimensional Data Publication in Internet of Things”, IEEE Internet of Things Journal, 2019.
[7] A.N. Alvi; S. Khan; M.A. Javed; A. O. Almagrabi; K. Konstantin; A. K. Bashir; R. Nawaz. OGMAD (2019) Optimal GTS-allocation mechanism for adaptive data requirements in IEEE 802.15.4 based Internet of Things. IEEE Access, 2019
[8] C.S. Hussain, A. Hassan, M.A. Alqarni, A. Alamri, A.K. Bashir. A Twofold Sink-based Data Collection in Wireless Sensor Network for Sustainable Cities. Sustainable Cities and Society, Elsevier. 2019. [9] N. M. F. Qureshi, I. F. Siddiqui, M. A. Unar, M. A. Uqaili, C.S. Nam,
D. R. Shin, J.H. Kim, A. Abbas, A. K. Bashir. An Aggregate Map Reduce Data Block Placement Strategy for Wireless IoT Edge Nodes in Smart Grid. Wireless Personal Communication, Springer, 2018. [10] C. Cortes, V. Vapnik, “Support Vector Metworks”, Machine Learning,
Vol.20, No.3, 1995, pp. 273-297.
[11] R.G. Brereton, G.R. Lloyd “Support vector machines for classification and regression” Analyst, Vol. 135, No. 2, 2010, pp. 230-267. [12] W.S. Noble, “What is a support vector machine?”, Nature
Biotechnology, Vol, 24, No. 12, 2006, pp. 1565-1568
[13] L. Breiman L, “Random forests”, Machine Learning, vol. 45, No.1, 2001, pp. 5-32.
[14] Public tableau, "Flood Data and resources" [Online]. Available at: https://public.tableau.com/s/sites/default/files/media/Resources/Flood dataMasterListrev.xlsx. [Accessed: 2-Dec-2019].
[15] V. N. Chawla, K. W. Bowyer, L. O. Hall, W. P. Kegelmeyer, “SMOTE: synthetic minority over-sampling technique,” Journal of artificial intelligence research, Vol. 16, 2002, pp. 321-3
BIOGRAPHIES
Wasiq Khan is a Senior Researcher in Data Sciences within the Computer Science Department at Liverpool John Moores University, UK. Wasiq received his Ph.D. (Bradford University, UK) in Speech Processing & Intelligent Reasoning. Wasiq is research active within the domain of Data Science & Machine/Deep learning. Wasiq has been leading various Large-Scale research projects and has established academic citizenship within his research domain along with Fellowship of Higher Education Academy, UK.
Abir Hussain is a professor of Machine Learning and a member of the Applied Computing Research Group at the Faculty of Engineering and Technology. She completed her PhD study at The University of Manchester, UK in 2000. She has published numerous referred research papers in conferences and Journal in the research areas including Neural Networks, and Telecommunication Fraud Detection. She has worked with recurrent neural networks and deep learning and their applications to e-health, and image compression.
Haya Alaskar is an assistant professor in the College of Computer Science and Engineering at prince Sattam Bin Abdulaziz University, Saudi Arabia. Haya gained her PhD in computer Science from Liverpool John Moores University in 2014. She also gained an MSc in Applied Artificial Intelligence from the University of Exeter in 2009. Haya’s research interests include Artificial intelligence applications, data Science. She has numbers of publications concentrate on using machine learning in various medical data such as signals or images.
Thar Baker is a Reader in Cloud Engineering and Head of Applied Computing Research Group (ACRG) in the Department of Computer Science at Liverpool John Moores University. He received his PhD in Autonomic Cloud Applications from LJMU in 2010, and became a Senior Fellow in Higher Education Academy (SFHEA) in 2018. He has published numerous refereed research papers in multidisciplinary research areas including: Cloud Computing, Distributed Software Systems, Big Data, and Autonomic Web Science.
Fawaz Ghali is a senior lecturer in the department of computer science at Liverpool John Moores University. His research interests focus on bioinformatics, proteomics and match leaning. He published over 30 peer reviewed articles in the last ten years with Google Scholar profile of 13.
Dhiya Al-Jumeily is a professor of Artificial Intelligence and a Senior Member of IEEE. He has extensive research interests covering a wide variety of interdisciplinary perspectives concerning the theory and practice of Applied Artificial Intelligence in medicine, human biology, and health care. He has published well over 250 peer reviewed scientific international publications, 10 books and 7 book chapters, in multidisciplinary research areas.
Ahmed Al-Shamma’a is a full-Professor and Dean - College of Engineering, University of Sharjah. He obtained his PhD degree from the University of Liverpool in 1993. He was the Executive Dean (Teaching, Research and Enterprise) at Liverpool John Moores University, UK for 5 years before joining the University of Sharjah in Nov 2019. His main areas of expertise are, Non-invasive sensing for industrial applications, Microwave devices, Industry 4.0 complete system integration and Telecommunications.