INTRODUCTION
The impact strength tests are conducted in or-der to investigate the influence of the load speed and deformation on the mechanical properties of construction materials [1÷7] or joints [8÷10]. The construction materials which are impact loaded, usually demonstrate different mechanical charac -teristics compared to those which are calculated in static tests. The speeds of the deformation of 10 ≤ ἐ ≥ 103 s-1 are regarded as average defor
-mation speeds which are characteristic, among others, of vehicles in collision [11]. The proper -ties of materials at such deformation speeds are typically studied by means of different types of hammers: dropping or pendulum [12, 13]. In the examinations of mechanical properties of metals, the commonly used testing method is the bend test conducted in accordance with the EN ISO 148-1:2010 standard. Due to the difficulties in the
measurement of stresses and deformations, the result of the experiment comes down to an evalu -ation of the destruction energy of a standardized specimen. Impact strength U is the ratio of work Lu necessary to fracture the specimen to its cross-section A0 at the place of the notch.
(1) The definition of impact strength, described by equation (1), is not specified by physics and does not allow a comparison of the results ob -tained in impact strength tests, in which speci -mens with different di-mensions or other notch shapes have been used. The investigation of the impact strength of adhesive joints also indicates that the impact strength, described by equation (1), significantly depends on the used test ma -chine. Thus, a significant part of the measured energy is the energy of elastic strain of the test machine of which the researchers carrying out
Volume 13, Issue 4, December 2019, pages 214–222 https://doi.org/10.12913/22998624/113051
An Energy Analysis of Impact Strength Tests Using Pendulum
Hammers
Jan Godzimirski
1, Zenon Komorek
2, Andrzej Komorek
3*1 Department of Mechatronics and Aviation, Military University of Technology, Warszawa, Poland
2 Department of Advanced Materials and Technology, Military University of Technology, Warszawa, Poland 3 Department of Aviation, Polish Air Force University, Deblin, Poland
* Corresponding author’s e-mail: [email protected]
ABSTRACT
An attempt to estimate the value of the deformation energy of a metal specimen and the research system during im -pact strength tests on pendulum hammers was made. In the experimental research it was found that the rectangular metal specimens of the same cross-sectional area exhibit different impact strength, depending on the direction of the load (bending stiffness) whereas the destruction work of such samples exposed to static bending is comparable. The article presents the results of the experimental research, completed with numerical calculations carried out to assess the value of the deformation energy during the impact tests. By performing numerical calculations, the authors estimated the deformation energies of specimens characterised by elastoplastic properties with reinforce -ment (bilinear) under destructive loads. The energy of the elastic deformation of the hammer arm was estimated analytically. On the basis of the research, it was found that in the impact strength test, a large part of the recorded energy is connected with the deformation of the test device, in particular, the pendulum which undergoes bending. Moreover, the recorded impact strength of the material is not proportional to its actual impact strength.
Keywords: impact strength test, pendulum hammer, deformation energy.
Research Journal
Accepted: 2019.11.15the impact tests are often unaware. The studies on the influence of the testing device and its founda -tion on the recorded results are rarely conducted [14, 15]. The authors conducted experimental and numerical calculations in order to estimate which part of the measured energy of impact strength concerns the destruction of the sample. The pur -pose of the presented article is to show the exis -tence of the problem with the interpretation of the impact tests results for the persons who will carry out such tests.
INITIAL NUMERICAL ANALYSES
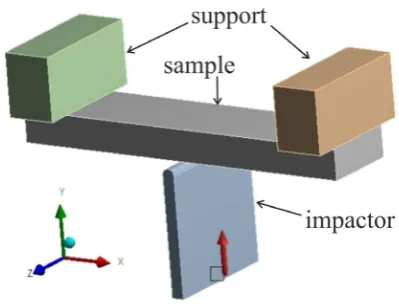
The numerical calculations were performed in the Ansys 14 system, using the Static Struc -tural module in order to estimate the deformation energy of rectangular specimens, made of an alu -minum alloy, sized 12.5x5x55, in which the load bending is equal to the one which occurs in an impact strength test. Explicit Dynamics module of Ansys 14 does not compute the deformation energy. The model of specimen loading in a dy -namic bending test is shown in Figure 1. Friction was declared between the support and the speci -men (coefficient of friction f = 0.1). A cylindri -cal edge of a steel loaded element was connected with the bended specimen by bonded contact. The declared mesh sizing was 0.9 mm.
The backs of supports were taken to all de -grees of freedom. The bending specimen was pre -vented from moving in the direction of the Z axis, and the loading element in the Z and X directions.
The specimen material was declared as elastoplastic with reinforcement (bilinear). As -suming that the test material will be duralumin AW2117T3 and knowing its mechanical proper
-ties (R0.2 = 240 MPa, Rm = 420 MPa and A10
= 15%) [16], the authors adopted the Young’s modulus E = 72 GPa, the yield strength R0.2 =
240 MPa and the reinforcement modulus D = 1,200MPa. In order to estimate the force values, at which the analyzed specimens should be de -stroyed while bending, they were loaded incre -mentally up to the values which cause the maxi -mum principal stresses of approximately 400 MPa, being close to ultimate strength and such strengths where the programme might be able to perform calculations. The models of the speci
-Fig. 1. Model of specimen loading in the analysed test
Fig. 2. Normal stresses in the bended specimen whose configuration equals 12.5x5 loaded with a
force of 7.7 kN
Fig. 3. Dependence of maximum normal positive stresses upon the load of the bended specimen of
larger bending stiffness (12.5x5)
Fig. 4. Normal stresses in the bended specimen whose configuration equals 5.12x5 loaded with a
mens were loaded in two configurations: along the side of 12.5 mm and of 5 mm (Figures 2-5).
The calculation of energy deformation of the examined samples was conducted for the loads below 7,700 N, for a sample of greater stiffness and for 3,100 N for a sample of lesser stiffness, i.e. for such loads at which the static strength is exceeded in the material. The deformation energy of consecutive elements (Fig. 6) was measured and added. This enabled to estimate the deforma -tion energy of the specimen with increased bend -ing stiffness at approximately 16 J and for a sam -ple with lower stiffness – at approximately 9.5 J.
Calculations showed that the impact strength of the tested samples should differ significantly depend -ing on the direction of their load-ing with the impac -tor due to the different value of strain energy at maxi -mum stresses equal to the strength of the material.
EXPERIMENTAL RESEARCH
Specimens for impact strength tests, 12.5 mm wide and 55 mm long, were cut out with a waterjet method from the available 5 mm thick aluminum
alloy sheet, along with 3 dog-bone specimens with dimensions consistent with the EN ISO 69892-1: 2010 standard. The tensile test was conducted for the identification of the examined material. Exper -imental tests were conducted on the Instron 8501 testing machine with a load range up to 100 kN using the Instron 2620-601 dynamic extensometer with a measuring range of 5 mm. The tests were carried out in accordance with EN ISO 6892-1: 2010 with method B. The traverse speed was 2 mm/min, which corresponds to the deformation rate 0.007 1/s for the measuring section lo = 50
mm. In the static tensile test, the authors obtained the results as below (Table 1).
The conducted experiment shows that the ex -amined material is the AW 2024T3 aluminum al -loy, and thus, it has greater strength than the one assumed in numerical calculations.
The impact strength tests of specimens, sized 12.5x5x55 mm, were carried out using the Charpy method in accordance with the EN ISO 148-1:2010 standard. The Wolpert-Wilson PW 30 pen -dulum hammer was used in the tests. The energy of the hammer’s pendulum was equal to 300 J at a velocity of 5 m/s. It was possible to specify the destruction energy of six samples, three of which were examined in the configuration settings with the long side towards the pendulum impact, and three with a shorter side setting. The destruction energy of the samples examined in such manner differed considerably (Table 2) but the ratio of re -corded energies did not correlate with the results of numerical calculations of strain energy.
In addition, the static three-bending tests of specimens with a configuration of 5x12.5 mm and 12.5x5 mm (beam supported on both sides and
Fig. 5. The dependence of the maximum normal stresses upon the load of the bended specimen of
lower bending stiffness (5x12.5)
Fig. 6. The distribution of the deformation energy in the components of the specimen with a configuration
of 12.5x5, loaded with a force of 7.7 kN
Table 1. Results of static tensile tests
Sample No. 1 2 3 Mean value
σ02 [MPa] 327 330 325 327.3
Rm [MPa] 453 453 443 449.7
A [%] 20 23 18 20.3
E [GPa] 70.7 75.7 72.9 73.1
Table 2. Recorded destruction energies of samples
Configuration 12.5x5 5x12.5
Recorded energy [J]
128.6 192 220
52.8 40 43
centrally loaded with force), were carried out with the support distance of 40 mm (Fig. 7), which is the same as in the case of the impact strength tests.
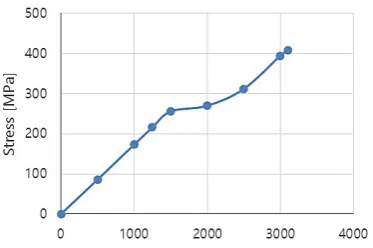
The dependence between strain and loading was achieved (Fig. 8 and 9). Integrating the sur -face area under the obtained curves allowed as -sessing the work of the loading force while bend -ing specimens for approximately 40 J, regardless of the loading direction, which means that these works do not correlate with the impact destruc -tion energies and are smaller than the energies recorded in the impact tests.
NUMERICAL ANALYSIS
Numerical calculations, similar to the pre -liminary ones, are taking into consideration the properties of the AW 2024T3 material. Knowing the experimentally designated deformation of material A = 20%, it was possible to calculate the true strain:
(2) Knowing the value of true strains, the au -thors computed the ultimate strength of alloy AW 2024T3:
Rmrz = Rm(1+εrz) = 453(1+0.167) = 528.6 MPa(3)
In order to calculate the reinforcement modu -lus from the actual ultimate strength, the authors deduced the yield strength; the obtained differ -ence was divided by true strain:
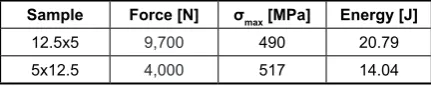
(4) Having declared the calculated material con -stants, computations were performed to deter -mine the force values in which, in impact tested specimens, stress values close to true failure stress of material will be reached and next the material deformation energy was calculated un -der such loads (Table 3).
The calculated energies were larger than the ones for the AW 2017T3 material and consider -ably smaller from the registered ones in impact strength experimental research.
The value of the critical strain energy release rate (toughness) of aluminum alloys is within 8-30 kJ/m2, depending on their resistance [17].
High-strength alloys, as in the case of the WA 2024T3 alloy, are characterised by decreased toughness. Taking into account the size of the cross-sectional area of the examined samples A0= 6.25∙10-5m2,
the energy required to propagate the crack along the whole cross section, does not exceed 2 J. Therefore, it appears that a large portion of the energy measured in impact strength tests is trans -formed into elastic energy and heat of the research system; also in the deformations occurring at im -pact strength test speeds, a slight increase in the material yield strength is likely to take place.
Fig. 7. Diagrams of static bending tests: a) test of 5x12.5 sample; b) test of a 12.5x5 sample
Fig. 8. Load-strain curve obtained in a bending test of a specimen whose configuration equals 5x12.5 mm
Fig. 9. Load-strain curve obtained in a bending test of a specimen whose configuration equals 12.5x5 mm
Table 3. Force, maximum stresses and deformation energy of the bended specimens
Sample Force [N] σmax [MPa] Energy [J]
12.5x5 9,700 490 20.79
Elastic energy of the bended pendulum arm
It was assumed that bending the pendulum arm with force which causes the destruction of the specimen can absorb a significant part of the energy recorded during the impact tests.
The performed dynamic calculations dem -onstrate that the stresses in the pendulum arm
change over time and prove that the wave phe -nomena occur. The pendulum model and stress maps are shown in Figures 10-13.
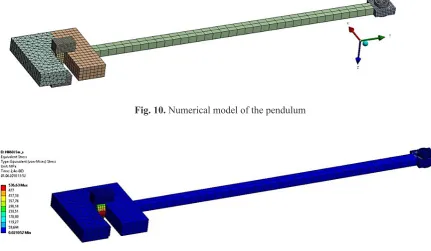
The dynamic numerical calculations were performed in the Ansys 16.2 system, using the Explicit Dynamics module in order to estimate the load of the pendulum arm during the dynamic bending of a cuboid aluminum alloy specimen.
Fig. 10. Numerical model of the pendulum
Fig. 11. Stresses for 60 J energy and 5 m/s velocity (close to the duralumin specimen strength)
Fig. 12. Distribution of stresses in the pendulum arm for 60 J energy and 5 m/s velocity in 2.4∙10-3s
The stress distributions were analyzed because the strain energy calculation is not possible in this module. The possibility of frictionless rotation of the pendulum on the pin was assumed (Fig. 10). The elements of the pendulum were given linear-elastic properties of steel, and the density of the beater material was declared so that at the pen -dulum’s velocity 5 m/s, its energy equalled 60 J.
For the load time of 2.4∙10-3 s the stresses in
the specimen were close to the strength of the sample material (Fig. 11). The distribution of Von Mises stresses in the pendulum arm for the same load time is depicted in Fig. 12. The change in the value and distribution of stresses in the pendulum arm for the time 5.4∙10-3 s (Fig. 13) shows the oc
-currence of wave phenomena during the dynamic investigations carried out with declared speeds.
It is possible to find an analytical dependence which specifies the energy of elastic deformation of the pendulum in the function of its dimensions, shape and load if the pendulum is regarded as a beam fixed on one side and loaded with focused force (such an assumption is a large simplification since a relevant analysis would require an inclu -sion of the pendulum inertia forces). The maxi -mum stresses in a beam with a rectangular cross section, impact loaded to bending, are described by the following equation:
(5) where: Mg – bending moment, W – bending
strength indicator, F – force, x – distance of the considered cross-section to the force, b – width of the pendulum arm cross-section, h – height of the pendulum cross-section arm.
The unit energy of elastic deformation of the material is a function of stresses and Young’s modulus:
(6) where: E – Young’s modulus.
The stresses in the bent beam section change linearly and their value is, inter alia, a function of the distance y from the centroidal axis:
(7)
thus:
(8) In order to calculate the mean value of the square of the stresses in any cross-section, it is necessary to integrate the function described by relationship (8) after y in the range from 0 to h/2, and then divide it by the interval of integration:
(9)
(10) Taking into account the dependencies (6, 7, and 10), we obtain:
(11) In order to calculate the total deformation energy, it is necessary to integrate the unit en -ergy with regard to the rod volume, assuming that dV = (b x h)dx:
(12) where: l – length of the pendulum.
Dependence (12) shows that the pendulum elastic energy relies on the square of the force de -stroying the examined specimen and on the pen -dulum geometry.
By a similar methodology, the authors deter -mined a dependence enabling an assessment of the pendulum deformation energy with a circular cross-section:
(13) where: r radius of the rod
and for the tube:
(14) where: r is the outer surface of the tube, and r0 is
the radius of the hole.
The deformation energy of the tube-shaped pendulum, with a diameter of 56 mm, wall thick -ness of 3 mm and a length of 650 mm calculated for load F = 9,700 N, is equal to 121 J and for the force of 4,000 N – 20.6 J; these energies have high -er values than the deformation en-ergy of the exam -ined specimens. The sums of the deformation
ener-Table 4. Energy analysis of the impact test
Sample Recorded energy [J] Sample energy [J] Pendulum energy [J] Energy of damage [J] - Total energy [J] Erec/Etot
12.5x5 180.2 20.8 121.0 2.0 143.8 1.25
gies of the test specimens (for load causing tension close to the ultimate strength of the examined ma -terial), the deformation energy of the tube-shaped pendulum and the fracture energy were compared with the recorded energy, as listed in Table 4.
The sums of the computed destruction ener -gies of the specimens and the deformations of the pendulum proved to be smaller than the energy recorded during the examination. On the basis of the numerical calculations, it is evident that the energies of elastic deformations of the reinforce -ment and the impactor are so insignificant that they may be disregarded. Thus, the cause of the differences between the recorded and calculated energy might be an increase in the strength of the examined material under dynamic load as well as heat generation due to friction.
THE SPEED OF DEFORMATION OF THE
TEST SPECIMENS
In order to assess the speed of the material deformation in the course of the examination of impact strength, the authors conducted the calcu -lations which take into account the conditions of the experiment. The investigated specimen was treated as a beam, supported on both sides, and loaded with a centrally focused force. The deflec -tion of such a beam f is described as follows:
(15) After the transformation taking into account the moment of inertia of the rectangular cross section, there is:
(16) For the impact load model in question:
(17) maximum stresses are the quotient of the bending moment and the flexural strength factor:
(18) and the maximum deformation is described by the dependency:
(19) In order to calculate the speeds of the defor -mation, it is necessary to divide them by the time after which there will be a deflection of the sample valued f:
(20)
where V is the speed of the pendulum.
In experimental studies, the impact speed of the pendulum equalled 5 m/s, which allows estimating that the speed of the deformation of a stiffer sample was approximately 234 s-1, and
in the case of smaller stiffness, it was equal to 94 s-1. These are the speeds of deformation cat
-egorised as the medium-sized [11], for which the impact of inertia forces on the mechanical properties of metals is relevant. In relation to [18], in such a range of the deformation rate (up to 103 s-1), there is an increase in the value of
the plastic flow stress, approximately linearly with the logarithm of the rate of deformation. On the basis of the results of the research con -ducted for copper [19] it can be assumed that an increase in yield strength at medium speeds of deformation can reach approximately 25%. An increase in material strength resulting from the speed of deformation in impact tests should result in an increase in the force causing the ma -terial to exceed its strength, and thus increased deformation energy of the tested material and the research system.
CONCLUSIONS
On the basis of the conducted analyses, it may be concluded that in the impact strength test, a larger portion of the recorded energy is related to the deformation energy of the test device, in particular to the pendulum which is bending. Therefore, the results of the impact tests conducted on different research devices should vary considerably.
Length and bending stiffness exert the largest impact on the value of the strain energy of the pendulum arm. The publication [20] shows that a 20% increase in the pendulum stiffness results in a 9% increase in the registered energy of the impact-damaged samples. Therefore, it seems reasonable to claim that the standard beyond the dimensions of the specimens should impose these two characteristics of the test device: length and bending stiffness of the pendulum arm.
In order to fracture the sample material which is characterised with higher impact strength, it is necessary to apply greater force. The strain ener -gy of the pendulum depends on the square of the force. Therefore, the recorded impact strength of the materials is not proportional to their ac -tual impact strength (recorded impact strength of materials more resistant to impact loading is inflated, compared to those which are less re -sistant). In the case of the tested samples with different bending stiffness, the ratio of destruc -tive forces was 2.425; therefore, the pendulum deformation energy destroying a sample with higher stiffness should be about 5.9 times higher than the deformation energy destroying a sample with lower stiffness.
The test standard should contain not only the conditions regarding the samples, the method of testing and the analysis of test results, but also the requirements for the testing device, with particu -lar emphasis on machine rigidity and bending of the pendulum arm.
In further studies, the authors are going to compare the results of impact tests of identical specimens loaded at the same speed and energy on the research devices that differ in the rigidity of bending pendulum arms.
Despite the fact that the results of standard tests depend on many factors, such as the shape and dimensions of the samples and the type of test device and test conditions, they have prac -tical significance, as they allow to compare the resistance of different materials to dynamic loads qualitatively, if the samples of standard shape are tested on the same testing device.
REFERENCES
1. Harada M., Ohya T., Iida K., Hayashi H., Hirano K., Fukuda H. Increase impact strength of biode -gradable poly(lactic acid)/poly(butylene succinate) blend composites by using isocyanate as a reactive processing agent. J Appl Polym Sci, 106(3), 2007; 1813-1820. DOI: 10.1002/app.26717.
2. Ye Y., Chen H., Wu J., Ye L. High impact strength epoxy nanocomposites with natural nanotubes. Polymer, 48(21), 2007; 6426-6433.
3. Yasa E., Deckers J., Kruth J.P., Rombouts M., Luy -ten J. Experimental Investigation of Charpy Impact Tests on Metallic SLM parts. Innovative Develop -ments in Design and Manufacturing: Advanced Research in Virtual and Rapid Prototyping - Pro -ceedings of VRP4, Leiria, 2006.
4. Rzepa S., Bucki T., Konopík P., Džugan J., Rund M., Procházka R. Influence of specimen dimen -sions on ductile-to-brittle transition temperature in Charpy impact test. IOP Conference Series: Mate -rials Science and Engineering, 179(1), 2017. DOI: 10.1088/1757-899X/179/1/012063.
5. Camposo Pereira A. et all, Charpy impact tenac -ity of epoxy matrix composites reinforced with aligned jute fibers, Journal of Materials Research and Technology, 7(4), 2018, 520-527.
6. Száraz Z., Hähner P., Stráská J., Ripplinger S., Effect of phase separation on tensile and Charpy impact properties of MA956 ODS steel, Materials Science and Engineering: A, 700, 2017, 425-437, https://doi.org/10.1016/j.msea.2017.06.010. 7. Ningning Liang, Yonghao Zhao, Jingtao Wang,
Yuntian Zhu, Effect of grain structure on Charpy im -pact behavior of copper, Scientific Reports, 7, 2017 44783, DOI https://doi.org/10.1038/srep44783. 8. Adams R.D., Harris J.A. A critical assessment of
the block impact test for measuring the impact strength of adhesive bonds. Int J Adhes Adhes, 16, 1996; 61-71.
9. Asgharifar M., Kong F., Carlson B., Kovacevic R. Dynamic analysis of adhesively bonded joint under solid projectile impact. Int J Adhes Adhes, 50, 2014; 17–31.
10. Yeong-Seok L., Sang-Hyuk K., Kwang-Jin L., Effect of Residual Stress on the Mechanical Properties of FSW Joints with SUS409L, Ad -vances in Materials Science and Engineering, 2018, Article ID 9890234, 8 pages https://doi. org/10.1155/2018/9890234.
11. Meyers M.A. Dynamic behaviour of materials; Wi -ley and Sons: New York, USA, 1994.
12. Tanks J., Sharp S., Harris D., Charpy impact test -ing to assess the quality and durability of unidi -rectional CFRP rods, Polymer Testing Volume 51, 2016, 63-68.
13. Siewert T.A., Vigliotti D.P., Dirling L.B., and McCowan C.N., Performance Verification of Im -pact Machines for Testing Plastics, J Res Natl Inst Stand Technol, 104(6), 1999; 557–565., doi: 10.6028/jres.104.034.
14. Lucon E., McCowan C.N., Santoyo R.A. Instru -mented Impact Testing: Influence of Machine Vari -ables and Specimen Position - Open Report of the Belgian Nuclear Research Centre, Boeretang, 2008. 15. Lucon E., Santoyo R.A. A Comparative Analysis
of NIST Charpy Machines and Internal Reference Materials – Report of National Institute of Stan -dards and Technology U.S. Department of Com -merce, Boulder, USA, 2016. DOI: http://dx.doi. org/10.6028/NIST.IR.8145.
17. Ashby M.F., Jones D.R.H. Engineering Materials 1. An Introduction to Properties, Applications and Design; Elsevier: Oxford, Great Britain, 2005. 18. Moćko W., Janiszewski J., Radziejewska J., Grązka
M. Analysis of deformation history and damage initiation for 6082-T6 aluminium alloy loaded at classic and symmetric Taylor impact test condi -tions, International Journal of Impact Engineering, 75, 2015, 203-213.
19. Follasbee P.S., Kocks U.F. A Constitutive Descrip -tion of Deforma-tion of Copper Based on the Use of Mechanical Threshold Stress as an Internal State Variable, Acta Metall., 36,1988: 81-93.