R E S E A R C H
Open Access
Feature selection for elderly faller
classification based on wearable sensors
Jennifer Howcroft
1, Jonathan Kofman
1and Edward D. Lemaire
2,3*Abstract
Background:Wearable sensors can be used to derive numerous gait pattern features for elderly fall risk and faller classification; however, an appropriate feature set is required to avoid high computational costs and the inclusion of irrelevant features. The objectives of this study were to identify and evaluate smaller feature sets for faller classification from large feature sets derived from wearable accelerometer and pressure-sensing insole gait data.
Methods:A convenience sample of 100 older adults (75.5 ± 6.7 years; 76 non-fallers, 24 fallers based on 6 month retrospective fall occurrence) walked 7.62 m while wearing pressure-sensing insoles and tri-axial accelerometers at the head, pelvis, left and right shanks. Feature selection was performed using correlation-based feature selection (CFS), fast correlation based filter (FCBF), and Relief-F algorithms. Faller classification was performed using multi-layer perceptron neural network, naïve Bayesian, and support vector machine classifiers, with 75:25 single stratified holdout and repeated random sampling.
Results:The best performing model was a support vector machine with 78% accuracy, 26% sensitivity, 95% specificity, 0.36 F1 score, and 0.31 MCC and one posterior pelvis accelerometer input feature (left acceleration standard deviation). The second best model achieved better sensitivity (44%) and used a support vector machine with 74% accuracy, 83% specificity, 0.44 F1 score, and 0.29 MCC. This model had ten input features: maximum, mean and standard deviation posterior acceleration; maximum, mean and standard deviation anterior acceleration; mean superior acceleration; and three impulse features. The best multi-sensor model sensitivity (56%) was achieved using posterior pelvis and both shank accelerometers and a naïve Bayesian classifier. The best single-sensor model sensitivity (41%) was achieved using the posterior pelvis accelerometer and a naïve Bayesian classifier.
Conclusions:Feature selection provided models with smaller feature sets and improved faller classification compared to faller classification without feature selection. CFS and FCBF provided the best feature subset (one posterior pelvis accelerometer feature) for faller classification. However, better sensitivity was achieved by the second best model based on a Relief-F feature subset with three pressure-sensing insole features and seven head accelerometer features. Feature selection should be considered as an important step in faller classification using wearable sensors.
Keywords:Wearable sensors, Accelerometer, Plantar pressure, Fall risk, Older adults, Prediction, Faller classification, Feature selection
* Correspondence:[email protected]
2Centre for Rehabilitation, Research and Development, Ottawa Hospital
Research Institute, Ottawa, Canada
3Faculty of Medicine, University of Ottawa, Ottawa, Canada
Full list of author information is available at the end of the article
Background
Wearable sensors can be used to assess gait and predict elderly fall risk, with varying degrees of success [1]. Numerous gait pattern features can be derived from a wearable sensor; however, an appropriate feature set is required to avoid high computational costs, “curse of dimensionality”, and irrelevant features [2, 3]. Reducing feature-space size reduces the risk of prediction-model overfitting and may improve classification performance [3, 4]. Even with these benefits, few fall - risk models in the literature employ feature-space size reduction tech-niques to improve classification performance.
Various techniques have been used to reduce the feature-space size before faller classification for wearable-sensor-based elderly fall risk applications. Factor analysis uses a statistical technique to examine variability between correlated features, and represents that variability as fewer factor variables; for example, Riva et al. [5] used this method to represent 24 features as seven factors. Principal component analysis (PCA) is similar to factor analysis but uses orthogonal transformation to represent features as linearly uncorrelated variables called principal compo-nents. PCA was used to represent 24 dynamic stability features with three principal components representing global gait pattern kinetics, global gait regularity, and stride time [6]. Sequential forward floating search algo-rithms start with an empty set (i.e., no features) and add features, starting with the best feature, until classification accuracy is maximized. Liu et al. [7] used this method to reduce feature-space size from 123 features to as few as three features. Forward wrapper feature selection tech-niques can take many forms. The technique used by Caby et al. [8] was similar to a sequential forward float-ing search algorithm, startfloat-ing with an empty set and adding features to maximize classification performance. This method reduced feature-space size from 67 fea-tures to as few as one feature [8]. Only these few stud-ies, which used wearable sensor-derived features for faller classification, reduced feature-space size before faller classification [5–8].
To reduce feature-space size, feature selection tech-niques are preferable to projection techtech-niques (e.g. PCA) and compression techniques (e.g. information theory) be-cause the original features are not altered [4]. Three main feature selection methods can be considered: filter, wrap-per, and embedded. Filter methods focus on intrinsic data properties, with features scored on relevance [3, 4]. Wrap-per methods are developed for a specific classification
method and different feature subsets are tested with the chosen classifier to optimize performance [3, 4]. Wrapper methods can achieve better performance than filter methods but are computationally expensive and can result in overfitting [4]. Embedded methods are similar to wrap-per methods but feature selection is built into the classifier construction, which reduces computational complexity compared to wrapper methods [4]. Caby et al. [8] used a wrapper feature selection method to reduce a wearable-sensor-based feature space before using an intelligent clas-sifier for fall risk prediction. While the wrapper approach is valid, this method ties feature selection to a specific classifier, precluding feature subset evaluation across different classifiers. A classifier-independent, filter ap-proach is preferred because it permits direct comparisons between different classifiers and different feature sets, including a full feature set.
The objectives of this study were to identify smaller feature sets for faller classification from large feature sets derived from wearable accelerometer and pressure-sensing insole gait data, and to evaluate faller classifica-tion performance of these feature sets with different classifiers. This study also evaluated whether feature se-lection would improve faller classification performance compared to classification without feature selection. Successful application of feature selection techniques to faller classification would improve the clinical applicabil-ity of fall risk prediction models by reducing assessment and analysis complexity.
Methods Participants
A convenience sample of 100 people, 65 years or older, were recruited from the community (Table 1). Participants were identified as fallers if they reported at least one fall during the six months prior to study participation. Poten-tial participants were excluded if they had a cognitive disorder (self-reported) or were unable to walk for six minutes without an assistive device. The University of Waterloo Research Ethics Committee approved the study and all participants gave informed written consent.
Protocol
Participants reported six month retrospective fall occur-rence, age, and sex. Body weight and height were measured.
Pressure-sensing insoles (F-Scan 3000E, Tekscan, Boston, MA) were equilibrated using multi-point calibration (137.9,
Table 1Participant characteristics (mean ± standard deviation)
Participants (#) Age (years) Height (cm) Weight (kg) 6MWT (m)
Fallers 13 male, 11 female 76.3 ± 7.0 165.2 ± 10.3 71.9 ± 14.3 446.6 ± 101.4
275.8, 413.7 kPa), fit to the shoes, and calibrated. Acceler-ometers (X16-1C, Gulf Coast Data Concepts, Waveland, MS) were attached to the posterior head with a band, pos-terior pelvis with a belt, and lateral shank, just above the ankle, with a band. Plantar pressure data were collected at 120 Hz and accelerometer data at 50 Hz. Completion time and wearable sensor gait data were collected while partici-pants completed a 7.62 m (25 ft) walk.
Wearable sensor features
Plantar-pressure derived features were:
Center of Pressure (CoP) path: Number, length, and duration of posterior deviations per stance. Number, lateral length, medial length, and duration of medial-lateral (ML) deviations. Anterior-posterior (AP) and ML coefficients of variation (CoV) for the stance phase CoP path.
Temporal: Cadence, stride time, stance time, swing time, percent stance time, percent double support time, stride time symmetry index [9] between the left and right limbs, and CoV for stride time, stance time, and swing time.
Impulse: Impulse variables were determined from the total force-time curve and normalized by body mass (Ns/kg) for: I1 (foot-strike to first peak), I2 (first peak to minimum), I3 (minimum to second peak), I4 (second peak to foot-off ), I5 (foot-strike to minimum), I6 (minimum to foot-off ), and I7 (foot-strike to foot-off ).
All variables were calculated for each stride for the left and right limbs before calculating means and standard
deviations across both limbs (i.e. left and right limb combined).
For each accelerometer location, the accelerometer derived features were:
Descriptive statistics: Maximum, mean, and standard deviation of acceleration for the superior, inferior, anterior, posterior, right, and left axes.
Temporal: Cadence and stride time.
Fast Fourier Transform (FFT): Percentage of acceleration frequencies in the first quartile of an FFT frequency plot for vertical, AP, and ML axes.
Ratio of even to odd harmonics (REOH): Proportion of the acceleration signal in phase with stride frequency. The harmonic ratio was calculated for vertical, AP, and ML axes as in [10].
Maximum Lyapunov exponent (MLE): Average rate of expansion or contraction of the original trajectory in response to perturbations [11,12], calculated for vertical, AP, and ML accelerations, as in [13].
For descriptive statistics and MLE parameters, acceler-ation data were filtered using a fifth order, low pass Butterworth filter with a 12.5 Hz cut-off frequency. Unfiltered acceleration data were used to calculate the FFT quartile and REOH.
Feature selection
Filter feature selection methods were selected because fea-ture subsets from each filter method could be evaluated using three different classifiers, which would not be pos-sible with wrapper or embedded methods. Furthermore, filter methods reduce the computational cost and reduce the risk of overfitting [4]. Three filter feature selection
methods were used: correlation-based feature selection (CFS), fast correlation based filter (FCBF), and Relief-F. CFS and FCBF both provide a minimum subset of features whereas Relief-F provides a ranking of features.
CFS is a supervised method that identifies a subset of features that are correlated with the class label (i.e. faller or non-faller) and uncorrelated with other parameters, and eliminates irrelevant and redundant features [3]. To identify the feature subset, CFS computes the subset’s heuristic measure of ‘merit’ based on pairwise correla-tions [14, 15].
FCBF is a supervised method that identifies predomin-ant features for classification and eliminates redundpredomin-ant features. This method avoids pairwise correlation analysis between all relevant features, reducing computational complexity compared to CFS [16]. The feature subset is selected based on the symmetrical uncertainty [14].
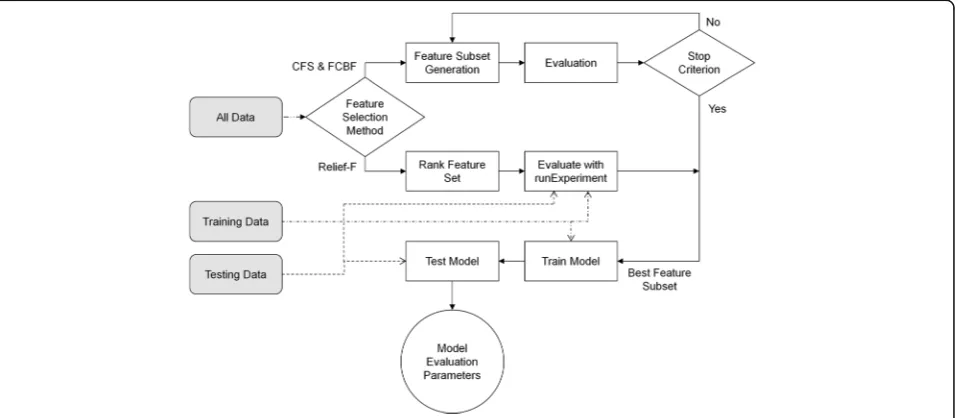
Relief-F is a supervised method that weights the param-eter’s relative strength, and eliminates less relevant fea-tures without eliminating redundant feafea-tures [2, 14]. Relief-F is useful when evaluating parameters with inter-dependencies and noisy data sets [15]. The number of features to include in the Relief-F feature subset was determined using the runExperiment algorithm within the Arizona State University Feature Selection Repository (ASUFSR) [14], which evaluates increasingly larger feature subsets, by five-feature increments, until the entire feature set is included in the subset. For the runExperiment algo-rithm, naïve Bayes (NB) and Support Vector Machine (SVM) were used as classifiers and a 75:25 stratified hold-out was used for training and testing data division, which was also used for model development. The smallest fea-ture subset that did not decrease overall accuracy, or at worst resulted in no more than a 5% decrease in accuracy from the full-feature set, was selected.
Feature selection was performed (Fig. 1) on the entire dataset for all features for each of the 31 sensor combi-nations (Table 2) in Matlab R2010a using ASUFSR algo-rithms [14]. Because the entire dataset was used for feature selection, feature selection was not performed for each iteration of the prediction stability analysis. Identical feature subsets were used as inputs for both the single stratified holdout (model development) and all 10,000 randomized holdouts (prediction stability). Pelvis accelerometer data were missing for two non-fallers and left shank accelerometer data were missing for one non-faller due to sensor power failure.
Model development
Following feature selection, three classifier models were used to assess each feature set: multi-layer perceptron neural network (NN) with 5 to 25 nodes in a single hid-den layer, linear and quadratic discriminant NB, and SVM with one to seven degree polynomial kernels [17].
Table 2Sensor combinations and total number of input parameters (from [17], with permission from the publisher) Sensor
Combination
Sensor Description Total
parameters
I pressure insole 30
H accelerometer (head) 29
P accelerometer (pelvis) 29
LS accelerometer (left shank) 29
RS accelerometer (right shank) 29
H-P accelerometer (head, pelvis) 58
H-LS accelerometer (head, left shank) 58
H-RS accelerometer (head, right shank) 58
P-LS accelerometer (pelvis, left shank) 58
P-RS accelerometer (pelvis, right shank) 58
LS-RS accelerometer (left shank, right shank) 58
H-P-LS accelerometer (head, pelvis, left shank) 87
H-P-RS accelerometer (head, pelvis, right shank) 87
H-LS-RS accelerometer (head, left shank, right shank)
87
P-LS-RS accelerometer (pelvis, left shank, right shank)
87
H-P-LS-RS accelerometer (head, pelvis, left shank, right shank)
116
I-H pressure insole; accelerometer (head) 59
I-P pressure insole; accelerometer (pelvis) 59
I-LS pressure insole; accelerometer (left shank) 59
I-RS pressure insole; accelerometer (right shank) 59
I-H-P pressure insole; accelerometer (head, pelvis) 88
I-H-LS pressure insole; accelerometer (head, left shank)
88
I-H-RS pressure insole; accelerometer (head, right shank)
88
I-P-LS pressure insole; accelerometer (pelvis, left shank)
88
I-P-RS pressure insole; accelerometer (pelvis, right shank)
88
I-LS-RS pressure insole; accelerometer (left shank, right shank)
88
I-H-P-LS pressure insole; accelerometer (head, pelvis, left shank)
117
I-H-P-RS pressure insole; accelerometer (head, pelvis, right shank)
117
I-H-LS-RS pressure insole; accelerometer (head, left shank, right shank)
117
I-P-LS-RS pressure insole; accelerometer (pelvis, left shank, right shank)
117
I-H-P-LS-RS pressure insole; accelerometer (head, pelvis, left shank, right shank)
146
The classification criterion was retrospective fall occur-rence. For all models, 75% of participant data (18 fallers, 57 non-fallers) were used for training and 25% were used for testing (6 fallers, 19 non-fallers). Faller classification using NN, NB, and SVM without feature selection was performed previously [17] using identical train:test groupings and input data, and the top ten models from that previous analysis were used in the current study to evaluate the effect of feature selection on classification performance.
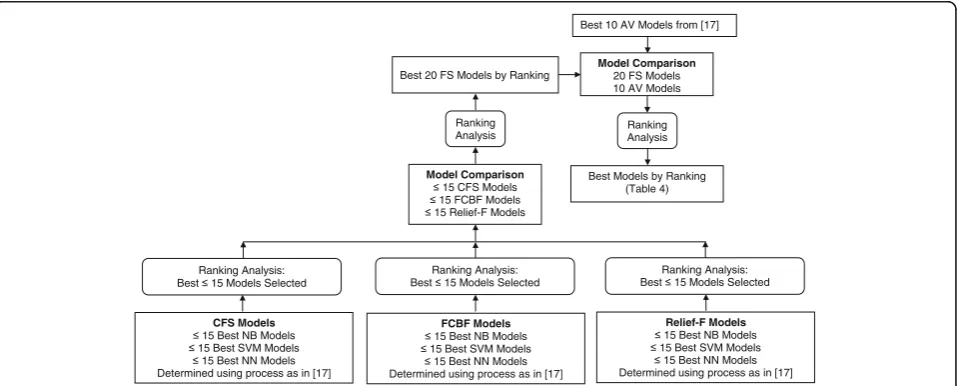
Model evaluation parameters included accuracy, speci-ficity, sensitivity, positive predictive value (PPV), nega-tive predicnega-tive value (NPV) [18], F1 score (harmonic mean of precision and sensitivity) [19], and Matthew’s Correlation Coefficient (MCC) [20]. A ranking method similar to the approach used in Kendell et al., 2012 [21] was employed to determine the best models. Each model evaluation parameter was ranked from best (1) to worst (n), and ranks for all model evaluation parameters were summed to identify the overall best model (lowest summed rank) (Fig. 2). Confidence intervals (CI) for model accuracy were computed using the Wilson interval (Equation 1), which is an appropriate bino-mial proportion interval estimation method for small sample sizes [22].
CI¼pþ
z2
2Nz
ffiffiffiffiffiffiffiffiffiffiffiffiffiffiffiffiffiffiffiffiffiffiffi p
N−p
2
Nþ z
2
4N2
q
1þzN2 ð1Þ
where p is the model accuracy, N is the number of
participants in the test dataset, and z is 1.96 for a 95%
confidence interval.
Prediction stability
The prediction accuracy of the top twenty feature selection-based models and top ten all variable-based models were further examined by training 10,000 models with randomized 75:25 train:test stratified holdouts (repeated random sampling, RRS). Model evaluation pa-rameters were calculated and averaged across all 10,000 models and then ranking was performed, as described previously.
Results
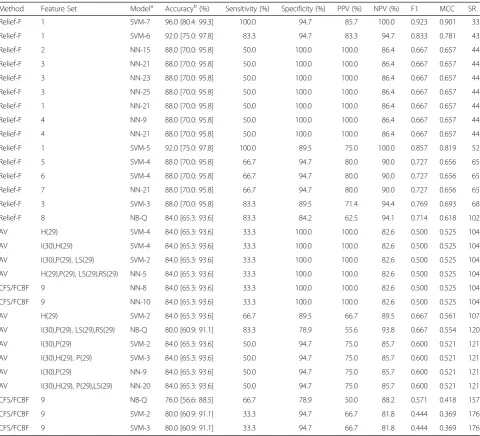
Nine feature subsets (eight Relief-F, one CFS, one FCBF: Table 3) were inputs for the twenty best models (Table 4). CFS and FCBF analyses outputted the same feature set (Feature Subset 9). For the single 75:25 train:test stratified holdout, the top fifteen models used Relief-F feature selec-tion, with the top two models (Feature Subset 1, SVM-6 and SVM-7) including three insole measures and seven head accelerometer measures (Table 3). The top model (Feature Subset 1, SVM-7) achieved the highest accuracy (96%), sensitivity (100%), NPV (100%), F1 score (0.92) and MCC (0.90) and a specificity of 95%, and PPV of 86%. Two single-sensor-based models ranked 11th (Feature Subset 5 with head accelerometer sensor, SVM-4; and Fea-ture Subset 6 with pelvis accelerometer sensor, SVM-4), achieving an accuracy of 88%, sensitivity 67%, specificity 95%, PPV 80%, NPV 90%, F1 score 0.73, and MCC 0.66. The twenty best models using feature selection were com-pared to the ten best models generated using all combina-tions of variables (AV) but no feature selection [17] (Table 4). The top fifteen models that used feature selec-tion outperformed the best models that did not use feature selection.
Relief-F Models 15 Best NB Models 15 Best SVM Models
15 Best NN Models Determined using process as in [17] FCBF Models
15 Best NB Models 15 Best SVM Models
15 Best NN Models Determined using process as in [17] CFS Models
15 Best NB Models 15 Best SVM Models 15 Best NN Models Determined using process as in [17]
Ranking Analysis: Best 15 Models Selected
Model Comparison 15 CFS Models 15 FCBF Models 15 Relief-F Models
Ranking Analysis Best 20 FS Models by Ranking
Ranking Analysis: Best 15 Models Selected
Ranking Analysis: Best 15 Models Selected Best 10 AV Models from [17]
Model Comparison 20 FS Models 10 AV Models
Ranking Analysis
Best Models by Ranking (Table 4)
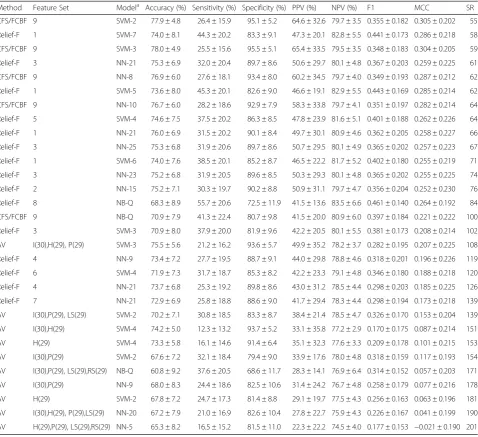
The RRS model performance (Table 5) was lower than results from the single 75:25 train:test stratified holdout (Table 4) for all of the thirty evaluated models. The single 75:25 train:test stratified holdout used in the initial ana-lysis resulted in model performance at the upper end of model performances observed over 10,000 randomiza-tions. A histogram of RRS model accuracies is shown in Fig. 3, for Feature Subset 1, SVM-7, where the single hold-out accuracy of 96% was one of the best accuracies. Simi-lar to the single holdout results (Table 4), the top sixteen RRS models that used feature selection outperformed the best models that did not use feature selection (AV models). The top model (Feature Subset 1, SVM-7) from
the single 75:25 train:test stratified holdout ranked second best after RRS, with 74% accuracy, 44% sensitivity, 83% specificity, 47% PPV, 83% NPV, 0.44 F1 score, and 0.29 MCC. The top RRS model (Feature Subset 9, SVM-2) achieved 78% accuracy, 26% sensitivity, 95% specificity, 65% PPV, 80% NPV, 0.36 F1 score, and 0.31 MCC.
Discussion
The three feature selection techniques, CFS, FCBF, and Relief-F, successfully reduced the feature set from up to 146 features, derived from pressure-sensing insoles and four wearable accelerometers, to a viable set containing as few as one feature. Models derived using the reduced feature sets outperformed models derived using the full feature set when classifying fall risk, demonstrating the benefits of feature selection methods when creating faller classification models.
Relief-F feature selection performed well for the single 75:25 stratified holdout and RRS. A feature subset out-putted by both CFS and FCBF feature selection tech-niques was used in the top RRS model. In other classification studies, CFS and FCBF provided the best feature subsets [16, 23]. However, these studies were not classifying elderly fall risk and instead classified human activities such as sitting, standing, and stair walking [23] or benchmark data sets that include healthcare diagno-ses and census data [16]. Elderly fall risk is a complex classification problem where differences between fallers and non-fallers are often subtle and varied [24]. Relief-F feature selection has recognized strengths when dealing with noisy data sets and parameters with interdependen-cies [15], which may make this method suitable for elderly faller classification, in addition to CFS and FCBF feature selection techniques.
The best model (Feature Subset 1, SVM-7) for the sin-gle 75:25 stratified holdout and second best RRS model contained ten features: 3 pressure-sensing insole features and seven head accelerometer features. For the single 75:25 stratified holdout, this model achieved 96% accur-acy, 0.92 F1 score, and 0.90 MCC. With 100% sensitivity, this model would be an excellent screening tool because all fallers would be identified.“Feature Subset 1, SVM-7” results were comparable to the best faller classification results in the literature: Caby et al. [8] with 100% accuracy and Giansanti et al. [25] with 97% accuracy. However, RRS model performance was lower, with an accuracy of 74%, F1 score of 0.44, and MCC of 0.29. This lower model performance is likely more indicative of future model performance given the large number of models trained with different data splits. With RRS analysis, this wearable sensor approach did not achieve 80% accuracy, which is often considered a threshold for good classification.
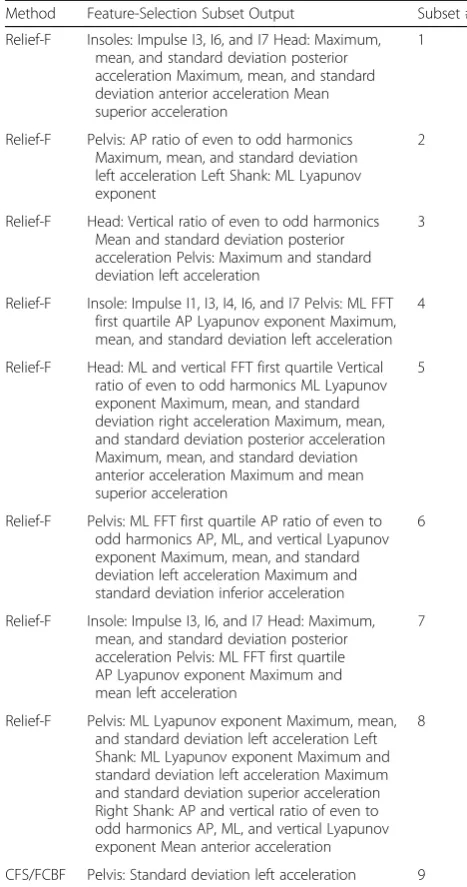
Table 3Feature-selection subsets used as inputs for faller classification models
Method Feature-Selection Subset Output Subset #
Relief-F Insoles: Impulse I3, I6, and I7 Head: Maximum, mean, and standard deviation posterior acceleration Maximum, mean, and standard deviation anterior acceleration Mean superior acceleration
1
Relief-F Pelvis: AP ratio of even to odd harmonics Maximum, mean, and standard deviation left acceleration Left Shank: ML Lyapunov exponent
2
Relief-F Head: Vertical ratio of even to odd harmonics Mean and standard deviation posterior acceleration Pelvis: Maximum and standard deviation left acceleration
3
Relief-F Insole: Impulse I1, I3, I4, I6, and I7 Pelvis: ML FFT first quartile AP Lyapunov exponent Maximum, mean, and standard deviation left acceleration
4
Relief-F Head: ML and vertical FFT first quartile Vertical ratio of even to odd harmonics ML Lyapunov exponent Maximum, mean, and standard deviation right acceleration Maximum, mean, and standard deviation posterior acceleration Maximum, mean, and standard deviation anterior acceleration Maximum and mean superior acceleration
5
Relief-F Pelvis: ML FFT first quartile AP ratio of even to odd harmonics AP, ML, and vertical Lyapunov exponent Maximum, mean, and standard deviation left acceleration Maximum and standard deviation inferior acceleration
6
Relief-F Insole: Impulse I3, I6, and I7 Head: Maximum, mean, and standard deviation posterior acceleration Pelvis: ML FFT first quartile AP Lyapunov exponent Maximum and mean left acceleration
7
Relief-F Pelvis: ML Lyapunov exponent Maximum, mean, and standard deviation left acceleration Left Shank: ML Lyapunov exponent Maximum and standard deviation left acceleration Maximum and standard deviation superior acceleration Right Shank: AP and vertical ratio of even to odd harmonics AP, ML, and vertical Lyapunov exponent Mean anterior acceleration
8
CFS/FCBF Pelvis: Standard deviation left acceleration 9
The pressure-sensing insole features in Feature Subset 1 were impulse measures I3, I6, and I7. I3 and I6 meas-ure impulse during the second half of stance phase and I7 measures impulse during the entire stance phase. This indicates the importance of force magnitude and timing of force application during stance phase for faller identi-fication, with fallers having lower I3, I6, and I7 impulse compared to non-fallers [24]. The lower impulse could indicate reduced force application due to muscle weak-ness, which is a fall risk factor [26, 27]. The head fea-tures were maximum, mean, and standard deviation for
posterior and anterior acceleration, and mean superior acceleration. Head accelerations in the direction of pro-gression was important for faller classification, with fallers having greater posterior and lower anterior accel-eration compared to non-fallers [24].
Based on RRS model performances, the best model (Feature Subset 9, SVM-2) contained one feature from the posterior pelvis accelerometer: left acceleration standard deviation. This model achieved 78% accuracy, 26% sensitivity, 95% specificity, 65% PPV, 80% NPV, 0.36 F1 score, and 0.31 MCC. The posterior pelvis
Table 4Best twenty models using feature selection and best ten all variable (AV) models using a single 75:25 train:test stratified holdout. Feature subset numbers are defined in Table 3. For AV, feature set indicates the sensor and number of variables (in parentheses) in the subset
Method Feature Set Modela Accuracyb(%) Sensitivity (%) Specificity (%) PPV (%) NPV (%) F1 MCC SR
Relief-F 1 SVM-7 96.0 [80.4: 99.3] 100.0 94.7 85.7 100.0 0.923 0.901 33
Relief-F 1 SVM-6 92.0 [75.0: 97.8] 83.3 94.7 83.3 94.7 0.833 0.781 43
Relief-F 2 NN-15 88.0 [70.0: 95.8] 50.0 100.0 100.0 86.4 0.667 0.657 44
Relief-F 3 NN-21 88.0 [70.0: 95.8] 50.0 100.0 100.0 86.4 0.667 0.657 44
Relief-F 3 NN-23 88.0 [70.0: 95.8] 50.0 100.0 100.0 86.4 0.667 0.657 44
Relief-F 3 NN-25 88.0 [70.0: 95.8] 50.0 100.0 100.0 86.4 0.667 0.657 44
Relief-F 1 NN-21 88.0 [70.0: 95.8] 50.0 100.0 100.0 86.4 0.667 0.657 44
Relief-F 4 NN-9 88.0 [70.0: 95.8] 50.0 100.0 100.0 86.4 0.667 0.657 44
Relief-F 4 NN-21 88.0 [70.0: 95.8] 50.0 100.0 100.0 86.4 0.667 0.657 44
Relief-F 1 SVM-5 92.0 [75.0: 97.8] 100.0 89.5 75.0 100.0 0.857 0.819 52
Relief-F 5 SVM-4 88.0 [70.0: 95.8] 66.7 94.7 80.0 90.0 0.727 0.656 65
Relief-F 6 SVM-4 88.0 [70.0: 95.8] 66.7 94.7 80.0 90.0 0.727 0.656 65
Relief-F 7 NN-21 88.0 [70.0: 95.8] 66.7 94.7 80.0 90.0 0.727 0.656 65
Relief-F 3 SVM-3 88.0 [70.0: 95.8] 83.3 89.5 71.4 94.4 0.769 0.693 68
Relief-F 8 NB-Q 84.0 [65.3: 93.6] 83.3 84.2 62.5 94.1 0.714 0.618 102
AV H(29) SVM-4 84.0 [65.3: 93.6] 33.3 100.0 100.0 82.6 0.500 0.525 104
AV I(30),H(29) SVM-4 84.0 [65.3: 93.6] 33.3 100.0 100.0 82.6 0.500 0.525 104
AV I(30),P(29), LS(29) SVM-2 84.0 [65.3: 93.6] 33.3 100.0 100.0 82.6 0.500 0.525 104
AV H(29),P(29), LS(29),RS(29) NN-5 84.0 [65.3: 93.6] 33.3 100.0 100.0 82.6 0.500 0.525 104
CFS/FCBF 9 NN-8 84.0 [65.3: 93.6] 33.3 100.0 100.0 82.6 0.500 0.525 104
CFS/FCBF 9 NN-10 84.0 [65.3: 93.6] 33.3 100.0 100.0 82.6 0.500 0.525 104
AV H(29) SVM-2 84.0 [65.3: 93.6] 66.7 89.5 66.7 89.5 0.667 0.561 107
AV I(30),P(29), LS(29),RS(29) NB-Q 80.0 [60.9: 91.1] 83.3 78.9 55.6 93.8 0.667 0.554 120
AV I(30),P(29) SVM-2 84.0 [65.3: 93.6] 50.0 94.7 75.0 85.7 0.600 0.521 121
AV I(30),H(29), P(29) SVM-3 84.0 [65.3: 93.6] 50.0 94.7 75.0 85.7 0.600 0.521 121
AV I(30),P(29) NN-9 84.0 [65.3: 93.6] 50.0 94.7 75.0 85.7 0.600 0.521 121
AV I(30),H(29), P(29),LS(29) NN-20 84.0 [65.3: 93.6] 50.0 94.7 75.0 85.7 0.600 0.521 121
CFS/FCBF 9 NB-Q 76.0 [56.6: 88.5] 66.7 78.9 50.0 88.2 0.571 0.418 157
CFS/FCBF 9 SVM-2 80.0 [60.9: 91.1] 33.3 94.7 66.7 81.8 0.444 0.369 176
CFS/FCBF 9 SVM-3 80.0 [60.9: 91.1] 33.3 94.7 66.7 81.8 0.444 0.369 176
AVall variables,Ipressure-sensing insole measures,Hhead accelerometer measures,Ppelvis accelerometer measures,LSleft shank accelerometer measures,RS right shank accelerometer measures,NNneural network,NBnaïve Bayesian model,SVMsupport vector machine,SRsummed rank
a
NN-a, whereais the number of nodes in the hidden layer; SVM-b, wherebis the polynomial degree; NB-Q is quadratic naïve Bayesian
b
location allows unobtrusive and easy monitoring with a belt attached sensor or accelerometer-equipped smart-phone, and high user acceptance was found in a 20-day case-study with a lower back sensor [28]. While this single-sensor RRS model ranked higher than the best multi-sensor RRS model, the single-sensor model had a much lower sensitivity 26% compared to 44% with the best multi-sensor model (Feature Subset 1, SVM-7). Given that the goal of the model is to identify fallers, the multi-sensor model with higher sensitivity (true positive rate), may be preferable even though the
accuracy is lower (multi-sensor: 74%, single-sensor: 78%). The best RRS model sensitivity was 56% (Feature Subset 8, NB-Q) with accuracy 68%, F1 score 0.46, and MCC 0.26. The best single-sensor RRS model sensitiv-ity was 41% (Feature Subset 9, posterior pelvis acceler-ometer only, NB-Q) with accuracy 71%, F1 score 0.40, and MCC 0.22.
Models with a feature subset performed better than models with a complete feature set, demonstrating the importance of including feature reduction when defining models for faller classification. Feature
Table 5RRS model results for the best twenty models using feature selection and best ten all variable (AV) models. Feature subset numbers are defined in Table 3. For AV, feature set indicates the sensor and number of variables (in parentheses) in the subset. Results are mean ± standard deviation
Method Feature Set Modela Accuracy (%) Sensitivity (%) Specificity (%) PPV (%) NPV (%) F1 MCC SR
CFS/FCBF 9 SVM-2 77.9 ± 4.8 26.4 ± 15.9 95.1 ± 5.2 64.6 ± 32.6 79.7 ± 3.5 0.355 ± 0.182 0.305 ± 0.202 55
Relief-F 1 SVM-7 74.0 ± 8.1 44.3 ± 20.2 83.3 ± 9.1 47.3 ± 20.1 82.8 ± 5.5 0.441 ± 0.173 0.286 ± 0.218 58
CFS/FCBF 9 SVM-3 78.0 ± 4.9 25.5 ± 15.6 95.5 ± 5.1 65.4 ± 33.5 79.5 ± 3.5 0.348 ± 0.183 0.304 ± 0.205 59
Relief-F 3 NN-21 75.3 ± 6.9 32.0 ± 20.4 89.7 ± 8.6 50.6 ± 29.7 80.1 ± 4.8 0.367 ± 0.203 0.259 ± 0.225 61
CFS/FCBF 9 NN-8 76.9 ± 6.0 27.6 ± 18.1 93.4 ± 8.0 60.2 ± 34.5 79.7 ± 4.0 0.349 ± 0.193 0.287 ± 0.212 62
Relief-F 1 SVM-5 73.6 ± 8.0 45.3 ± 20.1 82.6 ± 9.0 46.6 ± 19.1 82.9 ± 5.5 0.443 ± 0.169 0.285 ± 0.214 62
CFS/FCBF 9 NN-10 76.7 ± 6.0 28.2 ± 18.6 92.9 ± 7.9 58.3 ± 33.8 79.7 ± 4.1 0.351 ± 0.197 0.282 ± 0.214 64
Relief-F 5 SVM-4 74.6 ± 7.5 37.5 ± 20.2 86.3 ± 8.5 47.8 ± 23.9 81.6 ± 5.1 0.401 ± 0.188 0.262 ± 0.226 64
Relief-F 1 NN-21 76.0 ± 6.9 31.5 ± 20.2 90.1 ± 8.4 49.7 ± 30.1 80.9 ± 4.6 0.362 ± 0.205 0.258 ± 0.227 66
Relief-F 3 NN-25 75.3 ± 6.8 31.9 ± 20.6 89.7 ± 8.6 50.7 ± 29.5 80.1 ± 4.9 0.365 ± 0.202 0.257 ± 0.223 67
Relief-F 1 SVM-6 74.0 ± 7.6 38.5 ± 20.1 85.2 ± 8.7 46.5 ± 22.2 81.7 ± 5.2 0.402 ± 0.180 0.255 ± 0.219 71
Relief-F 3 NN-23 75.2 ± 6.8 31.9 ± 20.5 89.6 ± 8.5 50.3 ± 29.3 80.1 ± 4.8 0.365 ± 0.202 0.255 ± 0.225 74
Relief-F 2 NN-15 75.2 ± 7.1 30.3 ± 19.7 90.2 ± 8.8 50.9 ± 31.1 79.7 ± 4.7 0.356 ± 0.204 0.252 ± 0.230 76
Relief-F 8 NB-Q 68.3 ± 8.9 55.7 ± 20.6 72.5 ± 11.9 41.5 ± 13.6 83.5 ± 6.6 0.461 ± 0.140 0.264 ± 0.192 84
CFS/FCBF 9 NB-Q 70.9 ± 7.9 41.3 ± 22.4 80.7 ± 9.8 41.5 ± 20.0 80.9 ± 6.0 0.397 ± 0.184 0.221 ± 0.222 100
Relief-F 3 SVM-3 70.9 ± 8.0 37.9 ± 20.0 81.9 ± 9.6 42.2 ± 20.5 80.1 ± 5.5 0.381 ± 0.173 0.208 ± 0.214 102
AV I(30),H(29), P(29) SVM-3 75.5 ± 5.6 21.2 ± 16.2 93.6 ± 5.7 49.9 ± 35.2 78.2 ± 3.7 0.282 ± 0.195 0.207 ± 0.225 108
Relief-F 4 NN-9 73.4 ± 7.2 27.7 ± 19.5 88.7 ± 9.1 44.0 ± 29.8 78.8 ± 4.6 0.318 ± 0.201 0.196 ± 0.226 119
Relief-F 6 SVM-4 71.9 ± 7.3 31.7 ± 18.7 85.3 ± 8.2 42.2 ± 23.3 79.1 ± 4.8 0.346 ± 0.180 0.188 ± 0.218 120
Relief-F 4 NN-21 73.7 ± 6.8 25.3 ± 19.2 89.8 ± 8.6 43.0 ± 31.2 78.5 ± 4.4 0.298 ± 0.203 0.185 ± 0.225 126
Relief-F 7 NN-21 72.9 ± 6.9 25.8 ± 18.8 88.6 ± 9.0 41.7 ± 29.4 78.3 ± 4.4 0.298 ± 0.194 0.173 ± 0.218 139
AV I(30),P(29), LS(29) SVM-2 70.2 ± 7.1 30.8 ± 18.5 83.3 ± 8.7 38.4 ± 21.4 78.5 ± 4.7 0.326 ± 0.170 0.153 ± 0.204 139
AV I(30),H(29) SVM-4 74.2 ± 5.0 12.3 ± 13.2 93.7 ± 5.2 33.1 ± 35.8 77.2 ± 2.9 0.170 ± 0.175 0.087 ± 0.214 151
AV H(29) SVM-4 73.3 ± 5.8 16.1 ± 14.6 91.4 ± 6.4 35.1 ± 32.3 77.6 ± 3.3 0.209 ± 0.178 0.101 ± 0.215 153
AV I(30),P(29) SVM-2 67.6 ± 7.2 32.1 ± 18.4 79.4 ± 9.0 33.9 ± 17.6 78.0 ± 4.8 0.318 ± 0.159 0.117 ± 0.193 154
AV I(30),P(29), LS(29),RS(29) NB-Q 60.8 ± 9.2 37.6 ± 20.5 68.6 ± 11.7 28.3 ± 14.1 76.9 ± 6.4 0.314 ± 0.152 0.057 ± 0.203 171
AV I(30),P(29) NN-9 68.0 ± 8.3 24.4 ± 18.6 82.5 ± 10.6 31.4 ± 24.2 76.7 ± 4.8 0.258 ± 0.179 0.077 ± 0.216 178
AV H(29) SVM-2 67.8 ± 7.2 24.7 ± 17.3 81.4 ± 8.8 29.1 ± 19.7 77.5 ± 4.3 0.256 ± 0.163 0.063 ± 0.196 181
AV I(30),H(29), P(29),LS(29) NN-20 67.2 ± 7.9 21.0 ± 16.9 82.6 ± 10.4 27.8 ± 22.7 75.9 ± 4.3 0.226 ± 0.167 0.041 ± 0.199 190
AV H(29),P(29), LS(29),RS(29) NN-5 65.3 ± 8.2 16.5 ± 15.2 81.5 ± 11.0 22.3 ± 22.2 74.5 ± 4.0 0.177 ± 0.153 −0.021 ± 0.190 201
AVall variables,Ipressure-sensing insole measures,Hhead accelerometer measures,Ppelvis accelerometer measures,LSleft shank accelerometer measures,RS right shank accelerometer measures,NNneural network,NBnaïve Bayesian model,SVMsupport vector machine,SRsummed rank
a
selection techniques removed irrelevant features and improved classification accuracy. Improved classifica-tion accuracy is one of the expected advantages of feature selection [3, 4, 23].
A stratified holdout was performed and confidence intervals calculated using the Wilson interval, as recom-mended by Shany et al. [29] in their recent review paper. Shany and colleagues recommended external validation as the optimal method for validating model performance, followed by holdout validation with confidence intervals computed, and finally cross validation, although it is cur-rently not theoretically known whether cross-validation gives a better estimate of future model performance than simple holdout validation [29]. From our study, the results indicated that simple holdout validation may not accur-ately estimate future model performance, particularly when many models are investigated. Some accuracy confi-dence intervals did not include the average RRS model performance achieved across 10,000 stratified holdouts. For example, the accuracy for Feature Subset 1, SVM-7 was 96% with a 95% confidence interval of 80% to 99% for a single stratified holdout; however, the average RRS accur-acy was 74%, which was 6% less than the lower confidence limit. With this older-adult gait dataset, a wide variance in model performance occurred with different train:test data divisions (Fig. 3). Therefore, cross-validation may be preferred over simple holdout validation for model devel-opment because cross-validation reduces the influence of the data partition on model performance. Furthermore, randomization of a large number of holdouts, such as the 10,000 randomizations performed in this study, may be preferred when evaluating model performance.
This study used retrospective fall occurrence as the cri-terion for classifying faller and non-faller status. While this is superior to using a clinical assessment based criterion
[1], future studies should use prospective fall occurrence as the criterion for evaluating model classification per-formance. Retrospective fall occurrence is limited by inaccurate recall of falls and changes to gait patterns that occur between the fall and assessment, either in an attempt to increase stability or from fear of falling.
MLE reliability, since stable MLE measures occurred after 35 strides in [39].
Conclusion
Feature selection provided models with smaller feature sets and improved faller classification compared to faller classification without feature selection. CFS and FCBF provided the best feature subset for faller classification with a model based on one posterior pelvis accelerom-eter feature. However, better sensitivity was achieved by the second best model based on a Relief-F feature subset with three pressure-sensing insole features and seven head accelerometer features. Feature selection should be considered as an important step in faller classification using wearable sensors.
Abbreviations
AP:Anterior-posterior; ASUFSR: Arizona State University Feature Selection Repository; AV: All variables; CFS: Correlation-based feature selection; CoP: Center of pressure; CoV: Coefficient of variation; FCBF: Fast correlation based filter; FFT: Fast Fourier transform; H: Head accelerometer measures; I: Pressure-sensing insole measures; LS: Left shank accelerometer measures; MCC: Matthew’s correlation coefficient; ML: Medial-lateral; MLE: Maximum Lyapunov exponent; NB: Naïve Bayes; NB-Q: Quadratic naïve Bayes; NN: Neural network; NPV: Negative predictive value; P: Pelvis accelerometer measures; PCA: Principal component analysis; PPV: Positive predictive value; REOH: Ratio of even to odd harmonics; RS: Right shank accelerometer measures; SR: Summed rank; SVM: Support vector machine
Acknowledgements
The authors thank Deep Shah for assistance with data collection, United Church of Canada and the University of Waterloo Retirees Association for assistance with recruitment, and Chartwell Bankside Terrace Retirement Residence for assistance with recruitment and providing space for data collection at their facility.
Funding
This project was funded by Natural Sciences and Engineering Research Council of Canada (NSERC). NSERC had no role in the design of the study and collection, analysis, interpretation of data, or writing the manuscript.
Availability of data and materials
The datasets supporting the conclusions of the article are available in the dataverse repository [http://hdl.handle.net/10864/11530].
Authors’contributions
JH, JK, and EL all contributed substantially to all study aspects including conception and design, data acquisition, data analysis and interpretation, revising and editing the manuscript, and approving the final manuscript.
Competing interests
The authors declare that they have no competing interests.
Consent for publication
Not applicable.
Ethics approval and consent to participate
The Office of Research Ethics at the University of Waterloo approved the study (ORE#: 19106) and all participants gave informed written consent.
Publisher’s Note
Springer Nature remains neutral with regard to jurisdictional claims in published maps and institutional affiliations.
Author details
1Department of Systems Design Engineering, University of Waterloo,
Waterloo, Canada.2Centre for Rehabilitation, Research and Development, Ottawa Hospital Research Institute, Ottawa, Canada.3Faculty of Medicine, University of Ottawa, Ottawa, Canada.
Received: 20 April 2016 Accepted: 15 May 2017
References
1. Howcroft J, Kofman J, Lemaire ED. Review of fall risk assessment in geriatric populations using inertial sensors. J Neuroeng Rehabil. 2013;10:91. 2. Zhang M, Sawchuk AA. A Feature selection-based framework for human
activity recognition using wearable multimodal sensors. In: Proceedings of the 6th International Conference on Body Area Networks: November 7-10, 2011. Beijing, China. 2011. p. 92–8.
3. Hall MA, Smith LA. Feature selection for machine learning: Comparing a correlation-based filter approach to the wrapper. In: Proceedings of the Twelfth International Florida Artificial Intelligence Research Society Conference: May 1-5, 1999. Orlando, Florida, USA. 1999. p. 235–9. 4. Saeys Y, Inza I, Larranaga P. A review of feature selection techniques in
bioinformatics. Bioinformatics. 2007;23:2507–17.
5. Riva F, Toebes MJP, Pijnappels M, Stagni R, van Dieen JH. Estimating fall risk with inertial sensors using gait stability measures that do not require step detection. Gait Posture. 2013;38:170–4.
6. Mignardot J-B, Deschamps T, Barrey E, Auvinet B, Berrut G, Cornu C, Constans T, de Decker L. Gait disturbances as specific predictive makers of the first fall onset in elderly people: a two-year prospective observational study. Front Aging Neurosci. 2014;6:22.
7. Liu Y, Redmond SJ, Narayanan MR, Lovell NH. Classification between non-multiple fallers and non-multiple fallers using a triaxial accelerometry-based system. In: Proceedings of the 33rd Annual Conference of IEEE EMBS: August 30-September 3, 2011. Boston, Massachusetts. 2011. p. 1499–502. 8. Caby B, Kieffer S, de Saint HM, Cremer G, Macq B. Feature extraction and
selection for objective gait analysis and fall risk assessment by accelerometry. Biomed Eng Online. 2011;10:1.
9. Sadeghi H, Allard P, Prince F, Labelle H. Symmetry and limb dominance in able-bodied gait: A review. Gait Posture. 2000;12:34–45.
10. Smidt GL, Arora JS, Johnston RC. Accelerographic analysis of several types of walking. Am J Phys Med. 1971;50:285–300.
11. Liu J, Lockhart TE, Jones M, Martin T. Local dynamic stability assessment of motion impaired elderly using electronic textile pants. IEEE Trans Autom Sci Eng. 2008;5:696–702.
12. Toebes MJP, Hoozemans MJM, Furrer R, Dekker J, van Dieen JH. Local dynamic stability and variability of gait are associated with fall history in elderly subjects. Gait Posture. 2012;36:527–31.
13. van Schooten KS, Rispens SM, Pijnappels M, Daffertshofer A, van Dieen JH. Assessing gait stability: The influence of state space reconstruction on inter-and intra-day reliability of local dynamic stability during over-ground walking. J Biomech. 2013;46:137–41.
14. Zhao Z, Morstatter F, Sharma S, Alelyani S, Anand A, Liu H. Advancing feature selection research-ASU feature selection repository. Arizona State University. 2016. http://featureselection.asu.edu/old/featureselection_ techreport.pdf. Accessed 4 Apr 2016
15. Liu H, Motoda H. Computational methods of feature selection. Boca Ranton: Chapman & Hall/CRC; 2008.
16. Yu L, Liu H. Feature selection for high dimensional data: A fast correlation-based filter solution. In: Proceedings of the 20th International Conference on Machine Learning: August 21-24, 2003. Washington, DC, USA. 2003. p. 856–63.
17. Howcroft J, Lemaire ED, Kofman J. Wearable-sensor-based classification models of faller status in older adults. PLoS One. 2016;11:e0153240. 18. Lalkhen AG, McCluskey A. Clinical tests: Sensitivity and specificity. CEACCP.
2008;8(6):221–3.
19. van Rijsbergen CJ. Information Retrieval. London: Butterworths; 1979. 20. Matthews BW. Comparison of the predicted and observed secondary
structure of T4 phage lysozyme. Biochim Biophys Acta. 1975;405:442–51. 21. Kendell C, Lemaire ED, Losier Y, Wilson A, Chan A, Hudgins B. A novel
22. Brown LD, Cai TT, DasGupta A. Interval estimation for a binomial proportion. Stat Sci. 2001;16(2):101–33.
23. Capela NA, Lemaire ED, Baddour N. Feature selection for wearable smartphone-based human activity recognition with able bodied, elderly, and stroke patients. PLoS One. 2015;10(4):e0124414.
24. Howcroft J, Kofman J, Lemaire ED, McIlroy WE. Analysis of dual-task elderly gait in fallers and non-fallers using wearable sensors. J Biomech. 2016;49(7): 992-1001.
25. Giansanti D, Macellari V, Maccioni G. New neural network classifier of fall-risk based on the Mahalanobis distance and kinematic parameters assessed by a wearable device. Physiol Meas. 2008;29:N11–9.
26. Martin FC. Falls risk factors: Assessment and management to prevent falls and fractures. Can J Aging. 2011;30:33–44.
27. Pijnappels M, van der Burg PJCE, Reeves ND, van Dieen JH. Identification of elderly fallers by muscle strength measures. Eur J Appl Physiol. 2008;102:585–92. 28. Giansanti D, Morelli S, Maccioni G, Constantini G. Toward the design of a
wearable system for fall-risk detection in telerehabilitation. Telemed e-Health. 2009;15:296–9.
29. Shany T, Wang K, Liu Y, Lovell NH, Redmond SJ. Review: Are we stumbling in our quest to find the best predictor? Over-optimism in sensor-based models for predicting falls in older adults. Healthc Technol Lett. 2015;2:79–88. 30. Ihlen EAF, Weiss A, Helbostad JL, Hausdorff JM. The discriminant value of
phase-dependent local dynamic stability of daily life walking in older adult community-dwelling fallers and nonfallers. Biomed Res Int. 2015;2015: 402596.
31. Ihlen EA, Weiss A, Beck Y, Helbostad JL, Hausdorff JM. A comparison study of local dynamic stability measures of daily life walking in older adult community-dwelling fallers and non-fallers. J Biomech. 2016;49:1498–503. 32. Ganea R, Paraschiv-Ionescu A, Bula C, Rochat S, Aminian K. Multi-parametric
evaluation of sit-to-stand and stand-to-sit transitions in elderly people. Med Eng Phys. 2011;33:1086–93.
33. Martinez-Ramirez A, Lecumberri P, Gomez M, Rodriguez-Manas L, Garcia FJ, Izquierdo M. Frailty assessment based on wavelet analysis during quiet standing balance test. J Biomech. 2011;44:2213–20.
34. Rispens SM, van Dieen JH, van Schooten KS, Lizama LEC, Daffertshofer A, Beek PJ, Pijnappels M. Fall-related gait characteristics on the treadmill and in daily life. J Neuroeng Rehabil. 2016;13:12.
35. Wang K, Lovell NH, Del Rosario MB, Liu Y, Wang J, Narayanan MR, Brodie MAD, Delbaere K, Menant J, Lord SR, Redmond SJ. Inertial measurements of free-living activities: Assessing mobility to predict falls. In: Proceedings of the 36thAnnual Conference of IEEE EMBS: 26-30 August, 2014. Chicago, Illinois. 2014. p. 6892–5.
36. Weiss A, Brozgol M, Dorfman M, Herman T, Shema S, Giladi N, Hausdorff JM. Does the evaluation of gait quality during daily life provide insight into fall risk? A novel approach using 3-day accelerometer recordings. Neurorehabil Neural Repair. 2013;27:742–52.
37. Hauser SL, Dawson DM, Lehrich JR, Beal MF, Kevy SV, Propper RD, Mills JA, Weiner HL. Intensive immunosuppression in progressive multiple sclerosis. A randomized, three-arm study of high-dose intravenous cyclophosphamide, plasma exchange, and ACTH. N Engl J Med. 1983;308:173–80.
38. Bohannon RW. Comfortable and maximum walking speed of adults aged 20–79 years: Reference values and determinants. Age Ageing. 1997;26:15–9. 39. Stergiou N, Buzzi UH, Kurz MJ, Heidel J. Nonlinear tools in human
movement. In: Stergiou N, editor. Innovative Analyses of Human Movement: Analytical Tools for Human Movement Research. Champaign: Human Kinetics; 2004. p. 63–90.
• We accept pre-submission inquiries
• Our selector tool helps you to find the most relevant journal
• We provide round the clock customer support
• Convenient online submission
• Thorough peer review
• Inclusion in PubMed and all major indexing services
• Maximum visibility for your research
Submit your manuscript at www.biomedcentral.com/submit

![Table 2 Sensor combinations and total number of inputparameters (from [17], with permission from the publisher)](https://thumb-us.123doks.com/thumbv2/123dok_us/9052850.1897909/4.595.305.541.113.688/table-sensor-combinations-total-number-inputparameters-permission-publisher.webp)