R E S E A R C H
Open Access
In vivo assessment of neuroinflammation in
progressive multiple sclerosis: a proof of
concept study with [
18
F]DPA714 PET
Marloes H. J. Hagens
1,2*, Sandeep V. Golla
3, Martijn T. Wijburg
1,2, Maqsood Yaqub
3, Dennis Heijtel
3,4,
Martijn D. Steenwijk
1,5, Patrick Schober
6, John J. P. Brevé
5, Robert C. Schuit
3, Tristan A. Reekie
7, Michael Kassiou
7,
Anne-Marie van Dam
1,5, Albert D. Windhorst
3, Joep Killestein
1,2, Frederik Barkhof
1,3,8, Bart N. M. van Berckel
3and Adriaan A. Lammertsma
3Abstract
Background:Over the past decades, positron emission tomography (PET) imaging has become an increasingly useful research modality in the field of multiple sclerosis (MS) research, as PET can visualise molecular processes, such as neuroinflammation, in vivo. The second generation PET radioligand [18F]DPA714 binds with high affinity to the 18-kDa translocator-protein (TSPO), which is mainly expressed on activated microglia. The aim of this proof of concept study was to evaluate this in vivo marker of neuroinflammation in primary and secondary progressive MS.
Methods:All subjects were genotyped for the rs6971 polymorphism within the TSPO gene, and low-affinity binders were excluded from participation in this study. Eight patients with progressive MS and seven age and
genetic binding status matched healthy controls underwent a 60 min dynamic PET scan using [18F]DPA714,
including both continuous on-line and manual arterial blood sampling to obtain metabolite-corrected arterial plasma input functions.
Results:The optimal model for quantification of [18F]DPA714 kinetics was a reversible two-tissue compartment model with additional blood volume parameter. For genetic high-affinity binders, a clear increase in binding potential was observed in patients with MS compared with age-matched controls. For both high and medium affinity binders, a further increase in binding potential was observed in T2 white matter lesions compared with non-lesional white matter. Volume of distribution, however, did not differentiate patients from healthy controls, as the large non-displaceable compartment of [18F]DPA714 masks its relatively small specific signal.
Conclusion:The TSPO radioligand [18F]DPA714 can reliably identify increased focal and diffuse neuroinflammation in progressive MS when using plasma input-derived binding potential, but observed differences were predominantly visible in high-affinity binders.
Keywords:[18F]DPA714, Multiple sclerosis, Neuroinflammation, Positron emission tomography, TSPO
* Correspondence:[email protected] 1
VUmc MS Center Amsterdam, VU University Medical Center, De Boelelaan 1117, 1081 HV Amsterdam, the Netherlands
2Department of Neurology, VU University Medical Center, De Boelelaan 1117,
1081 HV Amsterdam, the Netherlands
Full list of author information is available at the end of the article
Background
Conventional magnetic resonance imaging [1] has a central role in the diagnosis of multiple sclerosis (MS), based on its high sensitivity for identifying MS-specific demyelinat-ing lesions in the brain and spinal cord [2]. In patients with a relapsing-remitting disease course, radiological mon-itoring is based on the development of new MS le-sions on T2-weighted MRI and the presence of gadolinium-enhancing lesions on T1-weighted MRI, demonstrating disruption of the blood-brain barrier which is indicative of active neuroinflammation [3]. How-ever, these focal lesions as seen on MRI cannot fully ex-plain the neurological and cognitive deficits in patients with MS [4]. In addition, in both primary and second-ary progressive MS, neuroinflammation usually is not characterised by focal active demyelinating lesions [5]. Animal model and human post-mortem studies have identified a more diffuse and low-grade neuroinflam-mation behind an intact blood-brain barrier, not
depicted by conventional MRI [6, 7]. Consequently,
there is a need for novel imaging techniques.
Over the past decades, positron emission tomography (PET) imaging has become an increasingly useful research modality in the field of MS research, as PET can visualise molecular processes, such as neuroinflammation, in vivo [8, 9]. Specifically, the 18-kDa translocator-protein (TSPO) receptor, which is present on the mitochondrial membrane of microglial cells, with additional binding sites in monocytes, astrocytes and vascular endothelium, has shown potential as a target for imaging neuroinflamma-tion with PET [10]. Using the first-generation TSPO PET tracer (R)-[11C]PK11195, increased TSPO expression has been demonstrated in both MS lesions and normal appearing brain tissue of patients with MS, which was as-sociated with increased disability and disease progression in all phases of the disease [11–16]. Unfortunately, (R) -[11C]PK11195 suffers from poor brain penetration and high nonspecific binding in the brain, hindering accurate quantification [12]. Over the years, a large number of second-generation TSPO tracers have been developed, such as [11C]PBR28, [18F]PBR111, [11C]DPA713, [18F]GE180 and [18F]FEDAA1106. These novel tracers have an improved signal-to-noise ratio, resulting from lower lipo-philicity and therefore less non-specific binding to e.g. plasma proteins and improved blood-brain barrier passage [17–21]. It has been shown that the second-generation radioligand [18F]DPA714 provides increased bioavail-ability to brain tissue and indeed has a higher
signal-to-noise ratio [22, 23]. One limitation of
second-generation tracers, including [18F]DPA714, is their genetically determined binding affinity, resulting from a single nuclide polymorphism rs6971 within the TSPO gene. Approximately 50% of the general popula-tion is a genetically determined high-affinity binder
(HAB), 30–40% a medium-affinity binder (MAB) and
10–20% a low-affinity binder (LAB) [24].
To date, quantification of cerebral [18F]DPA714 bind-ing has been described in healthy controls [25] and in patients with Alzheimer’s disease [26], with both studies agreeing on a reversible two-tissue compartment model with blood volume parameter (2T4k_VB) as the optimal kinetic model. In addition, pseudo-quantitative analyses have been performed in post-stroke [27] and Alzheimer’s disease patients [28]. Moreover, the simplified reference tissue model, using cerebellar grey matter as a reference region, has been found to reliably assess binding poten-tial in Alzheimer’s disease [26]. However, the patho-physiology of MS violates the assumptions underlying reference tissue models: firstly, no single brain region can be used as a reference region in MS, as no region can be assumed to be devoid of specific TSPO binding, and secondly, the blood volume contribution is not neg-ligible throughout the MS brain due to potential disrup-tion of the blood-brain barrier [29]. The latter will also influence the kinetics of the tracer making reference tis-sue models unreliable [30].
The aim of this proof of concept study was to identify the optimal plasma input tracer kinetic model for char-acterising in vivo [18F]DPA714 kinetics in patients with primary and secondary progressive MS and to evaluate whether the kinetic parameters estimated from this model can be used to quantify TSPO binding in this pa-tient group.
Methods Participants
Patients diagnosed with primary or secondary progressive MS, according to the 2010 revisions of the McDonald cri-teria, and healthy controls were recruited from the MS Center, VU University Medical Center, Amsterdam, be-tween January 2015 and February 2016. All subjects were genotyped for the rs6971 polymorphism within the TSPO gene, which predicts binding affinity to the second
gener-ation TSPO tracers [24]. Only genetically high and
This study was approved by the Medical Ethics Review Board of the VU University Medical Center and was reg-istered under number 2014.356. All subjects gave written informed consent prior to participation.
MRI acquisition
MR imaging was performed on a 3 Tesla Ingenuity TF PET-MR system (Philips Medical Systems, Best, The Netherlands) on the same day as the PET-CT acquisition. MRI analysis included 3D T1 (repetition time 7.9 ms, echo time 4.5 ms, flip angle 8°, measured voxel size 1 × 1 × 1 mm3) for region of interest (ROI) definition and 3D T2 Fluid Attenuated Inversion Recovery (FLAIR) (repetition time 4800 ms, echo time 279 ms, inversion time 1650 ms, measured voxel size 0.9 × 0.9 × 1.1 mm3) for lesion seg-mentation. In patients, additional post-contrast 2D T1 se-quences (repetition time 600 ms, echo time 10 ms, measured voxel size 0.56 × 0.44 × 5 mm3) were acquired.
PET acquisition and reconstruction
Radiosynthesis of [18F]DPA714 was performed with an
in-house built automatic apparatus using procedures de-scribed previously [26]. PET scans were acquired on an In-genuity TF PET-CT scanner (Philips Medical Systems, Best, The Netherlands). Following a low-dose CT scan for attenuation correction, a bolus of 263 ± 13 MBq
[18F]DPA714, with a mean molar activity of 39 ±
20 GBq/μmol, was injected intravenously at 0.8 mL/sec with an automated infusion pump. Simultaneously, a 60-min PET dynamic emission scan was started. The emission scan was collected in list mode and rebinned into 19 frames (1 × 15, 3 × 5, 3 × 10, 4 × 60, 2 × 150, 2 × 300, 4 × 600 s). PET data were reconstructed to a final voxel size of 2 × 2 × 2 mm3using standard scanner soft-ware (BLOB-OS-TF), which incorporates standard correc-tions for attenuation, scatter and randoms.
Arterial blood was withdrawn continuously from the radial artery during the entire scan (using an automated pump for the first 5 min at 5 mL/min and from 5 to 60 min at 2.5 mL/min), and in addition, manual samples were collected at six time points (5, 10, 20, 30, 40 and
60 min) [31]. Continuous whole blood time activity
curves (TACs) were corrected for plasma to whole blood ratios, metabolites and time delay to obtain metabolite-corrected arterial plasma input functions.
Data analysis
MS white matter lesions were automatically segmented on the FLAIR and T1-weighted images using kNN-TTP [32]. Lesion filling of the T1-weighted image was obtained using LEAP [33], after which the filled T1-weighted image was registered to the PET scan using the VINCI software package [34, 35]. Grey matter, white matter and cerebral spinal fluid segmentation was performed automatically
using SPM8 implemented in PVElab [36]. ROIs were de-fined according to the Hammers template on the co-registered 3D T1 MRI [37]. Regional TACs were ex-tracted by superimposing the MR-derived ROIs onto the dynamic PET images. Volume weighted larger ROIs were also defined to assess the impact of ROI size on quantita-tive analyses. The lesion masks were subtracted from seg-mented white matter to define non-lesional white matter.
Kinetic modelling was performed using standard single-tissue (1T2k) together with reversible and irreversible two-tissue (2T3k and 2T4k) compartment models, both with and without blood volume parameter (VB) [38]. It has been hypothesised that some binding to the vascular endothelium exists for TSPO tracers, which can be char-acterised by slow irreversible binding (Kb) [39,40]. There-fore, a 2T4k_VB with an irreversible vascular binding component (1T1k) was also tested. Akaike information criterion (AIC) was used to compare model fits and to identify the optimal tracer kinetic model. Reliability of par-ameter estimates was determined by the percentage stand-ard deviation (%SD) of these estimates, with a cut-off of 25% for the generally robust K1, and 50% for the other pa-rameters. Estimates for K1, BPND (k3/k4),VTand Kbfrom the optimal model were used to assess group differences between patients and controls, and between genetically high and medium affinity binders (HAB and MAB).
Statistical analysis
Group differences were evaluated using the
Mann-Whitney U test in SPSS 22.0 (IBM Corp., Armonk,
NY). Due to the explorative nature of this proof of concept study, we did not correct for multiple com-parisons. To evaluate regional differences within the patient group, a Wilcoxon signed-rank test was used.
Results Demographics
Tracer kinetics
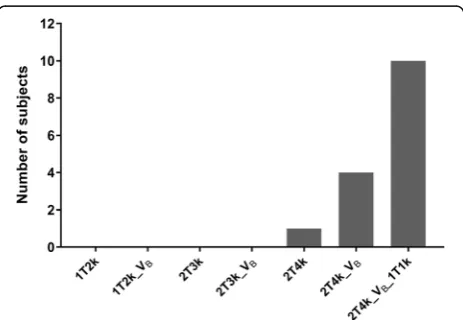
Based on the AIC, for the majority of subjects, the
pre-ferred model for quantification of [18F]DPA714 was
2T4k_VB_1T1k, see Fig.1. However, when evaluating re-liability of the parameter estimates, for a large number of regions, K1, BPNDand/or Kbcould not be reliably esti-mated, with either a high %SD or values touching the boundaries (see Additional files1 and 2). This was even
the case for subjects in which 2T4k_VB_1T1k was the
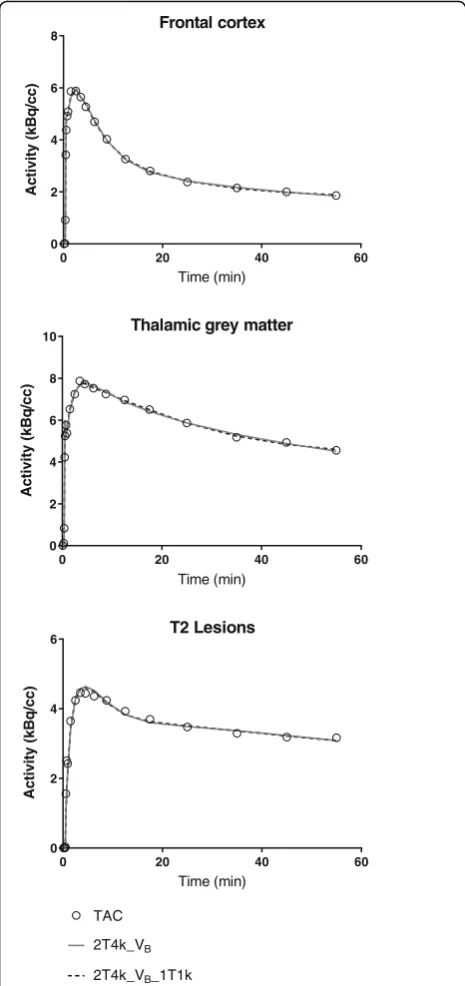
preferred model according to AIC, and it was true not only for small, but also for large ROIs. As model fits for
2T4k_VB_1T1k and 2T4k_VB were comparable (see
Fig.2) and 2T4k_VBdid result in reliable parameter esti-mates, the latter model was used for further analyses.
Volume of distribution
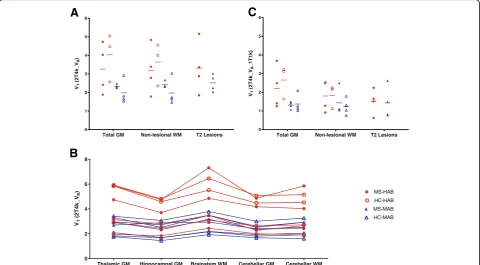
Mean regional VT values were on average 1.6 times
higher in HABs than in MABs (Fig. 3a). There was no
clear regional difference in VT between patients and
healthy controls for both HABs and MABs, as Fig.3a il-lustrates for the MS white matter lesions, non-lesional white matter and whole brain grey matter. Moreover, very limited within-subject variation inVTwas observed, even for the patients with MS. Figure 3billustrates that all subjects showed a similar distribution pattern forVT throughout the brain. In addition, a strong correlation betweenVTand K1was seen (Fig.4a), whereas no corre-lations were found betweenVTand both k2and k3/k4.
Finally, regional VT values for the 2T4k_VB_1T1k
model were evaluated (Fig. 3c). As expected, the added
vascular binding component decreased the VT. As the
regionalVTvalues for the two models were strongly cor-related for the large ROIs, there was also no difference in 2T4k_VB_1T1kVTbetween patients and healthy
con-trols for both the HABs and MABs (Fig. 3c). It is of
interest to know that also the correlation between VT and K1as seen for the simpler model remained the same for this model incorporating a vascular binding compo-nent (Fig.4b).
Binding potential
BPND (k3/k4) estimates for the larger ROIs were
reli-able using the 2T4k_VB model, as for almost all
re-gions, the standard deviation was well below 50% for both HABs and MABs (in both patients and con-trols), see Additional file 3. This indicates that plasma
input-derived BPND can be used as outcome
param-eter for these larger brain regions. Like VT, regional
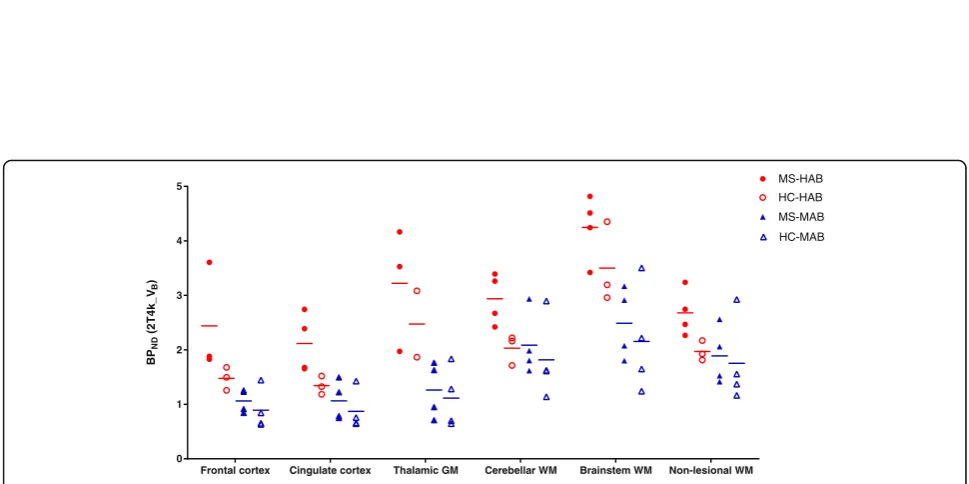
BPND was on average 1.6 times higher in HAB than
in MAB subjects (Fig. 5). For the regions shown in
Fig. 5, this difference was statistically significant for frontal cortex (p= 0.001), cingulate cortex (p= 0.006),
thalamic grey matter (p= 0.002) and brainstem white
matter (p= 0.004). In contrast to the VT findings,
re-gional BPND in both grey and white matter of HAB
patients was higher than in HAB healthy controls. This difference was statistically significant for cingu-late cortex (p= 0.034), cerebellar white matter (p= 0.034) and non-lesional white matter (p= 0.034). This difference was not observed in the MAB group.
Multiple sclerosis lesions
In both HAB and MAB patients with MS, MRI-defined T2 white matter lesions showed a significant increase in
BPND compared with non-lesional white matter of the
same subject (p= 0.017) (Fig. 6a). There was a strong correlation between the BPND values, except for one pa-tient. When including all the subjects, the correlation coefficient (R2) was 0.246 (slope 1.04 ± 0.744), excluding
Table 1Demographical characteristics
Patients (n= 8)
Healthy controls (n= 7)
Age, mean and SD (years) 53.1 ± 2.7 52.0 ± 4.1
Gender, male/female 3/5 3/4
Genotype, HAB/MAB 4/4 3/4
Subtype MS, PPMS/SPMS 5/3 N/A
Disease duration, mean and SD (years) 13.1 ± 9.4 N/A
EDSS, median and range 5.0 (4.0–6.0) N/A
PASAT-3 score, mean and SD 45.8 ± 10.8 49.6 ± 12.5
SDMT score, mean and SD 44.0 ± 11.9 55.0 ± 13.5
T2 lesion volume, median and range (cm3
)
14.3 (3.6–60.6) N/A
Abbreviations:EDSSExpanded Disability Status Scale,HABgenetic high-affinity binder,MABgenetic medium-affinity binder,PASATPaced Auditory Serial Addition Test,PPMSprimary progressive multiple sclerosis,SDMTSymbol Digit Modalities Test,SPMSsecondary progressive multiple sclerosis
the one outlier improved the R2 to 0.861 (slope 2.39 ±
0.429). For VT, values were similar for lesions and
non-lesional white matter of each MS patient, with an
R2
of 0.844 and slope 1.02 ± 0.178 (Fig.6b).
Discussion
This proof of concept study in patients with progressive MS showed that quantitative assessment of the second-generation TSPO radiotracer [18F]DPA714 can identify an increased binding potential not only in MS-specific lesions, but for HAB patients also in grey matter and non-lesional white matter. Although the results from this study need to be replicated in a larger cohort, they suggest that [18F]DPA714-PET could be used as an in vivo imaging technique for measuring neuroinflamma-tion in progressive MS.
Neuroinflammation in MS is characterised by complex and dynamic processes, including the activation of micro-glia [6,7]. This is most distinct in active MS lesions, iden-tified by gadolinium enhancement on T1-weighted MRI, and chronic MS lesions as seen on T2-weighted MRI [3]. In line with this, an increase in [18F]DPA714 BPND was seen in the focal lesions compared with non-lesional white matter for all patients except one, independent of the pa-tient’s genetic binding status (HAB or MAB). As MRI-de-fined lesions for these patients with progressive MS were almost exclusively non-enhancing chronic lesions, this in-crease TSPO binding indicates that these are chronic ac-tive lesions [41]. The classification of different stages of MS lesions, such as chronic active and chronic inactive le-sions, results from pathological studies. Current conven-tional MRI techniques can identify active inflammatory lesions, with the use of gadolinium-enhanced T1-weighted
scans; however, they cannot further differentiate
non-enhancing lesions. Results from the present study suggest that [18F]DPA714 PET can identify different stages of MS lesions in vivo, which could be clinically relevant, e.g. in relation to treatment options and monitoring.
Even more importantly, increased [18F]DPA714 BPND was also seen in non-lesional brain parenchyma, both in white and grey matter, for HAB patients. In relapsing-re-mitting MS, neuroinflammation is evident from the de-velopment of new focal (gadolinium enhancing) lesions, but in primary and secondary progressive MS,
neuroin-flammation is often more diffuse and low-grade [5].
Therefore, it is highly relevant that a biomarker of neu-roinflammation in MS demonstrates not only focal changes, but also more diffuse pathology. As [18
F]DPA714 BPND can identify both, this marker of TSPO expression can be used as a biomarker to further investigate neuroin-flammation in MS in vivo.
As plasma input-derived BPND was estimated reliably
using the 2T4k_VB model, BPND should be preferred
over the less specific VT. As VT contains both free, non-specific and specific signals, it is an inferior
out-come measured compared with BPND (=k3/k4), which
only reflects specific binding. Contrary to BPNDanalysis,
group analysis using VTshowed no difference between
patients and controls for both HAB and MAB subjects.
0 20 40 60
0 2 4 6
8 Frontal cortex
Time (min)
Activity
(kBq
/cc)
0 20 40 60
0 2 4 6 8
10 Thalamic grey matter
Time (min)
Activity
(kBq
/cc)
0 20 40 60
0 2 4
6 T2 Lesions
Time (min)
Activity
(kBq/cc)
TAC
2T4k_VB
2T4k_VB_1T1k
Fig. 2Model fit comparisons. Representative model fits for the frontal cortex of a medium affinity binding healthy control, the thalamic grey matter of a high-affinity binding MS patient and the T2 lesions of a medium-affinity binding MS patient. The open circles represent the measured time-activity curves (TAC) and the solid grey and dashed black lines represent the fits for the reversible two-tissue compartment model without and with vascular binding component (2T4k_VB
In addition,VTappeared to be almost similar between different ROIs within each subject, resulting from a nearly homogeneous distribution of DPA714 throughout the brain of an individual. AsVTincludes the large non-displaceable compartment of [18F]DPA714, this effect-ively obscured any changes in the disease-specific neu-roinflammatory signal. This is also seen in the analysis of the T2 MS lesions in Fig. 6, illustrating that the
in-crease in specific [18F]DPA714 signal in MS lesions
depicted by BPND is diluted in theVTvalues due to the non-displaceable component.
Interestingly,VT was strongly correlated with K1. Al-though a change in K1can be related to
neuroinflamma-tion, as K1 is a function of blood flow and vascular
permeability, a correlation betweenVTand K1was unex-pected as VT should be independent of K1. A possible explanation for this finding could be related to binding of [18F]DPA714 to the endothelium of blood vessels in the brain [42, 43]. However, the model incorporating a vascular binding component still provided correlated K1 andVTvalues (Fig.4b).
Although the 2T4k_VB_1T1k model was preferred
ac-cording to AIC, it decreased the reliability of the
param-eter estimates compared with the simpler 2T4k_VB
model. Moreover, Kbestimates were inaccurate for many regions, even in subjects where this model was pre-ferred. A proposed method of decreasing the number of parameters, attempting to increase their reliability, is
fix-ing VB to 5%. However, due to the large inter- and
intra-subject variation inVB, this seems inappropriate. Although we used the simpler model in our analysis, the results are similar, as the regional VTvalues for the two models correlate.
In line with other TSPO studies, assessment of the rs6971 polymorphism defined binding status is important also for quantitative analysis of [18F]DPA714. Although observed differences between HABs and MABs were smaller than those observed for some other second-gener-ation TSPO tracers [24], both mean VTand BPND values were on average 1.6 times higher for HABs compared with MABs for the different brain regions. This indicates that the selection of subjects based on binding status is essen-tial. Furthermore, group differences between HABs were
only observed when using BPND, suggesting that
[18F]DPA714 in MS could best be studied in HABs only. Due to basal expression of TSPO, the contrast for [18F]DPA714 appears to be too low for MAB subjects to identify patients from controls. Strikingly, the increase in Total GM Non-lesional WM T2 Lesions
0 1 2 3 4 5 6
VT
(2T4k_V
B
)
Total GM Non-lesional WM T2 Lesions 0
1 2 3 4 5 6
VT
(2T4k_
VB
_1T1k)
Thalamic GM Hippocampal GM Brainstem WM Cerebellar GM Cerebellar WM 0
2 4 6 8
VT
(2T4k_V
B
) MS-HAB
HC-HAB
MS-MAB
HC-MAB
A
B
C
Fig. 3Volume of distribution.aVolume of distribution (VT) for total grey matter non-lesional white matter (WM) and T2 defined white matter lesions
for the reversible two-tissue compartment model (2T4k_VB). High-affinity binding (HAB) subjects in red have a 1.5 to 2-fold higherVTthan medium
affinity binding (MAB) subjects in blue. No difference inVTwas seen between multiple sclerosis patients (MS; closed symbols) and healthy controls (HC;
open symbols) for both HABs and MABs.bVTacross various regions of all patients and controls. The intra-subject variation appears to be much smaller
than the inter-subject variation.cThe reversible two-tissue compartment model with vascular binding component (2T4k_VB_1T1k) also identified an
increase inVTfor HAB subjects compared with MAB subjects, but no difference in mean regionalVTfor patients compared to controls for either HABs
0.0 0.2 0.4 0.6 0
2 4 6
Total grey matter
K1 (2T4k_VB)
VT
(2T4k_V
B
)
0.0 0.2 0.4 0.6
0 2 4 6
Non-lesional white matter
K1 (2T4k_VB)
VT
(2T4k_
VB
) MS-HAB
MS-MAB HC-HAB
HC-MAB
0.0 0.2 0.4 0.6
0 2 4 6
Total grey matter
K1 (2T4k_VB_1T1k)
VT
(2T4k_V
B
_1T1k)
0.0 0.2 0.4 0.6
0 2 4 6
Non-lesional white matter
K1 (2T4k_VB_1T1k)
VT
(2T4k_
VB
_1T1k)
MS-HAB
MS-MAB HC-HAB
HC-MAB
A
B
Fig. 4Correlation forVTand K1. For both the reversible two-tissue compartment modelawithout andbwith vascular binding component
(2T4k_VBand 2T4k_VB_1T1k), there was a strong correlation betweenVTandK1in both grey and white matter, independent of binding status
Frontal cortex Cingulate cortex Thalamic GM Cerebellar WM Brainstem WM Non-lesional WM 0
1 2 3 4 5
BP
ND
(2T4k_V
B
)
HC-MAB MS-HAB
HC-HAB
MS-MAB
Fig. 5Binding potential for different regions of interest. For high-affinity binders, a higher binding potential (BPND) was seen in multiple sclerosis
BPNDin MS lesions was also seen in MAB patients, indi-cating that [18F]DPA714 can identify neuroinflammation in MAB subjects in MS lesions, but due to high non-spe-cific binding of the tracer, it is not evident in other ROIs with more low-grade neuroinflammation. As only ap-proximately half of the general population is HAB, this is a limitation of second-generation TSPO studies.
This study is limited mainly by its small sample size. Because of the limited number of subjects in each group, only limited statistical analysis was performed. Neverthe-less, based on the promising results of this pilot project, further studies using a larger sample size are warranted. This would allow for evaluation of possible correlations between [18F]DPA714 BPNDand clinical outcome scores, such as Expanded Disability Status Scale and Symbol Digit Modalities Test. Finally, assessment of a possible relationship with MRI-derived outcome measures, such as atrophy of cortical and deep grey matter structures, would be of great interest in understanding progressive MS.
Conclusions
Plasma input-derived BPND can reliably be estimated for [18F]DPA714, and a 2T4k_VBmodel [18F]DPA714 BPND can identify increased neuroinflammation in both grey and non-lesional white matter of patients with progres-sive MS, with a further increase in T2 MS lesions. As these differences cannot be seen usingVT due to
inclu-sion of non-displaceable uptake, BPND is recommended
for analysis of [18F]DPA714 studies in patients with MS. Similar to other second-generation TSPO tracers, the ef-fect of genetically defined binding status limits the clin-ical use of [18F]DPA714. Nevertheless, further studies are warranted to confirm the results of the present proof of concept study.
Additional files
Additional file 1:2T4k_VB_1T1k - Percentage standard deviation for
BPND(k3/k4). Additional file provides the percentage of standard deviation
for the for 2T4k_VB_1T1k BPND(k3/k4) for the different large regions of
interest. (PDF 106 kb)
Additional file 2:2T4k_VB_1T1k - Percentage standard deviation for kb.
Additional file provides the percentage of standard deviation for the for 2T4k_VB_1T1k kbfor the different large regions of interest. (PDF 106 kb)
Additional file 3:2T4k_VB- Percentage standard deviation for BPND(k3/
k4). Additional file provides the percentage of standard deviation for the
arterial input-derived BPND(k3/k4) for the different large regions of
inter-est. (PDF 106 kb)
Abbreviations
1T2k:Single-tissue compartment model; 2T3k: Irreversible two-tissue compartment model; 2T4k: Reversible two-tissue compartment model; BPND: Binding potential (k3/k4); FLAIR: Fluid Attenuated Inversion Recovery;
HAB: High-affinity binder; kb: Vascular binding component; LAB: Low-affinity
binder; MAB: Medium-affinity binder; MRI: Magnetic resonance imaging; MS: Multiple sclerosis; PET: Positron emission tomography; ROI: Region of interest; TAC: Time activity curve; TSPO: 18-kDa translocator-protein;VB: Blood
volume parameter;VT: Volume of distribution
Acknowledgements
The authors would like to thank Mattia Veronese (Department of Neuroimaging, King’s College London) for his help on the implementation of the kinetic model including a vascular binding component.
Funding
This research has received funding from Amsterdam Neuroscience and the Dutch MS Research Foundation (programme grant 14-358e). Both organisations had no role in the design of the study or the collection, analysis and interpretation of data.
Availability of data and materials
The datasets used and analysed during the current study are available from the corresponding author on reasonable request.
Authors’contributions
The study was designed by MH, AMvD, JK, ADW, FB and BvB. Tracer development was done by TAR, MK and ADW. Data were collected by MH, MTW, PS and JB. Analysis of the data was performed by MH, SVG, MY, DH, MDS, RCS and AAL and data were interpreted by MH, SVG, MY, BvB and AAL. The manuscript was drafted by MH and SVG. All authors read and approved the final manuscript.
0 2 4 6 8
0 2 4 6 8
BPND (2T4k_VB) Non-lesional white matter
BP
ND
(2T4k_
VB
)
L
esions
0 2 4 6
0 2 4 6
VT (2T4k_VB) Non-lesional white matter
VT
(2T4k_
VB
)
Lesions
MS-HAB MS-MAB Line of identity
A
B
Fig. 6Kinetic parameter values for the multiple sclerosis lesions. Independent of binding status,abinding potential (BPND) identified increased
[18F]DPA714 binding in MS-specific brain lesions compared with non-lesional white matter in the same patients,bwhereas volume of distribution
Ethics approval and consent to participate
This study was approved by the Medical Ethics Review Board of the VU University Medical Center and was registered under the number 2014.356. All subjects gave written informed consent prior to participation.
Consent for publication Not applicable.
Competing interests
DH is employed by Philips Healthcare. JK has accepted speaker and consultancy fees from Merck-Serono, Teva, Biogen, Genzyme, Roche and Novartis. FB is supported by the NIHR UCLH Biomedical Research Centre and serves as a consultant for Bayer-Schering Pharma, Sanofi-Aventis, Genzyme, Biogen-Idec, Teva, Novartis, Roche, Synthon BV and Jansen Research. All other authors declare that they have no competing interests.
Publisher’s Note
Springer Nature remains neutral with regard to jurisdictional claims in published maps and institutional affiliations.
Author details 1
VUmc MS Center Amsterdam, VU University Medical Center, De Boelelaan 1117, 1081 HV Amsterdam, the Netherlands.2Department of Neurology, VU University Medical Center, De Boelelaan 1117, 1081 HV Amsterdam, the Netherlands.3Department of Radiology and Nuclear Medicine, VU University Medical Center Amsterdam, De Boelelaan 1117, 1081 HV Amsterdam, the Netherlands.4Philips Healthcare, Best, the Netherlands, Veenpluis 4, 5684 PC Best, the Netherlands.5Department of Anatomy and Neurosciences, VU University Medical Center Amsterdam, De Boelelaan 1117, 1081 HV Amsterdam, the Netherlands.6Department of Anaesthesiology, VU University Medical Center Amsterdam, De Boelelaan 1117, 1081 HV Amsterdam, the Netherlands.7School of Chemistry, University of Sydney, F11, Eastern Ave, Sydney, NSW 2006, Australia.8Institutes of Neurology and Healthcare Engineering, UCL Institute of Neurology, Queen Square, London WC1N 3BG, UK.
Received: 15 June 2018 Accepted: 30 October 2018
References
1. O'Connor P, Comi G, Freedman MS, Miller AE, Kappos L, Bouchard JP, et al. Long-term safety and efficacy of teriflunomide: nine-year follow-up of the randomized TEMSO study. Neurology. 2016;86:10.
2. Rovira A, Wattjes MP, Tintore M, Tur C, Yousry TA, Sormani MP, et al. Evidence-based guidelines: MAGNIMS consensus guidelines on the use of MRI in multiple sclerosis-clinical implementation in the diagnostic process. Nat Rev Neurol. 2015;11:8.
3. Wattjes MP, Rovira A, Miller D, Yousry TA, Sormani MP, de Stefano MP, et al. Evidence-based guidelines: MAGNIMS consensus guidelines on the use of MRI in multiple sclerosis--establishing disease prognosis and monitoring patients. Nat Rev Neurol. 2015;11:10.
4. Barkhof F. The clinico-radiological paradox in multiple sclerosis revisited. Curr Opin Neurol. 2002;15:3.
5. Lassmann H, van Horssen J, Mahad D. Progressive multiple sclerosis: pathology and pathogenesis. Nat Rev Neurol. 2012;8:11.
6. Hemmer B, Kerschensteiner M, Korn T. Role of the innate and adaptive immune responses in the course of multiple sclerosis. Lancet Neurol. 2015;14:4.
7. Mahad DH, Trapp BD, Lassmann H. Pathological mechanisms in progressive multiple sclerosis. Lancet Neurol. 2015;14:2.
8. Airas L, Rissanen E, Rinne J. Imaging of microglial activation in MS using PET: research use and potential future clinical application. Mult Scler. 2017;23:4.
9. Hagens M, van Berckel B, Barkhof F. Novel MRI and PET markers of neuroinflammation in multiple sclerosis. Curr Opin Neurol. 2016;29:3. 10. Cumming P, Burgher B, Patkar O, Breakspear M, Vasdev N, Thomas P, et al.
Sifting through the surfeit of neuroinflammation tracers. J Cereb Blood Flow Metab. 2018;38:2.
11. Vowinckel E, Reutens D, Becher B, Verge G, Evans A, Owens T, et al. PK11195 binding to the peripheral benzodiazepine receptor as a marker of microglia
activation in multiple sclerosis and experimental autoimmune encephalomyelitis. J Neurosci Res. 1997;50:2.
12. Banati RB, Newcombe J, Gunn RN, Cagnin A, Turkheimer F, Heppner F, et al. The peripheral benzodiazepine binding site in the brain in multiple sclerosis: quantitative in vivo imaging of microglia as a measure of disease activity. Brain. 2000;123(Pt 11):2321–37.
13. Politis M, Giannetti P, Su P, Turkheimer F, Keihaninejad S, Wu K, et al. Increased PK11195 PET binding in the cortex of patients with MS correlates with disability. Neurology. 2012;79:6.
14. Rissanen E, Tuisku J, Rokka J, Paavilainen T, Parkkola R, Rinne JO, et al. In vivo detection of diffuse inflammation in secondary progressive multiple sclerosis using PET imaging and the radioligand11C-PK11195. J Nucl Med. 2014;55:6.
15. Giannetti P, Politis M, Su P, Turkheimer F, Malik O, Keihaninejad S, et al. Microglia activation in multiple sclerosis black holes predicts outcome in progressive patients: an in vivo [11C](R)-PK11195-PET pilot study. Neurobiol
Dis. 2014;65:203–10.
16. Giannetti P, Politis M, Su P, Turkheimer FE, Malik O, Keihaninejad S, et al. Increased PK11195-PET binding in normal-appearing white matter in clinically isolated syndrome. Brain. 2015;138:Pt 1.
17. Boutin H, Chauveau F, Thominiaux C, Gregoire MC, James ML, Trebossen R, et al. 11C-DPA-713: a novel peripheral benzodiazepine receptor PET ligand for in vivo imaging of neuroinflammation. J Nucl Med. 2007;48:4. 18. Fookes CJ, Pham TQ, Mattner F, Greguric I, Loc'h C, Liu X, et al. Synthesis
and biological evaluation of substituted [18F]imidazo[1,2-a]pyridines and
[18F]pyrazolo[1,5-a]pyrimidines for the study of the peripheral
benzodiazepine receptor using positron emission tomography. J Med Chem. 2008;51:13.
19. Kreisl WC, Fujita M, Fujimura Y, Kimura N, Jenko KJ, Kannan P, et al. Comparison of [11C]-(R)-PK 11195 and [11C]PBR28, two radioligands for
translocator protein (18 kDa) in human and monkey: implications for positron emission tomographic imaging of this inflammation biomarker. NeuroImage. 2010;49:4.
20. Wadsworth H, Jones PA, Chau WF, Durrant C, Fouladi N, Passmore J, et al. [18F]GE-180: a novel fluorine-18 labelled PET tracer for imaging Translocator protein 18 kDa (TSPO). Bioorg Med Chem Lett. 2012;22:3.
21. Zhang MR, Maeda J, Ogawa M, Noguchi J, Ito T, Yoshida Y, et al. Development of a new radioligand, N-(5-fluoro-2-phenoxyphenyl)-N-(2-[18F]fluoroethyl-5-methoxybenzyl)acetamide, for pet imaging of
peripheral benzodiazepine receptor in primate brain. J Med Chem. 2004;47:9.
22. James ML, Fulton RR, Vercoullie J, Henderson DJ, Garreau L, Chalon S, et al. DPA-714, a new translocator protein-specific ligand: synthesis, radiofluorination, and pharmacologic characterization. J Nucl Med. 2008;49:5.
23. Peyronneau MA, Saba W, Goutal S, Damont A, Dolle F, Kassiou M, et al. Metabolism and quantification of [18F]DPA-714, a new TSPO positron emission tomography radioligand. Drug Metab Dispos. 2013;41:1. 24. Owen DR, Gunn RN, Rabiner EA, Bennacef I, Fujita M, Kreisl WC, et al.
Mixed-affinity binding in humans with 18-kDa translocator protein ligands. J Nucl Med. 2011;52:1.
25. Lavisse S, Garcia-Lorenzo D, Peyronneau MA, Bodini B, Thiriez C, Kuhnast B, et al. Optimized quantification of translocator protein radioligand18
F-DPA-714 uptake in the brain of genotyped healthy volunteers. J Nucl Med. 2015;56:7.
26. Golla SS, Boellaard R, Oikonen V, Hoffmann A, van Berckel BN, Windhorst AD, et al. Quantification of [18F]DPA-714 binding in the human brain: initial
studies in healthy controls and Alzheimer’s disease patients. J Cereb Blood Flow Metab. 2015;35:5.
27. Ribeiro MJ, Vercouillie J, Debiais S, Cottier JP, Bonnaud I, Camus V, et al. Could18F-DPA-714 PET imaging be interesting to use in the early
post-stroke period? EJNMMI Res. 2014;4:28.
28. Hamelin L, Lagarde J, Dorothee G, Leroy C, Labit M, Comley RA, et al. Early and protective microglial activation in Alzheimer’s disease: a prospective study using18F-DPA-714 PET imaging. Brain. 2016;139:Pt 4.
29. Salinas CA, Searle GE, Gunn RN. The simplified reference tissue model: model assumption violations and their impact on binding potential. J Cereb Blood Flow Metab. 2015;35:2.
30. Folkersma H, Boellaard R, Vandertop WP, Kloet RW, Lubberink M, Lammertsma AA, et al. Reference tissue models and blood-brain barrier disruption: lessons from (R)-[11C]PK11195 in traumatic brain injury. J Nucl
31. Boellaard R, van Lingen A, van Balen SC, Hoving BG, Lammertsma AA. Characteristics of a new fully programmable blood sampling device for monitoring blood radioactivity during PET. Eur J Nucl Med. 2001;28:1. 32. Steenwijk MD, Pouwels PJ, Daams M, van Dalen JW, Caan MW, Richard E,
et al. Accurate white matter lesion segmentation by k nearest neighbor classification with tissue type priors (kNN-TTPs). Neuroimage Clin. 2013;3: 462–9.
33. Chard DT, Jackson JS, Miller DH, Wheeler-Kingshott CA. Reducing the impact of white matter lesions on automated measures of brain gray and white matter volumes. J Magn Reson Imaging. 2010;32:1.
34. Cizek J, Herholz K, Vollmar S, Schrader R, Klein J, Heiss WD. Fast and robust registration of PET and MR images of human brain. NeuroImage. 2004;22:1. 35. Vollmar S, Cizek J, Sue J, Klein A, Jacbos K, Herholz K. VINCI-volume imaging
in neurological research, co-registration and ROIs included. Forschung und wissenschaftliches Rechnen 2003 (Kremer K, Macho V, eds); 2004. 36. Svarer C, Madsen K, Hasselbalch SG, Pinborg LH, Haugbol S, Frokjaer VG,
et al. MR-based automatic delineation of volumes of interest in human brain PET images using probability maps. NeuroImage. 2005;24:4. 37. Hammers A, Allom R, Koepp MJ, Free SL, Myers R, Lemieux L, et al.
Three-dimensional maximum probability atlas of the human brain, with particular reference to the temporal lobe. Hum Brain Mapp. 2003;19:4.
38. Frisoni GB, Boccardi M, Barkhof F, Blennow K, Cappa S, Chiotis K, et al. Strategic roadmap for an early diagnosis of Alzheimer’s disease based on biomarkers. Lancet Neurol. 2017;16:8.
39. Rizzo G, Veronese M, Tonietto M, Zanotti-Fregonara P, Turkheimer FE, Bertoldo A. Kinetic modeling without accounting for the vascular component impairs the quantification of [11C]PBR28 brain PET data. J Cereb Blood Flow
Metab. 2014;34:6.
40. Wimberley C, Lavisse S, Brulon V, Peyronneau MA, Leroy C, Bodini B, et al. Impact of endothelial TSPO on the quantification of 18F-DPA-714. J Nucl Med. 2018;59:307–14.
41. van der Valk P, De Groot CJ. Staging of multiple sclerosis (MS) lesions: pathology of the time frame of MS. Neuropathol Appl Neurobiol. 2000;26:1. 42. Tomasi G, Edison P, Bertoldo A, Roncaroli F, Singh P, Gerhard A, et al. Novel reference region model reveals increased microglial and reduced vascular binding of11C-(R)-PK11195 in patients with Alzheimer’s disease. J Nucl Med. 2008;49:8.
43. Turkheimer FE, Edison P, Pavese N, Roncaroli F, Anderson AN, Hammers A, et al. Reference and target region modeling of [11C]-(R)-PK11195 brain
![Fig. 6 Kinetic parameter values for the multiple sclerosis lesions. Independent of binding status,( a binding potential (BPND) identified increased[18F]DPA714 binding in MS-specific brain lesions compared with non-lesional white matter in the same patients, b whereas volume of distributionVT) did not depict this difference](https://thumb-us.123doks.com/thumbv2/123dok_us/9047063.1897366/8.595.60.539.88.242/parameter-sclerosis-independent-potential-identified-increased-distributionvt-difference.webp)
