R E S E A R C H
Open Access
Predicting involvement of polycomb repressive
complex 2 in direct conversion of mouse
fibroblasts into induced neural stem cells
Moein Yaqubi
1†, Abdulshakour Mohammadnia
2†and Hossein Fallahi
3,4*Abstract
Introduction:Mouse fibroblasts could be directly converted into induced neural stem cells (iNSCs), by introducing a set of known transcription factors (TFs). This process, known as direct reprogramming, is an alternative source of NSCs production for cell therapy applications, hence, more common sources for such cells including embryonic stem cell (ESCs) and induced pluripotent stem cell (iPSCs) are also in use. Despite their importance, the exact role of different TFs involved in the conversion of fibroblasts into iNSCs and the interactions between these factors has not been studied.
Methods:Here, we have used available microarray data to construct a gene regulatory network to understand the dynamic of regulatory interactions during this conversion. We have implemented other types of data such as information regarding TFs binding sites and valid protein-protein interactions to improve the network reliability. The network contained 1857 differentially expressed (DE) genes, linked by11054 interactions. The most important TFs identified based on topology analysis of the network. Furthermore, in selecting such TFs, we have also considered their role in the regulation of nervous system development.
Results:Based on these analyses, we found thatEzh2,Jarid2,Mtf2,Nanog,Pou5f1,Sall4,Smarca4,Sox2,Suz12, and Tcf3are the main regulators of direct conversion of mouse fibroblasts into iNSCs. Because, members of the polycomb repressive complex 2 (PRC2) were present in the most effective TFs’list, we have concluded that this complex is one of the major factors in this conversion. Additionally, gene expression profiling of iNSCs, obtained from a different data sets, showed thatSox2andEzh2are two main regulators of the direct reprogramming process.
Conclusions:Our results provide an insight into molecular events that occur during direct reprogramming of fibroblasts into iNSCs. This information could be useful in simplifying the production of iNSCs, by reducing the number of required factors, for use in regenerative medicine.
Introduction
Embryonic stem cells (ESCs) and induced pluripotent stem cells (iPSCs) are the two main sources of induced neural stem cells (iNSCs) generation. Recently direct reprogramming has been introduced as an alternative approach to produce NSCs for use in regenerative medi-cine. In this approach, over-expression of a set of
pre-defined transcription factors (TFs) reprograms fully differentiated fibroblasts into neural stem cells (NSCs) and neurons. Production of iPSCs from somatic cells and their subsequent differentiation into NSCs is a ra-ther slow process (one or two months for each step). Direct reprogramming, on the other hand, is a much faster approach to generate NSCs. This process involves only one step, while generating NSCs via iPSCs requires first reprogramming and then differentiation. In addition, cells produced via ESCs and iPSCs show different degrees of genetic instability and harbor cancer development risks [1].
* Correspondence:[email protected]
†Equal contributors
3Department of Biology, School of Science, Razi University, Kermanshah, Iran 4
Medical Biology Research Center, Kermanshah University of Medical Sciences, Kermanshah, Iran
Full list of author information is available at the end of the article
Recently, several groups have produced NSCs and neurons from terminally differentiated cells, including fibroblasts [2-9], sertoli cells [10], and astrocytes [11]. Interestingly, neurons were also produced from fibro-blasts [12-19] by introducing certain types of TFs or a combination of TFs and miRNA [18,19]. Two different approaches have been successfully used for direct repro-gramming. One uses four well-known TFs: OCT4, KLF4, SOX2, and MYC similar to Yamanaka’s method, in pro-duction of iPSCs. In this procedure, additional factors are required for generation of NSCs and neurons, which should be applied before iPSCs clonal formation [20]. In the second approach, direct conversion of fibroblasts into NSCs was achieved by introducing a list of alternative TFs. Systematic elimination of TFs resulted in identifica-tion of a minimum set of TFs that are essential for suc-cessful direct conversion in this method [20].
Thus, previous findings highlight the role of TFs in differentiation, fate specification, and direct reprogram-ming. Fortunately, computational methods are able to predict the most important TFs involved in such cellular processes [21,22]. To this aim, a gene regulatory network has been constructed for mouse ESCs using expression and TFs binding data [23]. However, the dynamics of the gene regulatory network during direct conversion of fi-broblasts into iNSCs has not been studied.
Here, we have constructed a gene regulatory network for conversion of mouse fibroblasts into iNSCs and in-vestigated the role of differentially expressed TFs in this process. We have used publicly available data obtained from wet-lab experiments, including microarray expres-sion profiles, information regarding TFs binding sites and valid protein-protein interactions to construct our gene regulatory network. Statistical analysis of this net-work unveiled a central role for several TFs. Finally, we have extracted and introduced the most important TFs that are involved in regulating the conversion of fibro-blasts into iNSCs.
Methods
Microarray availability and analysis
Microarray data for direct conversion of adult mouse fibro-blasts into iNSCs was obtained from the Gene Expression Omnibus (GEO) using GSE31598 accession number [2]. Raw data were normalized using the robust multi-array averaging (RMA) algorithm in the FlexArray [24]. Differen-tially expressed (DE) genes were detected by comparing the gene expression profiles of mouse fibroblasts and iNSCs, using a fold change algorithm implemented in the FlexArray software [25]. A very restrictive fold change = 3 was set as the threshold for detection of DE genes, in order to eliminate background noises. Annotation of the probe sets was achieved using annotation file number HG-U133_Plus_2.na33.annot, which was obtained from [26].
The original data were enriched by incorporating gene expression profiling obtained from independent but re-lated studies conducted by Thieret al. [3], Han et al. [4], and Ring et al. [5] (Table 1). Mouse annotation files, MouseWG-6_V2_0_R3_11278593_A, MouseRef-8_V2_0_ R3_11278551_A, and MoGene-1_0-st-v1.na34.mm10.pro-beset were used for annotating the data of Thier et al., Hanet al., and Ringet al., respectively.
In addition to direct conversion of fibroblasts to NSCs, we compared expression profiles of converting astrocytes and neurons to NSCs to find the role of identified TFs in cell fate specification. To this aim, microarray data sets obtained from Denget al., [27], Kimet al., [28] and Cahoy et al. [29] were used (Additional file 1: Table S1).
Functional classification of DE genes
Affected cellular pathways and processes were identified using DAVID (Databases for Annotation, Visualization and Integrated Discovery) [30,31] by browsing the DE genes obtained from comparison of iNSCs and fibroblasts in this database. Altered functional clusters were ranked according to the enrichment scores returned by DAVID. Enrichment scores higher than 1.3 (P-value <0.05) were considered as highly significant.
Construction of TFs regulatory network
The binding sites of TFs on the genomic DNA were ex-tracted from the chromatin immunoprecipitation (ChIP) Enrichment Analysis (ChEA) database, the primary depository information for chip, seq, ChIP-PET, and DamID experimental data. The manually cu-rated section of this database accommodates 458,471 TF-target interactions for 200 TFs. The DE gene list, resulting from microarray analysis, was used as the query list for the ChEA website [32]. Resulting TFs with aP-value of 0.05 or lower and a two-fold change in ex-pression were then considered as differentially expressed TFs (DE-TFs). Next, data regarding proteprotein in-teractions for the DE-TFs list were obtained from the BioGRID database [33]. The most significant protein-protein interactions were identified using the expression profiles of the interacting counterparts. In construction of the TFs regulatory network and TFs protein-protein interaction network only valid and significant protein-protein interactions have been used. Finally, data obtained for TFs-regulatory sequences, protein-protein interac-tions, and expression profiles were combined to construct a holistic TFs regulatory network in Cytoscape [34].
Identification of affected biological pathways during direct programming
To identify the most significant biological processes af-fected in the transition of fibroblasts to iNSCs, one could look at the number of DE genes in each process.
Here, we have used two plugins of Cytoscape, namely ClueGO and CluePedia, to find enriched biological path-ways in the network. A two-sided hyper-geometric ap-proach (Enrichment versus Depletion) was used as a statistical test to calculate the enrichment score and P -value using the Bonferroni step down method, implanted in the ClueGO and CluePedia plugins [35,36].
Evaluation of network by motif analysis
In any network, motifs are a small group of interacting nodes that occur in higher number in the regulatory net-works compared to that of random netnet-works. To find three-node motifs in the directed (where direction of interaction is determined) and colored (where upregulated and downregulated genes are specified) regulatory net-work, we used fast network motif detection (FANMOD) software. The significance of any identified motif was eval-uated by its z-score and P-value. This tool calculates z -score through computation of the differences between motif occurrence in the regulatory network and that of random networks (the program by default produces 1,000 random networks using the nodes) [37,38].
Identification of the central genes and modules in the regulatory network
Central genes in the constructed gene regulatory network were identified using CentiScaPe, a plugin of the Cytoscape software [39]. A set of network related parameters, known as centrality parameters, including degree of connectivity, eccentricity, closeness, betweenness, stress, and centroid were measured. The most important genes were ranked based on the results obtained from these parameters and, consequently, the most central TFs regulating such genes were identified.
The TFs interaction network was also subjected to this analysis using the MCODE plug-in of the Cytoscape [40]. From such analysis the most central protein com-plexes that are involved in direct conversion of the fibro-blasts into the iNSCs were extracted.
Different parts of the networks show different degrees of activity. This is true for the expression network, where some parts of the network show higher expression (called
active modules) compared to other parts. To identify such active modules in the gene regulatory network, we have used JActiveModules [41]. JActiveModules uses P-values of the differentially expressed genes to find the most active group of genes in the regulatory network [41], therefore, we have loaded these values for the DE genes alongside expression data on the network.
Results
Differentially expressed genes and affected pathways during direct conversion of fibroblasts to iNSCs
By comparing gene expression profiles of fibroblasts and iNSCs [2], we have identified several DE genes, which are involved or affected through reprogramming of fibroblasts. Collectively, 2,167 DE genes were identified, of which 1,020 were upregulated and 1,147 were downregulated (Additional file 2: Table S2). Next, in order to identify which cellular processes are affected, functional clustering of these DE genes was conducted. The results indicate that signal transduction is the most affected process, where it contained the maximum number of affected genes. Expect-edly, genes related to the nervous system were also among the most affected pathways, where 29 DE genes were in-volved in the development of the nervous system.
Identification of TFs that are involved in the regulation of DE genes
Using ChEA, TFs with a role in direct reprogramming of fi-broblasts into iNSCs, were identified for the DE genes ob-tained as described in the previous section. Altogether, 46 TFs were detected that regulate 1,854 of the 2,167 DE genes. We found that 37 TFs were upregulated whereas 9 TFs were downregulated. The highest upregulation was ob-served for Pou5f1, Zic3 and Myb, while Cebpb, Klf2 and Ppargwere the most downregulated TFs. Finally, we com-bined all regulatory TFs interactions with those of protein-protein interactions and expression data to construct the regulatory network (with 1,857 nodes and 11,054 edges) (Additional file 3: Table S3).
Motifs are small sub-networks in the core regulatory net-work that play a role as building blocks of the regulatory network. Generally, they are processing specific information
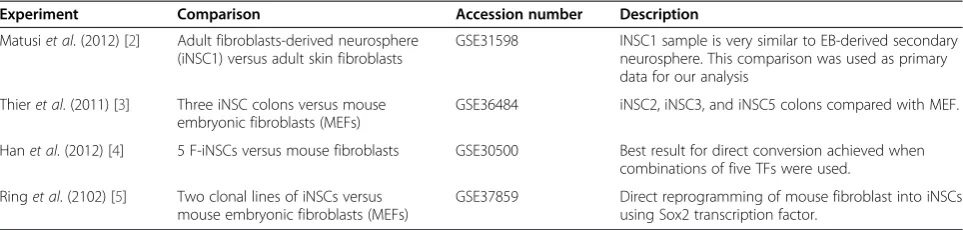
Table 1 Microarray data sets that were used in this study and their experimental design
Experiment Comparison Accession number Description
Matusiet al. (2012) [2] Adult fibroblasts-derived neurosphere (iNSC1) versus adult skin fibroblasts
GSE31598 INSC1 sample is very similar to EB-derived secondary neurosphere. This comparison was used as primary data for our analysis
Thieret al. (2011) [3] Three iNSC colons versus mouse embryonic fibroblasts (MEFs)
GSE36484 iNSC2, iNSC3, and iNSC5 colons compared with MEF.
Hanet al. (2012) [4] 5 F-iNSCs versus mouse fibroblasts GSE30500 Best result for direct conversion achieved when combinations of five TFs were used.
Ringet al. (2102) [5] Two clonal lines of iNSCs versus mouse embryonic fibroblasts (MEFs)
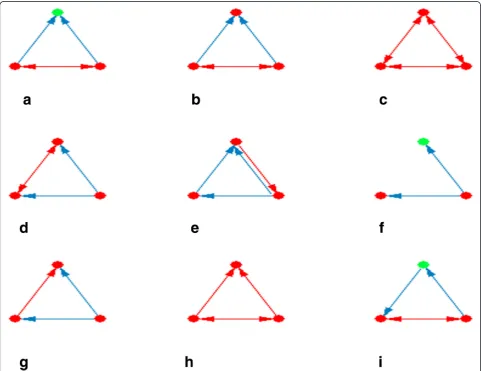
and are involved in special biological tasks. We have identi-fied such important motifs in the TFs regulatory network using the FANMOD tool, where we found 26 motifs (Figure 1). Different interacting patterns were observed between TFs and their targets. The most recurring patterns in our regulatory network were two interacting TFs that co-regulate a third gene (Figure 1a and b). Protein clique (three proteins that interact reciprocally) (Figure 1c) showed high frequencies, for example protein interactions between Ezh2, Suz12, and Mtf2 in the formation of the PRC2 (Figures 2b and 3). Co-regulated interacting proteins (Figure 1d) were the next discovered pattern based on their z-score. In this motif, one TF regulates two genes, where their protein products interact with each other.
Analysis of network-related parameters to identify important regulatory components
To find central TFs, we integrated different sources of data, namely protein-DNA interactions, protein-protein
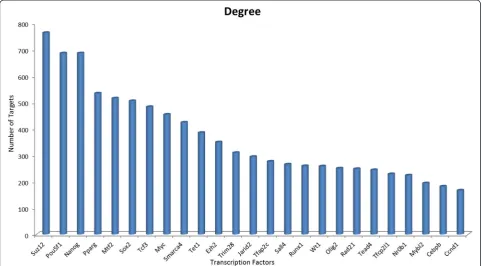
interactions and expression data to build a multi-component gene regulatory network. Based on the connectivity analysis of the gene regulatory network, 15 central TFs Nanog, Pou5f1, Pparg, Mtf2, Sox2, Myc, Suz12, Tcf3, Smarca4, Ezh2, Jarid2,Tet1, Sall4,Tcfap2c, and Trim28 were found to be central elements in direct reprogram-ming of adult fibroblasts into iNSCs (Figure 4). Results of analysis of six network-related centrality parameters are il-lustrated in Additional file 4: Table S4.
Experimentally validated protein-protein interactions obtained for 43 of these 46 TFs, were used to construct a protein-protein interaction network. This network consisted of 122 proteins and 216 interactions. MCODE was used to investigate if these TFs are involved in regu-lation of any important protein complexes. We obtained the highest scores for a group of TFs including WDR5, POU5F1, SALL4, SALL3, and L1TD1; all of them showed upregulation during conversion of fibroblasts to iNSCs. The second most important module include
Figure 1Enriched three-node motifs in the main regulatory network.Motifs withz-score above two and aP-value of zero are presented. Partsatoishow motifs with the highest frequency in order. A red node indicates upregulation, whereas a green node shows downregulation. Blue and red edges show regulatory and protein-protein interactions, respectively. The arrows show the direction of regulation.
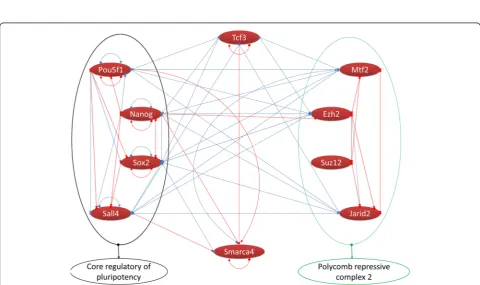
Figure 2Identified protein complexes in TFs protein-protein interaction network.Valid protein-protein interactions used to construct TFs protein-protein interaction network.a)toc)indicate protein complexes with a score more than 2. Red nodes show upregulation. TFs, transcription factors.
NR0B1, SALL1, SMARCA4, ARIDA1, NANOG, RAD21, JARID2, MTF2, SUZ12, EZH2, SOX2, and TFCP2L1; notably these proteins were also upregulated. Except SALL1 and ARIDA1, the rest are among the 46 TFs identified during direct conversion of the mouse fibro-blasts into iNSCs. The third motif had only two TFs, TET1 and SIN3A, with just two interactions. Collect-ively, 14 TFs out of 46 TFs were identified as being present in the protein complexes during direct repro-gramming of the mouse fibroblasts to iNSCs (Figure 2).
To find the role of TFs in an active sub-network based on the expression pattern of DE genes, we used JActive-Modules. TFs, such asCebpb,Stat4,Suz12,Rad21,Tcf3, Gata3,Tfcp2l1, Wt1, Olig2, Ezh2, Jarid2, Nanog, Sall4, Sox2, Nr0b1, Myb, Zic3, and Pou5f1, were found to be involved in the conversion of the mouse fibroblasts into the iNSCs (Table 2). Based on ontology analysis of three top modules, we also found the presence of the genes re-lated to the neural tube formation process, including Adm,Celsr1,Cthrc1, Sall4,Sox11, Zic2, and Zic5. Inter-estingly, the main regulators of these seven DE genes wereEzh2,Suz12, andNanog.
Taken together, based on our statistical analysis im-planted in the tools we have used, a number of TFs, in-cluding Pou5f1,Sall4, Nanog, Jarid2, Suz12, Ezh2, Sox2, Rad21, Mtf2,Tfcp2l1, Nr0b1, Smarca4,Tet1, Olig2, and Tcf3were found to be present in at least two out of three networks analyzed in the current study.
The role of TFs in the regulation of nervous system development
Based on the gene regulatory network ontology analysis, we identified 236 DE genes that were involved in the ner-vous system development process. The most important regulators of this list were Suz12, Mtf2, Pou5f1, Nanog, Ezh2,Tcf3, Sox2, Jarid2, Smarca4, and Myc, which were scored based on the number of targets they regulate.
Analysis of the gene regulatory network showed that at least ten signaling pathways are involved in the conversion of the fibroblasts into the iNSCs. The mitogen-activated protein kinase (MAPK) cascade, transmembrane receptor
Figure 4Connectivity analysis of the gene regulatory network.Numbers of interactions of the top 25 hub regulators are represented.
Table 2 The most important active modules and their participant regulators in the conversion of mouse fibroblasts into iNSCs
Comparisons Active modules
Nodes Transcription factors
iNSC versus fibroblast 83 Nr0b1, Suz12, Rad21, Pou5f1, Zic3. 90 Stat4, Nr0b1, Suz12, Rad21, Jarid2,
Sall4, Pou5f1, Myb, Zic3, Gata3. 182 Nr0b1, Ezh2, Nanog, Rad21, Myb,
Zic3, Stat4, Suz12, Sall4, Pou5f1, Sox2. 213 Nanog, Rad21, Zic3, Suz12, Wt1, Sall4, Cebpb, Tcf3, Sox2, Nr0b1, Ezh2, Myb, Pou5f1, Olig2, Tfcp2l1.
5 Sall4, Pou5f1, Nanog, Sox2. iNSCs, induced neural stem cells.
protein tyrosine kinase signaling pathway, G-protein coupled receptor signaling, Wnt receptor signaling path-way that required for basic developmental processes, Ras protein signal transduction, ERK1 and ERK2 cascade, Rho protein signal transduction, transforming growth factor beta receptor signaling pathway, cytokine-mediated signal-ing pathway, and BMP signalsignal-ing pathway were all among those pathways that were significantly affected by conver-sion of the mouse fibroblasts into the iNSCs (Additional file 5: Table S5). Further network analysis of the signaling pathways revealed that Mtf2,Tcf3, Suz12, Nanog, Pou5f1, Sox2, Pparg, Smarca4, Ezh2, Jarid2, Tet1,Trim28, Sall4, andMycwere the main regulators of the majority of these ten signaling pathways.
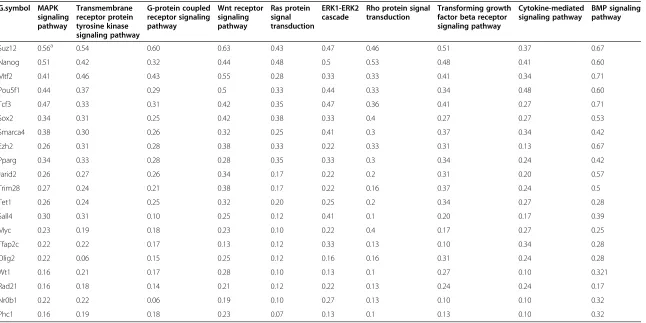
By narrowing down the number of the most important TFs, we have successfully identified the key regulators in the network. For example, Mtf2 was found to regulate 27% of all regulated genes in the constructed gene regu-latory network, while this TF regulates 71% of the DE genes in the BMP signaling pathway during direct con-version of the mouse fibroblasts into iNSCs. On the other hand,Suz12is involved in the regulation of at least 50% of the DE genes of the Wnt receptor signaling path-way, G-protein coupled receptor signaling pathpath-way, MAPK cascade, transmembrane receptor protein tyro-sine kinase signaling pathway and transforming growth factor beta receptor signaling pathway (Table 3 and Additional file 6: Table S6).
By comparing the list of TFs that were involved in the regulation of nervous system development and signaling pathways, we further shortened the list of the most im-portant regulators. It was found that TFs such asSuz12, Mtf2, Pou5f1, Nanog, Ezh2,Tcf3, Sox2, Jarid2, Smarca4, Myc, Trim28, Pparg, Sall4, and Tet1appear to regulate nervous system development as well as signaling path-ways during direct reprogramming of the mouse fibro-blasts into iNSCs.
Finally, by combining the results of network analysis with those obtained from biological processes (presented in the previous sections) ten TFs,Pou5f1, Sall4, Nanog, Jarid2,Suz12,Ezh2,Sox2,Mtf2,Smarca4, andTcf3, were found to be the most important TFs during direct pro-gramming of fibroblasts to iNSCs (Figure 3).
Validation of the list of predicted TFs by comparative analysis
Using our pipeline, we have identified 46 DE TFs that are involved in the direct conversion of mouse fibro-blasts into iNSCs. Further statistical analyses and regula-tory effects on biological processes revealed that ten TFs were the main regulators of direct reprogramming.
To further validate these findings, we used additional cell lines provided by the Matusi et al. [2] study. Inde-pendent data sets provided by incorporating Ring et al.
[5], Han et al. [4] and Thier et al. [3] data into the main set were analyzed (for details please refer to the Methods section).
In the current study, we used epidermal growth factor (EGF)-dependent iNSCs, which were generated from adult mouse fibroblasts, as central data for our analyses [2]. This cell is the best option for treating spinal cord injury (SCI) because a high degree of similarity exists be-tween Embryoid body (EB)-derived secondary neuro-spheres and neurons, in comparison with other cell lines [2]. For more confirmation of our results, the expression data of three other cell lines from the same study were also investigated [2]. Following the same protocol, 1,911 DE genes were identified. TF binding site analysis using ChEA revealed that 23 of the top 25 TFs are also expressed in the same pattern and are involved in the regulation of direct conversion in these three cell lines as EGF-dependent iNSCs. For example, four members of polycomb repressive complex 2, Ezh2, Suz12, Mtf2, and Jarid2are grouped as master regulators in four cell lines based on the number of regulatory interactions and also show the same pattern of expression. The same result also can be deduced for core regulators of pluripotency, Sox2,Pou5f1,Nanog, andSall4, in both regulation of DE genes and expression pattern.
Using the Ring et al. data set [5], two clonal lines of iNSCs were compared with wild type mouse embryonic fibroblasts (MEFs). Analysis of expression profiles re-vealed 1,398 DE genes with a P-value less than 0.05. Consequently, we have identified 35 DE-TFs to be in-volved in the regulation of most of these DE genes. Interestingly, comparison of the top TFs from the Matusi et al. data with those obtained from the Ring et al. study revealed TFsEzh2,Mtf2,Suz12,Tcf3,Pou5f1, Sox2, andSmarca4as the key regulators in both studies based on the connectivity analysis. In addition to these regulators, Sall4, one of the top ten TFs in analysis of the Matusiet al. data, ranked 12th in the Ringet al. data analysis. The expression pattern of these TFs is similar in both studies, in which all of them were upregulated during direct conversion of mouse fibroblasts into iNSCs.
Using the Hanet al. data set [4], we identified a set of 1,158 DE genes during conversion of the mouse fibro-blasts after application of five TFs. Using their DE genes lists and ChEA analysis we identified 38 TFs expressed differentially. By comparing our top ten TFs list with these 38 DE-TFs we found that Ezh2, Jarid2, Sox2, and Nanogwere present in both analyses.
Table 3 Predicting collaboration of TFs in regulation of the most affected signaling pathways
G.symbol MAPK signaling pathway
Transmembrane receptor protein tyrosine kinase signaling pathway
G-protein coupled receptor signaling pathway
Wnt receptor signaling pathway
Ras protein signal transduction
ERK1-ERK2 cascade
Rho protein signal transduction
Transforming growth factor beta receptor signaling pathway
Cytokine-mediated signaling pathway
BMP signaling pathway
Suz12 0.56a 0.54 0.60 0.63 0.43 0.47 0.46 0.51 0.37 0.67
Nanog 0.51 0.42 0.32 0.44 0.48 0.5 0.53 0.48 0.41 0.60
Mtf2 0.41 0.46 0.43 0.55 0.28 0.33 0.33 0.41 0.34 0.71
Pou5f1 0.44 0.37 0.29 0.5 0.33 0.44 0.33 0.34 0.48 0.60
Tcf3 0.47 0.33 0.31 0.42 0.35 0.47 0.36 0.41 0.27 0.71
Sox2 0.34 0.31 0.25 0.42 0.38 0.33 0.4 0.27 0.27 0.53
Smarca4 0.38 0.30 0.26 0.32 0.25 0.41 0.3 0.37 0.34 0.42
Ezh2 0.26 0.31 0.28 0.38 0.33 0.22 0.33 0.31 0.13 0.67
Pparg 0.34 0.33 0.28 0.28 0.35 0.33 0.3 0.34 0.24 0.42
Jarid2 0.26 0.27 0.26 0.34 0.17 0.22 0.2 0.31 0.20 0.57
Trim28 0.27 0.24 0.21 0.38 0.17 0.22 0.16 0.37 0.24 0.5
Tet1 0.26 0.24 0.25 0.32 0.20 0.25 0.2 0.34 0.27 0.28
Sall4 0.30 0.31 0.10 0.25 0.12 0.41 0.1 0.20 0.17 0.39
Myc 0.23 0.19 0.18 0.23 0.10 0.22 0.4 0.17 0.27 0.25
Tfap2c 0.22 0.22 0.17 0.13 0.12 0.33 0.13 0.10 0.34 0.28
Olig2 0.22 0.06 0.15 0.25 0.12 0.16 0.16 0.31 0.24 0.28
Wt1 0.16 0.21 0.17 0.28 0.10 0.13 0.1 0.27 0.10 0.321
Rad21 0.16 0.18 0.14 0.21 0.12 0.22 0.13 0.24 0.24 0.17
Nr0b1 0.22 0.22 0.06 0.19 0.10 0.27 0.13 0.10 0.10 0.32
Phc1 0.16 0.19 0.18 0.23 0.07 0.13 0.1 0.13 0.10 0.32
a
Fraction of differentially expressed genes in each signaling pathways that regulated by given TF. TFs, transcription factors.
Yaqubi
et
al.
Stem
Cell
Research
&
Therapy
(2015) 6:42
Page
8
of
DE-TFs, Ezh2, Sox2 and Tcf3, showed similar roles in the regulation of DE genes and expression patterns. Interestingly, a comparison of the three analyses showed that two TFs including Ezh2, the core catalytic compo-nent of PRC2 and Sox2, the pluripotency regulator, are the main regulators of direct reprogramming of fibro-blasts into iNSCs.
Overlapping of TFs across different studies
In summary, we analyzed expression profiles of iNSCs and fibroblasts from four independent studies, which used different protocols in the generation of iNSCs from fibroblasts. We compared the list of TFs involved in these four studies to identify common TFs across all of these protocols. Collectively, seven DE-TFs, Cebpb, Ezh2,Rad21,Rcor2,Runx1,Sox2, and Tead4, were iden-tified as common TFs across analysis of expression pro-files of these different experiments. Interestingly, six of these seven regulators, Cebpb, Ezh2, Rad21, Rcor2, Runx1, and Sox2, showed the same pattern in their ex-pression, butTead4showed a different pattern in Matusi et al. and Ring et al., in comparison with Hanet al. and Thieret al. DE-TFsEzh2, Rad21, Rcor2, and Sox2 were upregulatd during direct conversion of mouse fibroblasts into iNSCs, but Cebpb and Runx1 were downregulated. In conclusion, comparing the top TFs across all analyses led to the identification of Ezh2and Sox2 as the master regulators of direct conversion of mouse fibroblasts into iNSCs in all experimental procedures.
Ezh2role in cell fate specification of NSCs
We have identified the TFsEzh2andSox2as master reg-ulators of direct reprogramming of mouse fibroblasts to iNSCs. The role of Sox2 in the direct conversion of mouse fibroblasts into iNSCs was clarified by Ringet al., which showed the conversion of fibroblasts to iNSCs using only Sox2 overexpression [5]. In addition, several studies have usedSox2along with other factors to obtain iNSCs from mouse fibroblasts [2-4,6-8]. With regard to Ezh2, we have no reports which use this factor to con-vert fibroblasts to iNSCs. For more confirmation of the role of Ezh2 in generation and differentiation, we have compared the expression profile of NSCs with neurons and astrocytes.
Wild type samples of Neural progenitor cells (NPCs) and neurons were obtained from the Deng et al. study [27]. Microarray data were normalized and genes with aP-value <0.05 have been identified as DE genes. Collectively, 1,400 genes were identified to be DE during comparison of the expression profile of NPCs with neurons. Results of the analysis revealed downregulation ofEzh2during generation of neurons from NPCs. In addition to expression analysis, TFs binding site analysis revealed a list of TFs and their role in regulation of DE genes. Connectivity analysis showed
Ezh2as one of the ten top regulators of the generation of neurons from iNSCs. These analyses showEzh2 upregula-tion in NSCs and its importance in cell fate specificaupregula-tion of NSCs. These results indicate that Ezh2, besides being a master regulator in conversion to extremely different cell types, also plays role in conversion of NSCs to neurons, which is more similar to NSCs.
In addition to comparison of the expression profiles of NSCs with neurons, we have compared microarray data of NSCs with astrocytes which are more similar to NSCs than fibroblasts. The microarray data for this compari-son was obtained from the Cahoy et al. [29] and Kim et al. [28] studies. Normalization and identification of DE genes led to identification of 1,318 DE genes with a P-value <0.05. Expectedly, similar to previous results ob-tained for comparison of NSCs with neurons, Ezh2was upregulated in NSCs and downregulated during differen-tiation toward astrocytes. Furthermore, our analysis on the number of TF binding sites during differentiation of NSCs to astrocytes identifiedEzh2as one of the ten top regulators of astrocytes generation from NSCs.
In summary, the comparisons show good consistency with the role of Ezh2 in cell fate specification of NSCs and confirm its importance in the direct conversion of fibroblasts into iNSCs. The downregulation ofEzh2 dur-ing differentiation of NSCs toward astrocytes and neu-rons was previously confirmed [42]. In addition, analysis of the overexpression of Ezh2in astrocytes showed that this factor led to the reprogramming of astrocytes to NSC-like cells.
Discussion
We have constructed a gene regulatory network for genes and TFs in which their expressions were altered during direct conversion of the mouse fibroblasts into the iNSCs. Potential regulators of the constructed net-work were identified and ranked based on statistical ana-lyses and their involvement in the biological processes. We have shown that ten TFs, Pou5f1, Sall4, Nanog, Jarid2, Suz12, Ezh2, Sox2, Mtf2, Smarca4 and Tcf3, are the most influential regulators in this conversion. These TFs are mainly involved in the regulation of develop-mental processes and pluripotency characteristics. A possible role of the predicted TFs during this conversion is discussed in the following paragraphs.
been confirmed that Ezh2 is a determinant factor in the fate of NSCs and its upregulation causes differentiation towards oligodendrocytes, while its down regulation causes neural and astrocytes differentiation [42]. In addition, it was shown that over-expression of Ezh2 in astrocytes leads to reprogramming of these cells into NSC-like cells [44]. Matusiet al., produced iNSCs with the ability to differentiate into glia cells and neurons even in early passages [2]. We have constructed our in-tegrated regulatory network based on microarray data obtained from the Matusi et al. study. Based on these observations and our constructed network, we can hypothesize that Ezh2 dedicates gliogenic properties to iNSCs. Therefore, we propose that the expression of this factor in fibroblasts might be useful in the production of iNSCs with a high ability to differentiate into glia cells.
PRC2 contains three components: Ezh2, Suz12, and Eed polycomb proteins. Suz12 and PRC2 directly bind to the promoter regions of many genes that participate in neural differentiation [45]. On the other hand, it has been shown that Suz12 plays a crucial role in ESCs dif-ferentiation, but not in ESCs proliferation [46]. Investi-gation of the role of Suz12+/− and Suz12−/− ESCs upon differentiation to neurons showed that Suz12+/− ESCs successfully differentiate into neurons while no neurons formed during differentiation of Suz12−/− ESCs [46]. Interestingly, in accordance with previous results, we have identified Suz12 as the master regulator of the ner-vous system development processes during direct con-version of mouse fibroblasts into iNSCs. As Suz12 and Ezh2 are major components of the PRC2 complex, these findings may highlight the role of the PRC2 complex during such conversion.
The association of Mtf2/Pcl2 with the PRC2 complex has been identified by Wlakeret al. in mouse ESCs [47]. They used microarray analysis data obtained from Mtf2 knockdown mice to identify affected genes. Their func-tional clustering of DE genes showed that the upregu-lated gene list contained ESC associated genes, while downregulated genes were mostly involved in develop-mental processes, such nervous system development. They also showed that Mtf2 knockdown had a similar effect as those observed for the Suz12 and Ezh2 null ESCs, where higher similarity was observed between Mtf2 knockdown and Suz12 null ESCs [47]. On the other hand, it has been documented that in the absence of Mtf2, differentiation of ESCs has been retarded and the cells retained their pluripotency properties [48]. Our study showed the existence of an association between the function of Mtf2 and that of Ezh2 and Suz12 mem-bers of PRC2 during direct reprogramming of the mouse fibroblasts into the iNSCs (Figure 2b). These results show a high consistency with previous studies in the identification of Mtf2 as a regulator of nervous system
development. Therefore, we introduce Mtf2 as one of the key regulators of nervous system development, sec-ond to the Suz12 protein.
In addition to Mtf2, the Jarid2/Jomunji complex has been identified as another component of PRC2 in ESCs. While the proliferation properties of the stem cells were not affected in Jarid2−/− ESCs, during the differentiation stage a master regulator of pluripotency, Pou5f1, was found to be in excess and consequently differentiation was retarded [49]. Additionally, it has been reported that Jarid2 is essential for precise regulation of gene expres-sion during differentiation, where interruption of this gene leads to similar results as Suz12 knockout cells [50]. It has been shown that guiding PRC2 to its targets depends on the presence of Jarid2 and this process would be disrupted in theJarid2 knockout ESCs. Accord-ingly, we have identified Jarid2 in the DE-TF list and verified its interactions with Ezh2, Suz12, and Mtf2 in the protein-protein interaction network. Therefore, this TF should be considered as one of the top regulators of nervous system development and signaling pathways.
Sox2 plays a role in sustaining NSC properties as well as their differentiation [51,52]. This TF, in combination with other TFs, was used to convert fibroblasts directly into NSCs [2-8]. Interestingly, Sox2 individually, without the interaction of other TFs, is able to convert the fibro-blasts into the NSCs, where it expresses NSC marker genes and has the potency to direct fibroblasts differen-tiation into neurons, oligodendrocytes, and astrocytes [5]. From the constructed gene regulatory network, we found that Sox2 is one of the main regulators during dir-ect conversion of the mouse fibroblasts into the NSCs. Indeed, this TF, similar to Ezh2, was identified as one of the principle regulators.
Sox2, Pou5f1, and Nanog serve as core regulators in human and mouse ESCs and together they co-regulate the expression of many genes. These TFs regulate pluri-potency characteristics of ESCs through upregulation of genes involved in this process. In addition, these factors maintain the pluripotency properties by downregulation of genes that initiate differentiation into three germ layers. Each of these regulators exhibits self-regulations as well as cross-regulations in ESCs [53,54]. It has been shown that sall4 with Pou5f1, Sox2, and Nanog con-struct a self-controlling network that is crucial for main-tenance of ESCs pluripotency and their subsequent differentiation [55]. Sall4 is reported to regulate expres-sion of Pou5f1 and Sox2 through binding to their pro-moters [55]. It has been shown that Sall proteins, including SALL1, SALL2, and SALL4, are essential for neurolation [56]. Interestingly, Pou5f1 alone or in com-bination with small molecules is able to convert fibro-blasts into iNSCs. For example, Mitchell et al., showed that Pou5f1 alone is sufficient to convert human adult
fibroblasts into NPCs, following expression of NPC markers and the ability to differentiate to astrocytes, oligodendro-cytes, and neurons [9,57]. Consistent with our results, this factor has been identified as one of the co-regulators of the Pou5f1, Sox2, and Nanog genes based on gene regula-tory network analysis of mouse ESCs [23].
In addition to these eight genes, we have also identi-fied Smarca4/Brg1 and Tcf3/Tcf7l1 as minor regulators of direct reprogramming of the fibroblasts into the iNSCs. Interestingly, Smarca4 has been introduced as a chromatin remolding factor, essential for NSCs fate deci-sion between neurogenesis and gliogenesis [58]. Smarca4 gene expression directs NSCs to differentiate into glia cells, while its repression results in neuronal differenti-ation [58]. Accordingly, we hypothesize that over-expression of both Ezh2 and Smarca4 might be useful in the production of iNSCs with potency to differentiate into glia cells. Tcf3 is a TF that makes a connection between the Wnt signaling pathway and the core regula-tory network of pluripotency in ESCs upon differenti-ation. ESCs knockdown for Tcf3 showed an upregulation of core pluripotency genes (Pou5f1, Sox2, and Nanog) followed by its inability to differentiate [59]. It is possible that Tcf3 determines the balance between stemness and differentiation [59]. Previously, it was found that Nanog expression increases in the absence of Tcf3 [60]. Tcf3 plays a role in neural tube proliferation and maintaining of pro-genitor cells identity. Spinal propro-genitor cells deficient for Tcf3 showed disruption of progenitor properties despite maintenance of proliferations [61]. Interestingly, this factor used in combination with other TFs to convert the fibroblasts into the NSCs. Replacing of Pax6 and Olig2 with Tcf3 resulted in highest conversion efficiency [4].
In summary, we have identified four genes in the PRC2 complex, Ezh2, Suz12, Mtf2, and Jarid2, with a role in direct conversion of fibroblasts into iNSCs. In addition to these regulators, we showed that core regula-tors of pluripotency that contain Pou5f1, Sox2, Nanog, and Sall4 are also involved in the conversion of the fi-broblasts into iNSCs. Collectively, these eight factors play an essential role in cell fate decision and pluripo-tency. Pluripotency was also affected by Tbx3, Klf4, and Foxd3 genes, which regulate Pou5f1, Sox2, and Nanog. In ESCs, it has been discovered that Tbx3, Klf4, and Foxd3 are mainly repressed by PRC2. PRC2 knockdown mice showed an upregulation of these genes and subse-quent increase in the expression of core regulatory com-ponents of pluripotency including Pou5f1, Sox2, and Nanog [47]. Increases in the expression of Tbx3, Klf4, and Foxd3 inhibit differentiation and guarantee mainten-ance of pluripotency. Negative regulation of these three genes by PRC2 prepares cells to respond to external stimuli for fate decision and differentiation. However, these genes are absent in our DE gene list. These findings
might suggest that they are repressed by PRC2 during this conversion. So, it seems that produced iNSCs efficiently respond to external stimuli for terminal differentiation into neurons, oligodendrocytes, and astrocytes.
Conclusions
In this study, we have dissected the gene expression reg-ulations during conversion of mouse fibroblasts into iNSCs. Here, using protein-DNA, protein-protein and expression data we have constructed a gene regulatory network. We found 46 TFs were differentially expressed at this conversion based on ChIP enrichment analysis. Applying statistical analysis to the network and evaluat-ing the collaboration of genes in the signalevaluat-ing pathways regulation results in identifications of ten TFs with crit-ical roles in this conversion. Pou5f1, Sox2, Nanog and Sall4compose core regulators of pluripotency andMtf2, Suz12, Ezh2 and Jarid2 form the PRC2 complex. These eight TFs along withTcf3 andSmarca4are ten TFs that were identified as master regulators. Following analysis of three independent experiments, we have demon-strated Sox2 and Ezh2 as the main regulators of direct conversion of mouse fibroblasts into iNSCs. The results of this study may unravel new aspects of direct repro-gramming of mouse fibroblasts into iNSCs through introducing new master regulators.
Additional files
Additional file 1: Table S1.Data sets which were used for comparison of NSCs with astrocytes and neurons.
Additional file 2: Table S2.Full list of DE genes in conversion of mouse fibroblasts into iNSCs.
Additional file 3: Table S3.Regulatory and protein-protein interactions of whole network.
Additional file 4: Table S4.Results of centrality analysis of gene regulatory network using six centrality indexes.
Additional file 5: Table S5.List of the most affected signaling pathways and their involved DE genes.
Additional file 6: Table S6.Predicting collaboration of TFs in regulation of the most affected signaling pathways.
Abbreviations
ChEA:ChIP enrichment analysis; ChIP: chromatin immunoprecipitation; DAVID: Databases for Annotation, Visualization and Integrated Discovery; DE: differentially expressed; EB: Embryoid body; ESC: embryonic stem cell; FANMOD: fast network motif detection; iNSCs: induced neural stem cells; iPSC: induced pluripotent stem cell; MEFs: mouse embryonic fibroblasts; NPCs: Neural progenitor cells; PRC2: polycomb repressive complex 2; RMA: robust multi-array averaging; TFs: transcription factors.
Competing interests
The authors declare that they have no competing interests.
Authors’contributions
Acknowledgments
We sincerely thank Dr. Behrouz Shiran (ShahreKord University, Iran) for his continuous support and Dr. Hamid Mahdiuni (Razi University) for his constructive discussions. This research did not receive any external funding and was conducted using the authors’personal money.
Author details 1
Department of Medical Biotechnology, National Institute of Genetic Engineering and Biotechnology (NIGEB), Tehran, Iran.2Department of Molecular Biotechnology, National Institute of Genetic Engineering and Biotechnology (NIGEB), Tehran, Iran.3Department of Biology, School of Science, Razi University, Kermanshah, Iran.4Medical Biology Research Center, Kermanshah University of Medical Sciences, Kermanshah, Iran.
Received: 5 September 2014 Revised: 24 January 2015 Accepted: 9 March 2015
References
1. Pera MF. Stem cells: the dark side of induced pluripotency. Nature. 2011;471:46–7.
2. Matsui T, Takano M, Yoshida K, Ono S, Fujisaki C, Matsuzaki Y, et al. Neural stem cells directly differentiated from partially reprogrammed fibroblasts rapidly acquire gliogenic competency. Stem Cells. 2012;30:1109–19. 3. Thier M, Wörsdörfer P, Lakes YB, Gorris R, Herms S, Opitz T, et al. Direct
conversion of fibroblasts into stably expandable neural stem cells. Cell Stem Cell. 2012;10:473–9.
4. Han DW, Tapia N, Hermann A, Hemmer K, Höing S, Araúzo-Bravo MJ, et al. Direct reprogramming of fibroblasts into neural stem cells by defined factors. Cell Stem Cell. 2012;10:465–72.
5. Ring KL, Tong LM, Balestra ME, Javier R, Andrews-Zwilling Y, Li G, et al. Direct reprogramming of mouse and human fibroblasts into multipotent neural stem cells with a single factor. Cell Stem Cell. 2012;11:100–9. 6. Lujan E, Chanda S, Ahlenius H, Südhof TC, Wernig M. Direct conversion of
mouse fibroblasts to self-renewing, tripotent neural precursor cells. Proc Natl Acad Sci U S A. 2012;109:2527–32.
7. Kim J, Efe JA, Zhu S, Talantova M, Yuan X, Wang S, et al. Direct
reprogramming of mouse fibroblasts to neural progenitors. Proc Natl Acad Sci U S A. 2011;108:7838–43.
8. Kim SM, Flaßkamp H, Hermann A, Araúzo-Bravo MJ, Lee SC, Lee SH, et al. Direct conversion of mouse fibroblasts into induced neural stem cells. Nat Protoc. 2014;9:871–81.
9. Zhu S, Ambasudhan R, Sun W, Kim HJ, Talantova M, Wang X, et al. Small molecules enable OCT4-mediated direct reprogramming into expandable human neural stem cells. Cell Res. 2014;24:126–9.
10. Sheng C, Zheng Q, Wu J, Xu Z, Wang L, Li W, et al. Direct reprogramming of sertoli cells into multipotent neural stem cells by defined factors. Cell Res. 2012;22:208–18.
11. Corti S, Nizzardo M, Simone C, Falcone M, Donadoni C, Salani S, et al. Direct reprogramming of human astrocytes into neural stem cells and neurons. Exp Cell Res. 2012;318:1528–41.
12. Qiang L, Fujita R, Yamashita T, Angulo S, Rhinn H, Rhee D, et al. Directed conversion of Alzheimer’s disease patient skin fibroblasts into functional neurons. Cell. 2011;146:359–71.
13. Kim J, Su Susan C, Wang H, Cheng Albert W, Cassady John P, Lodato Michael A, et al. Functional integration of dopaminergic neurons directly converted from mouse fibroblasts. Cell Stem Cell. 2011;9:413–9. 14. Son EY, Ichida JK, Wainger BJ, Toma JS, Rafuse VF, Woolf CJ, et al.
Conversion of mouse and human fibroblasts into functional spinal motor neurons. Cell Stem Cell. 2011;9:205–18.
15. Pfisterer U, Kirkeby A, Torper O, Wood J, Nelander J, Dufour A, et al. Direct conversion of human fibroblasts to dopaminergic neurons. Proc Natl Acad Sci U S A. 2011;108:10343–8.
16. Pang ZP, Yang N, Vierbuchen T, Ostermeier A, Fuentes DR, Yang TQ, et al. Induction of human neuronal cells by defined transcription factors. Nature. 2011;476:220–3.
17. Caiazzo M, Dell'Anno MT, Dvoretskova E, Lazarevic D, Taverna S, Leo D, et al. Direct generation of functional dopaminergic neurons from mouse and human fibroblasts. Nature. 2011;476:224–7.
18. Yoo AS, Sun AX, Li L, Shcheglovitov A, Portmann T, Li Y, et al. MicroRNA-mediated conversion of human fibroblasts to neurons. Nature. 2011;476:228–31.
19. Ambasudhan R, Talantova M, Coleman R, Yuan X, Zhu S, Lipton Stuart A, et al. Direct reprogramming of adult human fibroblasts to functional neurons under defined conditions. Cell Stem Cell. 2011;9:113–8. 20. Zhou Q, Tripathi P. How to remake a fibroblast into a neural stem cell. Cell
Stem Cell. 2012;10:347–8.
21. Crespo I, del Sol A. A general strategy for cellular reprogramming: the importance of transcription factor cross-repression. Stem Cells. 2013;31:2127–35.
22. Crespo I, Perumal T, Jurkowski W, del Sol A. Detecting cellular reprogramming determinants by differential stability analysis of gene regulatory networks. BMC Syst Biol. 2013;7:140.
23. Zhou Q, Chipperfield H, Melton DA, Wong WH. A gene regulatory network in mouse embryonic stem cells. Proc Natl Acad Sci U S A. 2007;104:16438–43. 24. Irizarry RA, Hobbs B, Collin F, Beazer-Barclay YD, Antonellis KJ, Scherf U, et al.
Exploration, normalization, and summaries of high density oligonucleotide array probe level data. Biostatistics. 2003;4:249–64.
25. Blazejczyk M, Miron M, Nadon R. FlexArray. A statistical data analysis software for gene expression microarrays. Genome Quebec, Montreal, Canada; 2007. http://www.gqinnovationcenter.com/services/bioinformatics/ flexarray/index.aspx?l=e.
26. Affymetrix. Microarray technical documentation, annotation files. http://www.affymetrix.com.
27. Deng T, Zhu ZI, Zhang S, Leng F, Cherukuri S, Hansen L, et al. HMGN1 modulates nucleosome occupancy and DNase I hypersensitivity at the CpG island promoters of embryonic stem cells. Mol Cell Biol. 2013;33:3377–89. 28. Kim JB, Sebastiano V, Wu G, Araúzo-Bravo MJ, Sasse P, Gentile L, et al.
Oct4-induced pluripotency in adult neural stem cells. Cell. 2009;136:411–9. 29. Cahoy JD, Emery B, Kaushal A, Foo LC, Zamanian JL, Christopherson KS, et al. A
transcriptome database for astrocytes, neurons, and oligodendrocytes: a new resource for understanding brain development and function. J Neurosci. 2008;28:264–78.
30. Huang DW, Sherman BT, Lempicki RA. Bioinformatics enrichment tools: paths toward the comprehensive functional analysis of large gene lists. Nucleic Acids Res. 2009;37:1–13.
31. Huang DW, Sherman BT, Lempicki RA. Systematic and integrative analysis of large gene lists using DAVID bioinformatics resources. Nat Protoc. 2008;4:44–57.
32. Lachmann A, Xu H, Krishnan J, Berger SI, Mazloom AR, Ma'ayan A. ChEA: transcription factor regulation inferred from integrating genome-wide ChIP-X experiments. Bioinformatics. 2010;26:2438–44.
33. Stark C, Breitkreutz BJ, Reguly T, Boucher L, Breitkreutz A, Tyers M. BioGRID: a general repository for interaction datasets. Nucleic Acids Res. 2006;34:D535–9. 34. Saito R, Smoot ME, Ono K, Ruscheinski J, Wang PL, Lotia S, et al. A travel
guide to Cytoscape plugins. Nat Meth. 2012;9:1069–76.
35. Bindea G, Mlecnik B, Hackl H, Charoentong P, Tosolini M, Kirilovsky A, et al. ClueGO: a cytoscape plug-in to decipher functionally grouped gene ontology and pathway annotation networks. Bioinformatics. 2009;25:1091–3. 36. Bindea G, Galon J, Mlecnik B. CluePedia cytoscape plugin: pathway insights using
integrated experimental and in silico data. Bioinformatics. 2013;29:661–3. 37. Wernicke S, Rasche F. FANMOD: a tool for fast network motif detection.
Bioinformatics. 2006;22:1152–3.
38. Wernicke S. Efficient detection of network motifs. IEEE/ACM Trans Comput Biol Bioinformatics. 2006;3:347–59.
39. Scardoni G, Petterlini M, Laudanna C. Analyzing biological network parameters with CentiScaPe. Bioinformatics. 2009;25:2857–9.
40. Bader G, Hogue C. An automated method for finding molecular complexes in large protein interaction networks. BMC Bioinformatics. 2003;4:2. 41. Ideker T, Ozier O, Schwikowski B, Siegel AF. Discovering regulatory and
signalling circuits in molecular interaction networks. Bioinformatics. 2002;18:S233–40.
42. Sher F, Boddeke E, Olah M, Copray S. Dynamic changes in Ezh2 gene occupancy underlie its involvement in neural stem cell self-renewal and differentiation towards oligodendrocytes. PLoS One. 2012;7:e40399. 43. Sher F, Rößler R, Brouwer N, Balasubramaniyan V, Boddeke E, Copray S.
Differentiation of neural stem cells into oligodendrocytes: involvement of the polycomb group protein Ezh2. Stem Cells. 2008;26:2875–83. 44. Sher F, Boddeke E, Copray S. Ezh2 expression in astrocytes induces their
dedifferentiation toward neural stem cells. Cell Reprogram. 2010;13:1–6. 45. Bracken AP, Dietrich N, Pasini D, Hansen KH, Helin K. Genome-wide
mapping of polycomb target genes unravels their roles in cell fate transitions. Genes Dev. 2006;20:1123–36.
46. Pasini D, Bracken AP, Hansen JB, Capillo M, Helin K. The polycomb group protein Suz12 is required for embryonic stem cell differentiation. Mol Cell Biol. 2007;27:3769–79.
47. Walker E, Chang WY, Hunkapiller J, Cagney G, Garcha K, Torchia J, et al. Polycomb-like 2 associates with PRC2 and regulates transcriptional networks during mouse embryonic stem cell self-renewal and differentiation. Cell Stem Cell. 2010;6:153–66.
48. Walker E, Manias JL, Chang WY, Stanford WL. PCL2 modulates gene regulatory networks controlling self-renewal and commitment in embryonic stem cells. Cell Cycle. 2011;10:45–51.
49. Shen X, Kim W, Fujiwara Y, Simon MD, Liu Y, Mysliwiec MR, et al. Jumonji modulates polycomb activity and self-renewal versus differentiation of stem cells. Cell. 2009;139:1303–14.
50. Li G, Margueron R, Ku M, Chambon P, Bernstein BE, Reinberg D. Jarid2 and PRC2, partners in regulating gene expression. Genes Dev. 2010;24:368–80. 51. Graham V, Khudyakov J, Ellis P, Pevny L. SOX2 functions to maintain neural
progenitor identity. Neuron. 2003;39:749–65.
52. Pevny LH, Nicolis SK. Sox2 roles in neural stem cells. Int J Biochem Cell Biol. 2010;42:421–4.
53. Young RA. Control of the embryonic stem cell state. Cell. 2011;144:940–54. 54. Yeo JC, Ng HH. Transcriptomic analysis of pluripotent stem cells: insights
into health and disease. Genome Med. 2011;3:1–12.
55. Lim CY, Tam WL, Zhang J, Ang HS, Jia H, Lipovich L, et al. Sall4 regulates distinct transcription circuitries in different blastocyst-derived stem cell lineages. Cell Stem Cell. 2008;3:543–54.
56. Böhm J, Buck A, Borozdin W, Mannan AU, Matysiak-Scholze U, Adham I, et al. Sall1, Sall2, and Sall4 are required for neural tube closure in mice. Am J Pathol. 2008;173:1455–63.
57. Mitchell RR, Szabo E, Benoit YD, Case DT, Mechael R, Alamilla J, et al. Activation of neural cell fate programs toward direct conversion of adult human fibroblasts into tri-potent neural progenitors using OCT-4. Stem Cells Dev. 2014;23:1937–46.
58. Matsumoto S, Banine F, Struve J, Xing R, Adams C, Liu Y, et al. Brg1 is required for murine neural stem cell maintenance and gliogenesis. Dev Biol. 2006;289:372–83.
59. Cole MF, Johnstone SE, Newman JJ, Kagey MH, Young RA. Tcf3 is an integral component of the core regulatory circuitry of embryonic stem cells. Genes Dev. 2008;22:746–55.
60. Pereira L, Yi F, Merrill BJ. Repression of nanog gene transcription by Tcf3 limits embryonic stem cell self-renewal. Mol Cell Biol. 2006;26:7479–91. 61. Kim HS, Dorsky RI. Tcf7l1 is required for spinal cord progenitor maintenance.
Dev Dyn. 2011;240:2256–64.
Submit your next manuscript to BioMed Central and take full advantage of:
• Convenient online submission
• Thorough peer review
• No space constraints or color figure charges
• Immediate publication on acceptance
• Inclusion in PubMed, CAS, Scopus and Google Scholar
• Research which is freely available for redistribution