MinReg: A Scalable Algorithm for Learning
Parsimonious Regulatory Networks in Yeast and Mammals
Dana Pe’er [email protected]
Genetics Department Harvard Medical School Boston, MA 02115, USA
Amos Tanay [email protected]
Computer Science Department Tel Aviv University
Tel Aviv, Israel
Aviv Regev [email protected]
Bauer Center for Genomics Research Harvard University
Cambridge, MA 02138, USA
Editor: Tommi Jaakkola
Abstract
In recent years, there has been a growing interest in applying Bayesian networks and their ex-tensions to reconstruct regulatory networks from gene expression data. Since the gene expression domain involves a large number of variables and a limited number of samples, it poses both com-putational and statistical challenges to Bayesian network learning algorithms. Here we define a constrained family of Bayesian network structures suitable for this domain and devise an efficient search algorithm that utilizes these structural constraints to find high scoring networks from data. Interestingly, under reasonable assumptions on the underlying probability distribution, we can pro-vide performance guarantees on our algorithm. Evaluation on real data from yeast and mouse, demonstrates that our method cannot only reconstruct a high quality model of the yeast regula-tory network, but is also the first method to scale to the complexity of mammalian networks and successfully reconstructs a reasonable model over thousands of variables.
Keywords: Bayesian networks, structure learning, gene networks, gene expression,
approxima-tion algorithms
1. Introduction
Learning Bayesian network structure from data (Cooper and Herskovits, 1992; Heckerman et al., 1994) and its application to reconstruct gene regulatory networks from biological data (Friedman et al., 2000; Pe’er et al., 2001; Hartemink et al., 2002; Ong et al., 2002; Imoto et al., 2002; Yoo et al., 2002) is a subject of current research.
TF TF
SP SP
Gene Regulatory DNA
Transcribed mRNA
Signal Signal
Figure 1: Biological regulation: Signals activate signaling molecules (SM), which in turn acti-vate transcription factors (TF). When actiacti-vated, these bind to DNA regulatory sequences. Combinations of such binding events control the levels of mRNA transcription in a com-binatorial manner.
the expression of a gene, specialized proteins called transcription factors (TFs) bind to regulatory sequences on the DNA of target genes and work in a combinatorial fashion to ensure the correct amount is being transcribed (Figure 1). The behavior of those transcription factors is in turn con-trolled by the cell’s environment through the action of signaling proteins (SPs). The combined network of transcription factors and signaling proteins forms a regulatory program controlling the expression of individual genes directly (by regulator TFs) and indirectly (by regulator SPs). Since these networks serve as the information processing devices of cells, it is of great interest to uncover their structure and the regulation functions that they encode.
How can we learn such regulatory programs? An experimental technique, called DNA microar-rays allows us to simultaneously measure the expression of thousands of genes under various con-ditions and perturbations, providing biologists with global observations of the workings of the cell. Importantly, microarrays measure not only the expression levels of target genes, but also of genes encoding regulators - TFs and SPs. As has been previously demonstrated (Pe’er et al., 2001, 2002; Segal et al., 2003), in many cases a TF’s expression level is a good proxy to its activity, allowing us to construct a network that relates the gene expression of a target gene to the gene expression of its regulators. However, there are also numerous cases where a TF’s activity is not determined by its expression level, but rather by other types of biochemical events, that that are unobserved in mi-croarray data. Fortunately, in some of these cases, a change in the expression of indirect regulators (such as SPs that control the TF’s activity) may be observed in microarray measurements, allowing us to detect an indirect regulatory relation in lieu of the direct event.
the regulatory network is sparse, such that only a few genes directly control the transcription of a given target (Martinez-Antonio and Collado-Vides, 2003; Shen-Orr et al., 2002; Lee et al., 2002). Second, microarray measurements are typically noisy, necessitating a probabilistic model. Finally, biological networks contains many important hidden variables (e.g. the actual activity level of the regulators) which can be handled well in a Bayesian networks framework.
Nevertheless, the biological domain raises several important challenges for learning Bayesian networks. The central difficulty is that contrary to previous applications, microarrays measure thou-sands of variables (genes) across at most a few hundred samples. Thus, even if a search for the optimal solution (over a prohibitively large space) was possible, statistical noise is likely to lead to spurious dependencies, resulting in models that significantly overfit the data.
This problem becomes even more pronounced when considering the complex regulatory net-works of mammals. While Bayesian network approaches have been relatively successful in tackling networks of a unicellular model organism, the Baker’s yeast Saccharomyces cerevisiae, they have yet to achieve similar success in mammalian systems, such as human or mouse cells. These or-ganisms have considerably more complex regulatory systems, with a larger number of regulators and target genes, and much more complex combinatorial regulatory functions. Deciphering these networks can have significant implications to the understanding of animal development and com-mon diseases. A central question toward these important applications is finding a parsicom-monious set of major regulators at the center of a given response, and distinguishing them from additional redundant regulators or by product effects.
In this paper, we propose a novel approach to address these issues. We enforce biologically-motivated restrictions to limit the search to simple network structures that significantly reduce the space of possible networks, while highlighting the most relevant biological information. We devise a search algorithm that utilizes these structural constraints to efficiently find high scoring networks. Furthermore, under reasonable assumptions on the underlying probability distribution, we provide guarantees on our algorithm’s performance, thus providing an approximation algorithm for a certain class of Bayesian networks. This is of particular interest, because approximation algorithms for learning Bayesian networks have only been developed for polytrees(Dasgupta, 1999).
We evaluate the performance of our algorithm on synthetic and real gene expression data sets for both yeast and mammals. Our results show good structure reconstruction on synthetic data and that the model learned from gene expression data generalizes well to unseen test data. Importantly, our results also illustrate the ability of the learned models to successfully reconstruct biologically correct regulatory relations in complex mammalian systems.
2. Regulation Model
Our gene regulation model is a Bayesian network that describes regulatory relations between genes. In this network, each random variable corresponds to the gene expression level of a specific gene. If gene Y is a parent of gene X in the Bayesian network, we interpret this as “Y regulates X ”. We denote by PaX the set of all regulators (parents) of the gene (variable) X . Any gene that “regulates”
in our model is termed a regulator. The key point behind to our approach is that we enforce a number of biologically motivated constraints to limit these regulators and the graph structure.
Figure 2: A literature reconstruction of the Bacterial E. Coli regulation network from (Martinez-Antonio and Collado-Vides, 2003). Notice this includes small top layer of regulators and many targets for each.
which genes in a genome may function as regulators in general is often tractable, finding which regulators are active in a data set is difficult. Our inference will focus on this latter question.
In fact, previous biological studies indicate that only a small fraction of all potential regulators may be active in a given data set. Accordingly, we also constrain the structural properties of the graph, seeking a Bayesian network in which only a limited number of genes are regulators, i.e., have an outdegree greater than zero. Moreover, extensive studies in both bacteria and yeast (Shen-Orr et al., 2002; Martinez-Antonio and Collado-Vides, 2003; Lee et al., 2002) (Figure 2) indicate that each such “master regulatory gene” may affect the transcription of many genes (indeed, only 3-6% of the yeast and human genes respectively encode TFs). Thus, we expect each regulator to have a high out-degree. These constraints result in a graph of small depth, in which layers containing a small number of regulators control a large bottom layer of target genes, consistent with current biological understanding.
In addition to its biological relevance, this network structure has an obvious statistical moti-vation: Only when a gene consistently scores high as a parent for many genes, do we believe it indicates a true signal. An occasional high score as a parent of a single gene is attributed to spurious chance. Since learning an accurate genetic network is not possible in the current data paucity in the gene expression domain, our restrictions represent a reasonable first order approximation of the network which preserves its biological relevance. In fact, for most biological applications, false positives are significantly more “costly” than false negatives, and finding a robust set of key regu-lators whom are most strongly supported by the data (as offered by our model) is a more important goal then discovering their complete set of targets.
We now provide a formal definition of our model: A regulation graph is a Bayesian network with the following restrictions on its structure.
Definition 1 Given a set of random variables
X
={X1, . . . ,Xn}, a set of candidate regulators-C
Gat1 Uga3 Dal80
Tat12
Gap1 Opt2 Tat1 Asp3
Gap1 Opt2 Tat1 Asp3
Bap1 Dal3 Dal2 Dal7
Bap1 Dal3 Dal2 Dal7
Agp5 His5 Arg80
Agp5 His5 Arg80
Met13 Nit1
Regulators
Targets
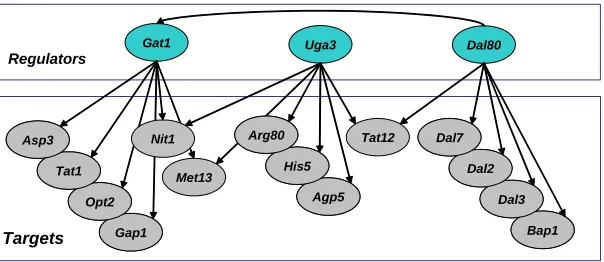
Figure 3: Regulation graph. The top layer is associated with the regulators and the bottom layer is associated with all other variables. The key concept behind the regulation graph is a small number of regulators, each with many targets. Note, the illustrated nitrogen catabolism response was automatically inferred by our algorithm from a gene expression data set.
• All parents belong to the candidate set:∀X,PaX⊂
C
.• The number of parents for each variable (indegree) is bounded by d:∀X,|PaX| ≤d.
• The total number of parents in the model is bounded by k: We term the the union of all parent sets in the network to be the graph’s regulators, denoted by
R
, thus we constrain|R
| ≤k.The graph structure is best visualized as a graph with a shallow depth: in the top layers, a small set of regulators (chosen from a large set
C
), possibly regulating each other and in the bottom layer, all other variables (see Figure 3).2.1 Optimization Problem
Since a regulation graph is a Bayesian network, the straightforward approach to learning its structure would be to use the typical heuristic greedy hill-climbing search (Heckerman, 1998) used for this task. This involves traversing the space of legal models in a greedy fashion using local operators such as adding, removing or reversing a single edge. At each step, the operation that best improves the score is chosen.
Unfortunately, the standard approach is likely to fail as the limited number of regulators spec-ified by the regulation graph could be quickly used up. For example, we may wish to search for a regulation graph over 2000 variables, limited to 30 regulators. We begin with the empty graph and in a greedy fashion add the optimal edge at each iteration. In many of these iterations, a new regulator is added to the regulator set
R
. Therefore, after little over 30 iterations, no new regulators could be added toR
and all subsequent legal steps would only involve adding edges from regulators already inR
. While these regulators might be the best parents for a small set of variables, thousands of other variables remain unexplained in the model.of parents in the model is limited to k, choosing a parent for one variable can limit the choice of parents for other variables. Thus, a regulator should be added to
R
only when it is a good parent for many variables concurrently. Any search algorithm we design must take this into account and add a regulator to a set of target genes in each greedy step.Fortunately, once a regulator set
R
is given, finding the optimal regulation graph constrained toR
is polynomial, and for most practical cases efficient. For any given variable, there is a small number, dk, of possible parent sets (compared to dn
possible parent sets for Bayesian networks bounded by an indegree of d).1 Thus, it is quick to calculate the local score, denoted Score(X ; P), for all possible parents sets and choose the highest scoring parents.
PaX =argmaxP⊂R,|P|≤dScore(X ; P) (1)
When
R
is not given, we can use use this property to efficiently evaluate the quality of any potential set of regulators.Definition 2 We define the utility, F(R)of a regulator set R as: F(R) =
n
∑
i=1max
P⊂R,|P|≤dScore(Xi; P) (2)
The utility of a regulator set R can be computed quickly and closely approximates the score of the optimal network constrained to R, denoted SCORE(R). F(R) scores a graph structure resulting from independently choosing the optimal parents for each variable, and is therefore an upper bound on SCORE(R). Note, that an independent choice of parents for each variable may lead to a structure containing cycles. Thus, a legal Bayesian network might have a some parent sets that score sub-optimally. However, since cycles can form only between the variables in R, which is a relatively small part of the entire network (k<<n), we expect that SCORE(R)is usually only slightly less than F(R). Furthermore, acyclicity can be resolved within a subgraph involving only k nodes (the complexity of solving this problem is constant in n, though exponential in k). In most practical cases, only a few short cycles form and the optimal solution can be easily found. In comparison, resolving cyclicity in a Bayesian network can be exponential in n (k<<n), since cycles can form among any n variables.2
We treat F(R)as a scoring function that measures the quality of regulator sets. This implies a new optimization problem to find a small set of regulators,
R
, which maximize this score:Definition 3 The Best Regulator Set problem: Given a set of variables
X
, a data set of samples D, a set of candidate parentsC
, and the constants d and k, we wish to findR
=argmaxR⊂C,|R|≤kF(R) (3)1. We typically use d ranging between 3 to 5 and k ranging between 30 to 70, whereas n is in the thousands and|C|is
in the hundreds.
2. In our typical setting where k ranges between 30 to 70 and n≥2000, the difference in score after breaking the cycles
is negligible. With high probability this difference would not change our choice of regulating setR. Therefore, for
This problem is conceptually similar to the Set Cover problem, a classical hard problem. The challenge is that the regulator set
R
must be chosen from a much larger candidate setC
and there are |Ck|possible regulator sets. While there does not seem to be any efficient algorithm to find an optimal solution, we next present an efficient algorithm that attempts to approximate it.3. MinReg Learning Algorithm
We now turn to the task of learning a regulation model (specified by a set of regulators
R
, and a parent structure on the variables inX
) from a training set (D={x[1], . . . ,x[M]}, consisting of M instances drawn independently from an unknown distribution P(X
)). Our goal is to choose the set of regulatorsR
and learn the regulatory graph structure that best explains this distribution. We take a score-based approach to this learning task and we define a scoring function that measures how well each candidate model fits the observed data.Given a scoring function, our task is to devise a search algorithm capable of efficiently finding a high scoring model. As discussed in Section 2.1, the hard part of the search is to find the optimal set of regulators,
R
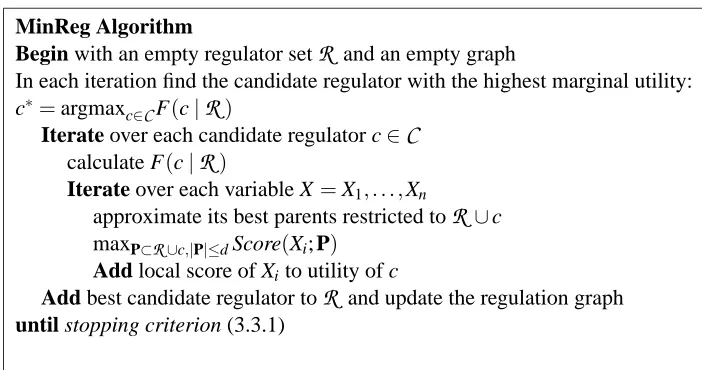
. Our novel greedy algorithm for this task, MinReg (sketched in Figure 4), begins with an empty set of regulators and an empty graph structure. At each iteration, for each possible candidate, we construct an increment regulator set by adding that candidate to the current regulator set. We calculate the score for each of the increment regulator sets and choose the one that gives the largest gain. Each timeR
is updated, we calculate the optimal regulation graph restricted to the current regulator setR
. We continue to iterate until some stopping criterion is reached.A crucial point is to correctly define the gain of a given regulator at each iteration. We calculate a local score between a variable and its regulating set. When considering a new candidate regulator c∈
C
as a parent for a variable X , we measure not how well c scores for X , but how much additional gain c gives to X ’s local score. Thus, each of the regulating parents provide a distinct contribution to the score.Definition 4 We define the marginal utility of adding a regulator set C to an already chosen regu-lator set R as
F(C|R) =F(C∪R)−F(R) (4)
Thus, at each iteration, we add the candidate regulator with the largest marginal utility.
3.1 α-modularity and Performance Guarantees
MinReg Algorithm
Begin with an empty regulator set
R
and an empty graphIn each iteration find the candidate regulator with the highest marginal utility: c∗=argmaxc∈CF(c|
R
)Iterate over each candidate regulator c∈
C
calculate F(c|
R
)Iterate over each variable X=X1, . . . ,Xn
approximate its best parents restricted to
R
∪c maxP⊂R∪c,|P|≤dScore(Xi; P)Add local score of Xito utility of c
Add best candidate regulator to
R
and update the regulation graph until stopping criterion (3.3.1)Figure 4: Overview of the MinReg algorithm. The algorithm consists of two nested greedy loops. The external loop finds the optimal set
R
of k regulators. For each X∈X
an internal loop finds an optimal set of parents PaX.We argue that this characterizes the only situation in which our algorithm fails. We show that if we can bound the severity of such effects, we can derive a worst case error bound on the algorithm’s performance: in this case, MinReg is an approximation algorithm, guaranteed to find a solution which is not too far from optimal. To formally prove this guarantee, we introduce the notation of
α-modular functions.
Definition 5 Let f be a function defined over subsets of
C
. f is monotone increasing if forall subsets A,B s.t. A⊆B, the following holdsf(A)≤ f(B)
Definition 6 (Lehmann et al., 2001) Let f be a function defined over subsets of
C
. f isα-modular (α≥1) if and only if for all subsets A,R and for all singletons Z, the following holds:f(A∪Z|R)≤ f(A|R) +αf(Z|R)
Lemma 7 The following are equivalent definitions of α-modular functions: ( (Lehmann et al., 2001))
1. For any subsets S⊆T and singleton Z∈/T we have f(Z|S)≥αf(Z|T). 2. For any subsets S⊆T and subset V we have f(V|S)≥αf(V|T). 3. For any subsets A,B, we have f(A) +αf(B)≥f(A∪B) +αf(A∩B)
These equivalent formulations offer us another perspective: the marginal utilities of α-modular functions are “almost” (up to a factor ofα) monotone decreasing. This fits our intuition that as
R
grows larger, the utility of adding new regulators diminishes.
Theorem 3.1: If F is anα-modular and monotone increasing function,3then the MinReg algorithm (presented in Figure 4) is a polynomial time approximation algorithm for the Best Regulator Set: Denote by OPTkthe optimal k regulator set (i.e. that maximizes F) and by MINREGkthe regulator
set found by the MinReg algorithm, then
(α+1)F(MINREGk)≥F(OPTk) (5)
This theorem provides assurance that while MinReg is a very quick algorithm that greedily takes locally optimal steps, the score of the regulator set found by MinReg is not too far away (at most a factor of 1+α) from the optimal solution reached by exhaustively enumerating all possible regulator sets.
Proof: Our proof is by induction. For k=1, the optimal solution is the best single regulator and this is exactly the regulator found by the MinReg algorithm therefore MINREG1=OPT1. We assume that(α+1)F(MINREGk−1)≥F(OPTk−1)and prove it for k.
Set J=argmaxI∈CF(I), the best single regulator in
C
and ˆJ=argmaxI∈OPTkF(I), the best single regulator in OPTk. Note, J is the first regulator chosen by the MinReg algorithm.We define the following sub-problem imitating the behavior of the greedy algorithm. Let ˆ
F(Y) =F(Y∪ {J})−F(J), our goal is to find a set of k−1 regulators that optimize ˆF on
C
\ {J}.This is exactly what MinReg does after it chooses J in the first iteration. We denote by OPTˆ k−1 and MINREGˆ k−1 the optimal and greedy solutions respectively to this new sub problem. It is easy to see that ˆF is a α-modular function and that our induction holds for ˆF as well, that is,
(α+1)Fˆ(MINREGˆ k−1)≥Fˆ(OPTˆ k−1).
By the inductive hypothesis, it suffices to show that the increment isα-modular, i.e.:
F(OPTk)−Fˆ(OPTˆ k−1) ≤ (α+1)F(MINREGk)−Fˆ(OPTˆ k−1)⇒ F(OPTk) ≤ (α+1)F(MINREGk)
simply by subtraction of the same value on both sides. By the induction hypothesis on ˆF we have that
F(OPTk)−Fˆ(OPTˆ k−1) ≤ (α+1)(F(MINREGk)−Fˆ(MINREGˆ k−1)) ≤ (α+1)F(MINREGk)−Fˆ(OPTˆ k−1)
because(α+1)Fˆ(MINREGˆ k−1)≥Fˆ(OPTˆ k−1). Note that
F(MINREGk)−Fˆ(MINREGˆ k−1) = F(MINREGk)−F(MINREGˆ k−1∪ {J}) +F(J) =F(J)
sinceMINREGˆ k−1∪{J}=MINREGkby the very way in which the MinReg algorithm works. Thus
to prove the induction for k it is enough to show that:
F(OPTk)−Fˆ(OPTˆ k−1)≤(α+1)F(J) (6) SinceOPTˆ k−1is at least as good as any solution of size k−1, by definition:
ˆ
F(OPTˆ k−1)≥Fˆ(OPTk\ {J}ˆ ) =F(OPTk\ {J0} ∪ {J})−F(J) (7)
Byα-modularity of F:
F(OPTk)≤F(OPTk\ {J}ˆ ) +αF(Jˆ) (8)
Subtracting (7) from (8) gives:
F(OPTk)−Fˆ(OPTˆ k−1)≤[F(OPTk\ {J}ˆ )−F(OPTk\ {J} ∪ {J}ˆ )] + [αF(Jˆ) +F(J)] (9)
Monotonicity of F implies that F(OPTk\ {J}ˆ )≤F(OPTk\ {J} ∪ {J}ˆ ), therefore, the first bracket
gives a negative contribution. Maximality of J implies that F(J)≥F(Jˆ), therefore the second bracket is≤(α+1)F(J).
It remains to show that F is both monotone andα-modular. Recall, F is a sum of maximizations of local scoring functions: F=∑ni=1maxP⊂R,|P|≤dScore(Xi; P). The local maximizations are clearly
monotone, if S⊂T, then∀X,maxP⊂TScore(X ; P)≥maxP⊂SScore(X ; P). Thus F, being the sum of monotone functions, is monotone as well.
Empirically we observe that F isα-modular, usually for relatively smallα(see 4.1.1). At first this might sound surprising, since as mentioned above, synergy is known to play an important role in biological regulation, and we do not expect Score(X ; P)to beα-modular in the gene expression domain. Fortunately, while regulators are synergistic for specific targets, F is a sum over thousands of variables. Even if the synergy between two regulators is very high, this synergy would need to hold for many targets, otherwise it would average out when summing over all of
X
. We empirically tested the synergy between regulators and groups of regulators in both yeast and mammalian data sets, the worst factor we encountered was 1.2. Therefore, we make the assumption ofα-modularity of F withα=2 in the gene expression domain.3.2 Scoring Function
To define the local score Score(X ; P), we adopt the Bayesian paradigm and use the Bayesian BDe scoring function (Heckerman et al., 1994; Heckerman, 1998) commonly used for learning Bayesian networks. The Bayesian score evaluates the posterior probability of the graph given the data:
scoreB(
G
:D
) = log P(D
|G
) +log P(G
)where P(
D
|G
)takes into consideration our uncertainty over the parameters and averages the prob-ability of the data over all possible parameter assignments toG
.P(
D
|G
) =Z
The particular choice of the priors P(
G
)and P(θ|G
)determines the exact Bayesian score.The BDe score refers to a certain class of priors with several desirable properties (as detailed in (Heckerman, 1998))In particular, the BDe score of an entire regulation graph
G
, decomposes into sum over the local scores for each variable.score(
G
: D) =∑
i
Score(Xi; PaXi) (10)
We use these local decomposed scores as the local score for our algorithm.
3.3 MinReg Implementation
A general overview of the MinReg algorithm was presented in Section 3. Several details in Min-Reg’s implementation lead to substantial speed-up of the na¨ıve algorithm, such that our implemen-tation can generate a model over thousands of genes within few minutes.
First, we define a function fX for each variable X , fX(
R
) =maxP⊂R,|P|≤dScore(X ; P). This isthe optimal contribution of X to F, restricted to a regulator set
R
. Thus, we have 3 levels of scoring functions: Score - for a particular variable and its parents, fX - the optimal score of a single variableX , and F(
R
) =∑X∈X fX(R
).The na¨ıve greedy algorithm has k iterations. In each iteration, F(c|
R
) is calculated for all c∈C
. Since each calculation of F(c|R
)requires calculating fX(c|R
)for all X∈X
, fXis calculatedk|
C
||X
|times. Calculation of fX requires calculating Score for each of the dkpossible sets of parents. While this is constant in n, in practice kd could be very large. We devise a number of heuristics based onα-modularity to reduce the number of times we need to calculate each of the 3 functions F, fX, and Score.
We employ a branch and bound approach to F(c|
R
), using theα-modularity of F to filter out candidates with little potential. In the first iteration, for all c∈C
we calculate Util(c) =F(c). We store the candidate regulators in a heap sorted by Util(c). At any given time, Util(c) =F(c|A), for some A⊆R
. Theα-modularity of F ensures thatαUtil(c)≥F(c|R
) (see Lemma 7). In most cases, we expect the regulator with the highest marginal utility to be toward the top of the heap.Once a new regulator is added to
R
, the marginal utilities change and need to be recalculated. In each subsequent iteration, we traverse down the heap and only re-evaluate candidates for whomα∗Util(c)is greater than the best marginal valuation found thus far, denoted c∗. Each time F(c|
R
)is calculated, we use this value to update Util(c) in the heap. Once we reach a candidate such thatα∗Util(c)<F(c∗|
R
)we stop traversing the heap, asα-modularity ensures that none of the candidates beyond this point can be better than c∗. While this branch and bound does not change the worst case complexity, for most practical cases, only the few topmost candidates are examined in each iteration.While the previous speed-up came at no loss in the quality of the final solution, the next two heuristics reduce accuracy. These heuristics are based on the assumption that Score isα-modular in most cases (though probably by a larger factor). This assumption is reasonable (albeit not always accurate). While regulation is sometimes synergistic, functions such as XOR are rare in biology and even when synergy exists, it is bounded by a reasonable constant. More importantly, we expect the synergistic pairs are themselves uncommon.
Similarly to how Util(c) approximates F(c|
R
), we cache UtilX(c) as an approximation ofIn the first iteration we initialize UtilX(c) = fX(c), for each c∈
C
and X ∈X
. In subsequentit-erations, we only recalculate fX(c|
R
) (and update UtilX(c)) for those X ’s whose parent set PaXchanged in the previous iteration. This is especially effective in later iterations where PaX rarely
changes.
Finally, instead of calculating fX exactly, we approximate it using a greedy algorithm similar to
Figure 4. We start with no parents and at each iteration add best parent, argmaxc∈R fX(c|PaX)to
PaX. This only requires d|
R
|calculations of Score instead of |Rd|.
3.3.1 STOPPINGCRITERION
Formally, the best regulator set problem requires a predefined constant k, specifying the number of regulators in the model. However, there are no obvious biological grounds for choosing a particular “good” k, as there is a trade-off between fine resolution (offered by a larger number of regulators) and statistical robustness (from a small number of regulators).
We address this fine balance by taking an adaptive approach. We devise a stopping criterion for the addition of new regulators to our model. We continue to add regulators as long as their contribution to the score is significantly better than random regulators. We generate a set of m random regulators with similar properties to the real candidate regulators in our data. We construct these by sampling regulators with replacement from the original candidate regulator set. For each sampled regulator, we randomly permute the order of its samples. Thus, the random regulators have the same distribution over their values, but these are independent of the target variables. We calculate the score for these random regulators in a manner similar to the real candidate set and store these in a heap. This provides us with an empirical distribution for the score of a random regulator. We continue to add regulators to our model as long as they score greater than the random candi-dates. We update the scores in the candidate heap in a similar manner to the real candidates, pruning the heap usingα-modularity. We stop once a random regulator scores better than any real regulator.
4. Experimental Results
We evaluated our algorithm on two data sets, a compendium of yeast expression profiles and a data set of mouse B-lymphocyte expression profiles. The distinct two data sets provide us each with a different realistic evaluation context. The yeast S. cerevisiae is the most extensively studied or-ganism on a genomic scale, and has the most extensively characterized regulatory system among eukaryotes. In addition to an extensive amount of microarray data, identifying cis-regulatory ele-ments (Bussemaker et al., 2001) and TF binding events (ChIP-chip experiele-ments) (Lee et al., 2002; Harbison et al., 2004) is tractable on a genomics scale. Finally, decades of careful studies on individ-ual gene functions are documented in a genome database (Cherry et al., 2001). Together, these data sources will allow us to carefully evaluate the success of our method in light of current biological knowledge.
dif-ficult or intractable. In fact, the sole available source of relevant data in mammalian systems is typically microarray measurements of expression profiles. Importantly, no successful method was demonstrated to date for reconstructing regulatory networks from mammalian expression profiles. Even partial success of MinReg in reconstructing mammalian regulation would constitute a signifi-cant scientific advance.
The yeast data set contained 358 samples combined from the Compendium (Hughes et al., 2000) and stress (Gasch et al., 2000) data sets.4 We compiled a set
C
of 466 candidate regulators for yeast, which includes any gene with a potential regulatory role based on annotation or sequence homology. The expression profiles were discretized into 3 values: down-regulated, no change and up-regulated.5 We included only 3755 genes with significant change in gene expression in at least 15 samples. We set the maximal indegree, d=3, a reasonable estimate for the regulation of most yeast genes (in particular under a limited number of condition).6 We conservatively setα=2 based on empirical evaluation of the data (see Section 4.1.1 below). We applied our MinReg algorithm to this data set resulting in a yeast regulation model with 44 key regulators.The mouse data set consisted of 204 samples from purified spleenic B-lymphocytes (Sambrano et al., 2002), subjected to a number of stimuli (ligands) and combinations of these stimuli. We compiled a list of 684 candidate regulators using criterion similar to the yeast candidate regulator set.7 We discretized the data as in yeast, except that the data was discretized into 5 levels: strongly down regulated, weakly down regulated, no change, weakly upregulated and strongly upregulated. We included only the 4373 genes that significantly changed in at least 18 samples. We ran the MinReg algorithm on this data and inferred a regulation model with 75 key regulators.
We employed both statistical and biological criteria to evaluate the performance of the algo-rithm. We examine our assumptions ofα-modularity, the ability of our algorithm to generalize to unseen data, and the accuracy of the reconstruction on synthetic data. To demonstrate the accuracy of our algorithm in reconstructing the real yeast and mammalian regulatory network, we devise an approach to infer regulator function from our model, and compare that to the known central regulators in the relevant biological processes.
4.1 Statistical Evaluation
In this section we well evaluate the statististical robustness of the MinReg algorithm. We focus on two issues, is the assumption of alpha-modularity a reasonable one for our gene expression domain, and how well does our learned model generalize to unseen test data.
4. The Compendium (Hughes et al., 2000) contains 276 deletion mutants from various functional classes and the Stress data set (Gasch et al., 2000) contains 82 samples of responses to 12 different stress conditions.
5. The Bayesian score is based on a multinomial distribution. Exact continuous measurement is a very noisy estimate of the actual gene expression and in our experience, discrete states better represent gene activity. We used a soft discretization based on a linear piecewise step function for each level of activity.
6. While some genes might have more regulators, there is not enough data to learn such complex regulatory function from so few samples. Importantly, our goal is to robustly learn the key regulatory relations, not the full detailed network.
4.1.1 ALPHAMODULARITY
MinReg employs a greedy approach, evaluating only the addition of single regulators to the model at each iteration, potentially missing a better combination of regulators.8 Based on the assumption of
α-modularity of F, Theorem 3.1 ensures that the score of the greedy solution is not much worse than the score of the optimal solution. Furthermore, to improve the speed performance, theα-modularity of F is used strongly by the implementation to bound the number of the regulators that are evaluated from the heap at each iteration.9
To empirically evaluate theα-modularity of F in the two data sets used, we calculated the pair-wise gain in score for all pairs of regulators in the candidate set
C
. Thus, for each pair of candidates c1and c2, we calculated the worstαusing F(c1∪c2), F(c1)and F(c2). In addition, we calculated the worstαfor 10,000 pairs of random subsets, C1,C2⊂C
, ranging between 2 to 8 regulators each, using F(C1∪C2),F(C1)and F(C2). For the yeast and B-lymphocyte data, the worstαempirically encountered were 1.184 and 1.229, respectively. We usedα=2 as a conservative overestimation to determine when to stop evaluating candidates in the heap at each iteration.To further boost speed, we make a weak (but inaccurate) assumption that Score is close toα -modular, allowing MinReg to reconstruct a large network over thousands of genes in a few minutes, rather than overnight. We evaluated the effect of this additional modification on MinReg’s per-formance by comparing its affect on the likelihood of test data in cross validation, as well on the enrichment of GO annotations in target sets (see sections 4.1.2 and 4.2.1) Indeed, based on these two criteria, assumingα-modularity of Score does not hurt the algorithm’s performance.
4.1.2 CROSSVALIDATION
To evaluate the statistical robustness of our learned model and its ability to generalize to unseen data, we tested MinReg’s performance in 5-fold cross validation. We randomly split the data into 5 equal parts, and ran MinReg 5 times. Each time using 4/5 of the samples as training samples to to learn both the structure and parameters of the regulation model, and withholding 1/5th of the data samples as a testing set. We then used the inferred model and gene expression of inferred regulators in the test data to predict the expression levels of all 3755 variables in each test sample. That is, given the expression of regulators in the mth sample, we use P(X|PaX[m])to predict the value of
X in that sample.
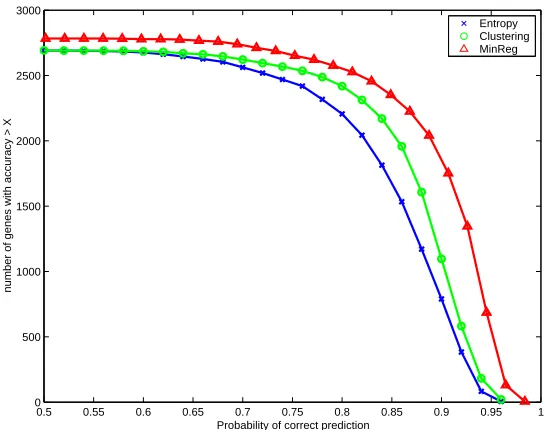
We compared the likelihood of test data in several different models. As a baseline, we used the marginal probability of each variable to predict its value. Since most of the variables had a high frequency of the value 0 (their corresponding gene’s expression remained unchanged most of the time), even this simple predictor scored well (Figure 5, crosses). As competition to our MinReg algorithm, we generated 44 clusters using standard k-means clustering (Duda and Hart, 1973; Tava-zoie et al., 1999) and randomly chose from within each cluster a gene r∈
C
as its “regulator”. For each cluster we used P(X|r)as our predictor. While cluster representatives somewhat improved the prediction over the baseline (0.06 log-loss/instance, Figure 5, circles), our MinReg algorithm clearly provided the best predictions (0.11 log-loss/instance, Figure 5, triangles). In conclusion, our cross-validation demonstrates that the model generated by the MinReg algorithm performs well on8. This assumption is made implicitly by the classic and widely used greedy Bayesian network learning algo-rithm (Heckerman, 1998), that considers greedy moves of adding, removing and reversing a single edge at each step.
0.5 0.55 0.6 0.65 0.7 0.75 0.8 0.85 0.9 0.95 1 0
500 1000 1500 2000 2500 3000
Probability of correct prediction
number of genes with accuracy > X
Entropy Clustering MinReg
Figure 5: Cross validation of the predictive capabilities of our model on test data. The graph measures the number of variables correctly predicted at each probability. We compare our model (triangles) to the null model (crosses) that uses the marginal distribution of each variable and to a model based on cluster representatives (circles)
test data and that most of the information in an entire microarray can be captured by a small set of key regulators.
4.1.3 SYNTHETICDATA
To evaluate the accuracy of the MinReg algorithm in a controlled setting, we generated synthetic data from a known regulation network. This gives a known ground truth to which we can compare the learned models. To make the data realistic, we generated synthetic data from the regulation model inferred from the yeast gene expression data above. While the inferred network is less com-plex than a true biological network, both share the same underlying probability distribution of the discretized data. We randomly sampled 10 data sets from this regulation model, each set consisting of 358 samples (same number of samples as the original data set). We tested MinReg’s ability to reconstruct the correct network independently on each of these 10 synthetic data sets.
Our first test evaluated MinReg’s choice of regulators. On average (over 10 repeats), MinReg correctly reconstructed 84% (39) of the generating 44 regulators. The worst case was 80% (35) and best case 91% (40). As for false positives, on average 74% of the reconstructed regulators were correct (worst case 71% and best case 77%).
candidate regulators (setting
C
=X
) our reconstruction of regulators was surprisingly good, 42/47 of the regulators were correct and 76% of the individual edges were correctly reconstructed.In summary, using only a small number of samples, MinReg is capable of learning a model over thousands of variables, reconstructing most of the relationships correctly.
4.2 Biological Evaluation
The crucial test for the success of our approach is in reconstructing the main aspects of a real regulatory program. The true underlying biology is vastly more complex than the simple regulation model that generated the synthetic data. In a real biological system, there are more regulators working together in more complex functions, feedback loops, and unobserved events. Furthermore, the expression data probing these is noisy. Unfortunately, since our knowledge on the principles and specifics of real regulatory networks is limited, so is our ability to test our model based on “realistic” simulated data. Due to this lack of biological knowledge we also do not have a gold standard network in any organism.
Fortunately, while evaluating each specific connection is impossible at the moment, we can estimate whether our model has correctly captured the overall biological regulatory events in the system. To do this, we rely on the functional annotations available for many genes, which describe (using the controlled vocabulary of the Gene Ontology (Consortium, 2000)) the molecular function, biological process and cellular location of individual genes. Thus, as described below, we will evaluate our reconstructed model by the ability to use it to correctly deduce the functional annotation of regulators, and by the fit of these annotations to the relevant biological system. Importantly, such functional characterization of key regulators is a critical biological task in its own right.
4.2.1 ANNOTATINGREGULATORS
Our approach is based on the understanding that the biological function of a regulator is mediated by its set of targets. Therefore, the common shared function of its set of targets (e.g. enzymes involved in amino acid (AA) metabolism) characterizes the overall biological process it regulates (e.g. amino acid metabolism). Continuing with the AA metabolism example, if our reconstructed model is good, we expect a regulator of AA metabolism to have many inferred targets involved in AA metabolism. More generally, we expect that the function associated with a regulator based on its set of targets in the model (as reflected by significant enrichment for a particular annotation) will fit with the known function of this regulator (as reflected by its own annotation).
More formally, we denote by
X
r the set of targets of a regulator r in our network structure.For each annotation term A, we calculate the fraction of genes in
X
rassociated with A and use thehyper-geometric distribution to calculate a p-value for this fraction. We report for each regulator, all the significant annotation terms with which it was associated and compare them to the known annotations for that regulator, and to the main functions expected in the biological systems we examine.
4.2.2 EVALUATING THEYEAST REGULATORYNETWORK
to one previously uncharacterized gene, but failed to identify the correct role of the other.10 Further-more, we examined numerous individual edges underlying these derived associations demonstrating that they are indeed supported by previously described regulator-target relations, lending support to our global analysis.
Additionally, the sequence motif representing binding site preference, is known for many yeast transcription factors. As an additional source of validation for MinReg’s target sets, we use a puta-tive map that uses these motif models to predict the gene targets of these transcription factors (Har-bison et al., 2004). Similarlly to testing enrichment for GO annotations, we tested for enrichment of motifs in the promoter regions in each target set. In the case of signaling proteins, we tested for enrichment of the known transcription factor target activated by the signaling protein (see figure 1). A correct match between regulator and motif was found for 6 of the top 8 regulators,11Sst2 (Ste12), Met28, Uga3, Slt2 (Rlm1), Tpk2 (Msn2/4), and Tec1. Together the correct functional annotation and the occurance of the known motif in the regulatory regions, strongly support the quality of our reconstructed network. A more detailed and biologically oriented analysis of a simplified version of the proposed algorithm has been published in (Pe’er et al., 2002).
4.2.3 THEIMPORTANCE OFCANDIDATEREGULATORS
The pre-defined set of candidate regulators, C, is the only source of prior biological knowledge to our algorithm. In addition to focusing the model on regulatory relations, it narrows the search space and significantly reduces the running time of the algorithm (which is quadratic in the size of candidate set).
To assess the impact of this prior knowledge on MinReg’s success, we examined MinReg’s bio-logical accuracy when run on the yeast data set, in the absence of a pre-defined candidate regulator set (i.e.
C
=X
, such that any gene can be chosen as a regulator).12 MinReg chose 35 regulators, only 6 of which were in the original candidate regulator set. This lack of “true” regulators suggests the expression of co-regulated genes is often at least as predictive (and sometimes even more) than that of the true regulating gene. While this model might be highly predictive and even generalizes well to new data, it does not reconstruct biological regulation, and is difficult to interpret.Nevertheless, while 356 is only a small fraction of the chosen regulators, this is a significant en-richment compared to their fraction in the candidate set (pvalue 0.003). The fact that our procedure results in a statistically significant enhancement of regulators is encouraging. We speculate that in complex organisms, where combinatorial regulation is expected to play a bigger role, this approach will be even more successful in detecting genes with a regulatory function.
4.3 Analysis of Mouse Data
In contrast to the significant success of several methods in reconstructing yeast regulatory networks, no algorithm has so far successfully reconstructed a mammalian regulatory network. To examine
10. The results for the top 20 regulators are of similar quality: the associations for 13 regulators correspond their known function,four regulators were previously uncharacterized and the associations for three regulators are unsupported. 11. These are 8/10 regulators we evaluated for gene function above, excluding 2 regulators for which no motif is currently
known.
12. Since the algorithm is quadratic inC, we reducedX by including only genes whose expression significantly changed
in≥18 samples (versus 15 samples). This resulted in a set of 2828 genes for bothX andC. It is important to note
whether MinReg can scale up to the challenge of a mammalian system, we evaluated the biological accuracy of its reconstruction of a B-lymphocyte regulatory network.
We first examine whether the key regulators identified by the algorithm are known to participate in the main biological process taking place in B lymphocytes under the tested stimuli- the decision between cell proliferation and cell death. Indeed, the inferred regulator set
R
includes the top five genes - Trp53, Nfkb1, Jun, Fos and Bak1 - known to play a pivotal role in this decision. 16 additional inferred regulators are known to be directly involved in the regulation of proliferation and cell death13and seven others are involved in the regulation of the cell division cycle.14 Overall, 28/75 regulators are known to participate in regulation of the central process occurring in these cells. Importantly, in multi-cellular organisms such as mouse, each cell type is characterized by a distinct regulatory network (although some of the sub-systems may be used in different types of cells). Indeed, 28 of the 75 inferred regulators are known to be involved in lymphocyte regulation: 7 genes (Nfkb1, Jun, Fos, Daxx, Syk, Gnai2, Csf1r) are known central regulators in B-lymphocytes, 15 genes are known to be active in the regulation of lymphocytes in general, and 6 others encode cytokines and their receptors (important in the regulation of immune cells, including lymphocytes). Taken together, this analysis indicates that 44 of the 75 inferred regulators are known regulators of lymphocytes, cell proliferation and death or both.15 This suggests, that when applied to a complex mammalian data set, MinReg is able to identify the key regulatory genes active in this system. Finding such central regulatory genes is still a major biological task in most systems.We next examined the quality of our model structure, based on its ability to predict the detailed function of individual regulators (as described above for yeast). For each regulator, we compared the 3 top significant annotation terms (P<0.05) based on its predicted targets with its known annotation terms (typically 5-6 per regulator). We defined 5 different categories16and evaluated the significance of our results by comparing to the null model of randomly assigning each regulator with 3 GO annotations (out of 2694 annotations tested). Based on these criteria the predicted function for over half (45/75) the regulators had at least some support in prior biological knowledge. Specifically, the predicted functional annotation of 6/75 regulators was “very good” (P<10−18), “good” for 28/75 additional regulators (P<10−35), and “weak” for 11/75 genes. 12/75 genes had “no match” to any annotations, but many of them were genes encoding relatively uncharacterized regulators with little or no known annotations. Importantly, only 16 of 75 regulators were assigned no significant annotation, indicating the biological coherence of our reconstructed model, where regulators are associated with functionally related targets.
To illustrate the quality of our findings, we highlight several specific examples. First, we note that some of the “very good” annotations demonstrate that MinReg can provide an extensive biolog-ical characterization of the regulatory function of genes. For example, our model indicates that the protein Map3k1 functions in the MAP Kinase Signaling Pathway has a signal transducer activity and works in the Growth factor signaling pathway. Importantly, the model also identified several of Map3k1’s targets, including Fos and Nfkb1. This is a highly accurate characterization of the
13. They are Aaft, Daxx, Foxo1, Gadd45g, Gnai2, Hipl2, Igbp1, Il2rh, Jund1, Itgb4, Map3k1, Rgs15, Rras2, Rsu1, Socs1, and Zmynd11.
14. They are Ax1, Camk2b, Csfir, Elk3, Maf, Tbl1, Rgs2, and Tbl1.
15. We expect that many of the other inferred regulators may be just as correct, and are simply not characterized by current biological knowledge. They suggest therefore novel biological hypotheses for experimental validation. 16. Our categories are: “Very good” (more than one exact match); “good” (1 exact match), “weak” (1 approximate match
molecular function of this protein, and of its biological regulatory role. Since Map3k1 is a signaling protein (rather than a transcription factor) this is a particularly important achievement, since direct assays of regulatory function (based on cis-elements and protein-DNA binding) cannot help in this task. Indeed, our method detects and correctly associates a whole range of regulators - including transcription factors, kinases and phosphotases. For example, Aatf, the apoptosis antagonizing tran-scription factor, is correctly associated with the apoptotic pathway and the mitotic cell cycle. Dusp4, the dual specificity phosphatase 4, is correctly associated with protein-tyrosine-phosphatase activity and MAPK signaling pathway. Finally, we emphasize that the main benefit of our approach is in suggesting novel hypotheses for further research. Thus, “weak” and “no match” associations may present the most important biological leads emanating from MinReg’s results. For example, the Jun oncogene (assigned to the “Weak” category), was predicted by our method to be involved in the Oncogene associated pathway and Cell proliferation and differentiation. While multiple abstracts in the published literature clearly and strongly support these two associations, Jun’s current GO annotation includes neither.
4.3.1 COMPARISON TOMODULENETWORKS
Does MinReg have significant benefits in reconstructing mammalian regulatory networks over other (related) reconstruction approaches? To address this question, we compared MinReg’s performance on the B-lymphocyte data set to that of the Module Networks algorithm (Segal et al., 2003, 2005). Similar to MinReg, Module Networks associates a regulator to its targets based solely on depen-dencies in gene expression. However, while MinReg considers each target gene separately, Module Networks groups targets into sets (“modules”), such that all module genes share exactly the same regulatory program. In previous work (Segal et al., 2003), Module Networks was shown to be highly successful in reconstructing the yeast stress regulatory network. Here, we applied Module networks to the B-lymphocyte data and learn 75 modules and their associated regulation programs, involving 216 regulators overall. While many of the regulators overlapped those chosen by the MinReg al-gorithm,17these did not include 3 of the 5 known central regulators of cell proliferation and death (Nfkb1, Fos, nor Bak1) identified by MinReg.
For comparison, we can evaluate the Module Networks model by annotating each of its 206 regulators based on its associated targets (compiled across all 75 modules), resulting in 196 signifi-cantly annotated regulators. When evaluating the annotation quality of the top 75 regulators (sorted by p-value) by the same scale described above, we did not receive similarly significant results. In fact, only 13/75 genes had any support in prior biological knowledge (1/75 scored “very good”, 7/75 scored “good”, and 5/75 scored “weak”). Furthermore, when examining only regulators identified by both algorithms, MinReg’s associations outperform Module networks on 23 regulators, while Module networks only found a better association for one regulator (Gnai13). Thus, in the spe-cific task of characterizing the molecular function and biological process controlled by a regulator, MinReg overwhelmingly outperforms Module Networks in this mammalian data set. This suggests that the detailed network and regulatory targets identified by MinReg are more accurate than those discovered by Module Networks.
What may be the underlying reason for MinReg’s success over Module Networks? The central goal of Module networks is to decompose the space of all genes into functionally coherent
regulated modules, at the “cost” of constraining them to share exactly the same set of regulators. While this constraint increases the statistical robustness and biological coherence (leading to a major success on yeast data), it may be less suited to complex mammalian regulatory systems. In contrast, MinReg focuses on finding the most dominant regulators and their targets in the data. A regulator is only assigned to a target if that specific edge is sufficiently supported by the data 18 and each gene chooses its unique set of regulators. We believe these two reasons combined led to MinReg’s superior performance in regulatory reconstruction.
5. Discussion and Conclusions
We have introduced the MinReg framework, a constrained Bayesian network for the reconstruction of regulatory networks. The framework limits the total number of parents in the model, thus focus-ing on only a small parsimonious set of key regulators. We exploit these constraints to devise a novel efficient approximation algorithm to search for a high scoring network from expression data. Under reasonable assumptions on the underlying probability distribution, we can prove guarantees on our algorithm’s performance. To derive these guarantees, we introduce the notion of α-modularity, a convexity measure of the scoring function over the space of possible parent sets. Approximation algorithms with a performance guarantee rarely exist for Bayesian networks (Dasgupta, 1999) and we hope this measure can be used to derive addition performance bounds for other sub-classes of Bayesian networks.
Machine learning in the gene expression domain is especially challenging as it requires learning structures over thousands of variables using at most hundreds of samples. Our extensive experi-mental results on real expression data demonstrate that our framework is up to this challenge: we successfully infer regulatory relations over thousands of genes within minutes. Our results are validated by statistical criteria (synthetic data, cross-validation) and biological ones (our ability to correctly infer a correct set of key regulators and their detailed regulatory functions). Importantly, unlike previous approaches, our method scales well to complex mammalian systems, discovering key mammalian regulators (both signaling proteins and transcription factors) solely from expression data.
While constraining the number of regulators carries obvious statistical and computational ad-vantages, what does it cost us in biological accuracy? We claim that the focus on a small and parsimonious regulatory set is as motivated biologically as it is statistically. Most importantly, any complex biological network involves a multitude of genes and proteins, but biologists’ primary goal is most typically to find the central genes, that play the most important functional role in the system. In fact, a full and accurate model of the exact network at a given point, may fail to highlight those central genes. Rather, by focusing on a small set of key regulators, MinReg can provide clear critical leads for further research. Indeed, our analysis of the B lymphocyte data set indicates that MinReg is able to focus on the very key regulators of a complex process (cell proliferation and death) as well as on a significant number of cell specific regulators. Using an established “guilt-by-association” approach (Wu et al., 2002; Ihmels et al., 2002), we further capitalize on the learned structure, and identify the accurate functional roles of these proteins in regulating cellular processes. This is a major feat, never before accomplished by a computational algorithm for a mammalian system. Im-portantly, MinReg is not only superior to standard clustering, but it overwhelmingly outperforms in this task the recently published Module Network algorithm (Segal et al., 2005).
Our method relies on the assumption that regulatory interactions between genes often result in corresponding statistical dependencies between random variables representing their expression. Recently, there have been a number of successful attempts to use other data sources - such as cis-elements (Bussemaker et al., 2001; Segal et al., 2002) and transcription factor binding events (Bar-Joseph et al., 2003) to infer regulatory relations in yeast. However, these successes cannot scale well to mammalian systems, in which computational detection of cis-elements is far less tractable (due to long and ill-defined promoters), and experimental detection of binding events is currently very limited (due to the genome size and the difficulty in carrying such experiments in vivo). In contrast, the collection of mammalian expression data is growing at an exponential rate, and methods such as MinReg that rely solely on gene expression for network reconstruction are direly needed.
MinReg lies between two graphical model based approaches for learning regulatory networks: unconstrained Bayesian networks and Module Networks Segal et al. (2005). While unconstrained Bayesian networks allow for a reconstruction of finer structure, they have only been successful at reconstructing small networks or subnetworks consisting of only a few variables Pe’er et al. (2001); Hartemink et al. (2002); Imoto et al. (2002). In contrast, MinReg and Module Networks can reconstruct a network over thousands of variables, based on the assumption that a small number of regulators can be chosen from a pre-defined candidate set. All three approaches, assume that regulator expression can be a proxy for its activity. Bioinformatics validation (of all approaches), and experimental validation (of Module Networks (Segal et al., 2003)) indicates that they can be at least partly successful in this task. This success is somewhat surprising, since actual protein activity depends on many biochemical events in addition to mRNA transcription.
What accounts for the significant success of MinReg compared to Module networks in mam-malian network reconstruction? In the Module Network approach, genes are grouped into modules, thus losing their individual identity and distinction. MinReg provides a finer structure, allowing each gene an individual set of parents and regulatory function. Many recent biological papers stress the importance of modularity in biological networks (Hartwell et al., 1999; Ihmels et al., 2002; Se-gal et al., 2003; Bar-Joseph et al., 2003). Such organization facilitates orchestrating coordinated responses to external and internal signals by co-regulating genes that participate in a common func-tion or task. While modularity may be a general organizing principle of regulatory networks, it may be too coarse grained on it own to represent the complex coordination between multiple genes and biological process. Rather, complex mammalian regulation is probably orchestrated by few key regulators, which combine together to regulate the genome, one target at a time through its unique regulatory program.
References
Z. Bar-Joseph, G. K. Gerber, T. I. Lee, N. J. Rinaldi, J. Y. Yoo, F. Robert, D. B. Gordon, E. Fraenkel, T. S. Jaakkola, R. A. Young, and D. K. Gifford. Computational discovery of gene modules and regulatory networks. Nature Biotechnology, 21:1337–42, Nov 2003.
H. Bussemaker, H. Li, and E. Siggia. Regulatory element detection using correlation with expres-sion. Nature Genetics, 27(2):167–171, 2001.
The Gene Ontology Consortium. Gene ontology: tool for the unification of biology. Nature Genet-ics, 25(1):25–29, 2000.
G. F. Cooper and E. Herskovits. A Bayesian method for the induction of probabilistic networks from data. Machine Learning, 9:309–347, 1992.
S. Dasgupta. Learning polytrees. In Proceedings of the Fifteenth Annual Conference on Uncertainty in Artificial Intelligence (UAI). 1999.
R. O. Duda and P. E. Hart. Pattern Classification and Scene Analysis. John Wiley & Sons, New York, 1973.
N. Friedman, M. Linial, I. Nachman, and D. Pe’er. Using Bayesian networks to analyze expression data. Journal of Computational Biology, 7:601–620, 2000.
A. P. Gasch, P. T. Spellman, C. M. Kao, O. Carmel-Harel, M. B. Eisen, G. Storz, D. Botstein, and P. O. Brown. Genomic expression program in the response of yeast cells to environmental changes. Mol. Bio. Cell, 11:4241–4257, 2000.
C. T. Harbison, D. B. Gordon, T. I. Lee, N. J. Rinaldi, Macisaac K. D., T. W. Danford, N. M. Hannett, J. B. Tagne, D. B. Reynolds, J. Yoo, E. G. Jennings, J. Zeitlinger, D. K. Pokholok, M. Kellis, P. A. Rolfe, K. T. Takusagawa, E. S. Lander, D. K. Gifford, E. Fraenkel, and R. A. Young. Transcriptional regulatory code of a eukaryotic genome. Nature, 431:99–104, 2004.
A. J. Hartemink, D. K. Gifford, T. S. Jaakkola, and R. A. Young. Combining location and ex-pression data for principled discovery of genetic regulatory networks. In Pacific Symposium on Biocomputing, pages 437–449, 2002.
L. H. Hartwell, J. J. Hopfield, S. Leibler, and Murray A. W. From molecular to modular cell biology. Nature, 2, Dec 1999.
D. Heckerman. A tutorial on learning with Bayesian networks. In M. I. Jordan, editor, Learning in Graphical Models. Kluwer, Dordrecht, Netherlands, 1998.
D. Heckerman, D. Geiger, and D. M. Chickering. Learning Bayesian networks: The combination of knowledge and statistical data. In Proceedings of the Tenth Annual Conference on Uncertainty in Artificial Intelligence (UAI), pages 293–301. 1994.
T. R. Hughes, M. J. Marton, A. R. Jones, C. J. Roberts, R. Stoughton, C. D. Armour, H. A. Bennett, E. Coffey, H. Dai, Y. D. He, M. J. Kidd, A. M. King, M. R. Meyer, D. Slade, P. Y. Lum, S. B. Stepaniants, D. D. Shoemaker, D. Gachotte, K. Chakraburtty, J. Simon, M. Bard, and S. H. Friend. Functional discovery via a compendium of expression profiles. Cell, 102(1):109–26, 2000.
J. Ihmels, G. Friedlander, S. Bergmann, O. Sarig, Y. Ziv, and N. Barkai. Revealing modular organi-zation in the yeast transcriptional network. Nature Genetics, 31:370–7, Aug 2002.
T. I. Lee, N. J. Rinaldi, F. Robert, D. T. Odom, Z. Bar-Joseph, G. K. Gerber, N. M. Hannett, C. T. Harbison, C. M. Thompson, I. Simon, J. Zeitlinger, E. G. Jennings, H. L. Murray, D. B. Gordon, B. Ren, J. J. Wyrick, J. B. Tagne, T. L. Volkert, E. Fraenkel, D. K. Gifford, and R. A. Young. Transcriptional regulatory networks in saccharomyces cerevisiae. Science, 298:799–804, 2002.
B. Lehmann, D. Lehmann, and N. Nisan. Combinatorial auctions with decreasing marginal utilities. In ACM Conference on Electronic Commerce, pages 18–28, 2001.
A. Martinez-Antonio and J. Collado-Vides. Identifying global regulators in transcriptional regula-tory networks in bacteria. Current Opinion Microbioly, 6(5):482–9, 2003.
I. M. Ong, J. D. Glasner, and D. Page. Modelling regulatory pathways in e. coli from time series expression profiles. Bioinformatics, 18 Suppl 1:S241–S248, 2002.
D. Pe’er, A. Regev, G. Elidan, and N. Friedman. Inferring subnetworks from perturbed expression profiles. Bioinformatics, 17 Suppl 1:S215–S224, 2001.
D. Pe’er, A. Regev, and A. Tanay. Minreg: Inferring an active regulator set. Bioinformatics, 18 Suppl 1:S258–S267, 2002.
G. R. Sambrano, G. Chandy, S. Choi, D. Decamp, R. Hsueh, K. M. Lin, D. Mock, N. O’Rourke, T. Roach, H. Shu, B. Sinkovits, M. Verghese, and H. Bourne. Unravelling the signal-transduction network in b lymphocytes. Nature, 420:708–710, Dec 2002.
E. Segal, Y. Barash, I. Simon, N. Friedman, and D. Koller. From promoter sequence to expression: A probabilistic framekwork. In RECOMB, pages 263–272. 2002.
E. Segal, D. Pe’er, A. Regev, D. Koller, and N. Friedman. Learning module networks. Journal of Machine Learning Research, 6:557–588, April 2005.
E. Segal, M. Shapira, A. Regev, D. Pe’er, D. Botstein, D. Koller, and N. Friedman. Module net-works: identifying regulatory modules and their condition specific regulators from gene expres-sion data. Nature Genetics, 34:166 – 176, 2003.
S. S. Shen-Orr, R. Milo, S. Mangan, and U. Alon. Network motifs in the transcriptional regulation network of escherichia coli. Nature Genetics, 31(1):64–8, 2002.
S. Tavazoie, J. D. Hughes, M. J. Campbell, R. J. Cho, and G. M. Church. Systematic determination of genetic network architecture. Nat Genet, 22(3):281–5, 1999.
L. F. Wu, T. R. Hughes, A. P. Davierwala, M. D. Robinson, R. Stoughton, and S. J. Altschuler. Large-scale prediction of saccharomyces cerevisiae gene function using overlapping transcrip-tional clusters. Nature Genetics, 31:255–265, 2002.