SHIV SHAKTI
International Journal of in Multidisciplinary and
Academic Research (SSIJMAR)
Vol. 4, No. 2, April 2015 (ISSN 2278 – 5973)
Application of project scheduling and Cost analysis
Using PERT and CPM
S.Shanmugasundaram
Assistant Professor, Department of Mathematics, Government Arts College (A), Salem.(TN)
V.Mathan Kumar
Assistant Professor, Department of Mathematics, Sri Ganesh College of Arts & Science, Salem.
Impact Factor = 3.133 (Scientific Journal Impact Factor Value for 2012 by Inno Space Scientific Journal Impact Factor)
Global Impact Factor (2013)= 0.326 (By GIF)
Indexing:
Abstract:
Crashing is reducing project time by expending additional resources. Crashing the network is the
contracting or compressing the network that means to reduce project duration at minimum cost with
minimum project duration. It is found that there is a project schedule to determine the optimum cost
and time by CPM/PERT network analysis. In this paper we use optimum crashing method to
minimize the required cost while attaining a specified completion time.
Keywords: Crashing, Critical Path, Cost slope value, Time-cost Trade off
I-INTRODUCTION
Project management is a tool that is used by many companies to help improve performance and
competitiveness. Projects and their execution, in general, require resources. An important aspect of
project management is risk management. Different types of risk are present in any given project, but
the emphasis of this research will be focused on schedule/time risk and associated costs. The
schedule/time risk essentially implies not completing project activities on time, resulting in a late
completion of the project. Late project completion generally has negative effects for the company such
as penalty costs and customer dissatisfaction. Two of the most popular approaches to Project
management are the critical path method (CPM) and Project Evaluation and Review Technique
(PERT), which were developed short after the World War II. The critical path method (CPM) and
Project Evaluation and Review Technique (PERT) methods have been used since the 1950s to estimate
the completion time of a project.
II-Crashing
Crashing is a compression technique applied in project scheduling to shorten the project or activity
duration by exploring alternatives to apply maximum schedule compression at least additional cost.
An example of crashing is adding resources to the critical path tasks. The project manager is
frequently confronted with having to reduce the scheduled completion time of a project to meet a
deadline. In other words, the manager must finish the project sooner than indicated by the
CPM/PERT network analysis. Project crashing is a method for shortening the project duration by
reducing the time of one (or more) of the critical project activities to less than its normal activity time.
This reduction in the normal activity time is referred to as crashing.
III-Activity time-cost relationship
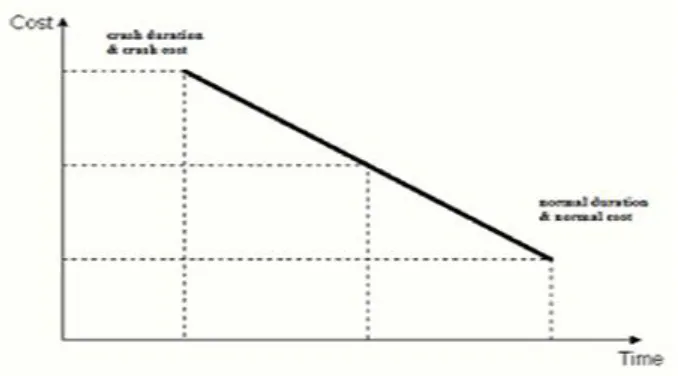
A simple representation of the possible relationship between the duration of an activity and its direct
costs appears in Figure 1. Considering only this activity in isolation and without reference to the
project completion deadline, a manager would choose a duration which implies minimum direct cost,
called the normal duration. At the other extreme, a manager might choose to complete the activity in
the minimum possible time, called crashed duration, but at a maximum cost. The linear relationship
shown in the Figure 1 between these two points implies that any intermediate duration could also be
Fig 1: Linear time/cost trade-off for an activity
may represent the ideal or optimal trade-off between time and cost for this activity. The slope of the
line connecting the normal point (lower point) and the crash point (upper point) is called the cost
slope of the activity. The slope of this line can be calculated mathematically by knowing the
coordinates of the normal and crash points.
Cost slope = crash cost – normal cost / normal duration – crash duration
IV-Steps to approach the Crashing Network
1. Calculate cost slope of each activity of the project.
2. Identify critical path and find the expected duration of the project.
3. Select among the activities on critical path an activity which has least cost slope. For more than
one critical path, select one activity on each critical path such that total cost of crashing all these
activities is minimum among all such combinations of activities.
4. Reduce the activity time of the selected activity progressively until either crashed time reached or
the previous non-critical parallel path becomes critical.
5. Proceed above steps until there is at least one critical path on which none of the activities can be
further crashed.
Example:
The following table gives data on normal time and cost, Crash time and cost for a project.
TABLE: 1
Activity
Normal Crash
Time
(weeks)(NT)
Cost(Rs.)
(NC)
Time
(weeks)(CT)
Cost(Rs.)
(CC)
1-2 8 7000 3 10000
1-3 4 6000 2 8000
2-3 0 0 0 0
2-5 6 9000 1 11500
3-4 7 2500 5 3000
4-6 12 10000 8 16000
5-6 15 12000 10 16000
6-8 5 10000 5 10000
7-8 14 6000 7 7400
7-9 8 6000 5 12000
8-9 6 6000 4 7800
Total Cost=Rs.86500
The indirect cost per week is Rs.1000
1. Draw the network for the project & critical path
2. Find the optimum time and optimum cost
3. Determine minimum total time & corresponding cost.
TABLE: 2
Activity
Normal Crash
∆T ∆C ∆C/∆T Time
(weeks)
(NT)
Cost(Rs.)
(NC)
Time
(weeks)
(CT)
Cost(Rs.)
(CC)
1-2 8 7000 3 10000 5 3000 600
1-3 4 6000 2 8000 2 2000 1000
2-3 0 0 0 0 0 0 0
2-5 6 9000 1 11500 5 2500 500
3-4 7 2500 5 3000 2 500 250
4-6 12 10000 8 16000 4 6000 1500
5-6 15 12000 10 16000 5 4000 800
5-7 7 12000 6 14000 1 2000 2000
6-8 5 10000 5 10000 0 0 0
7-8 14 6000 7 7400 7 1400 200
7-9 8 6000 5 12000 3 6000 2000
8-9 6 6000 4 7800 2 1800 900
1. Draw the network of the proposed project.
6 7
8 8
0 15 14
6
4
7 12 5
Critical path starting towards end
1
8
3 4 6
2 5 7
Activity Duration Total
1-2 2-5 5-7 7-9 8 6 7 8 29
1-2 2-5 5-7 7-8 8-9 8 6 7 14 6 41
1-2 2-5 5-6 6-8 8-9 8 6 15 5 6 40
1-2 2-3 3-4 4-6 6-8 8-9 8 0 7 12 5 6 38
1-3 3-4 4-6 6-8 8-9 4 7 12 5 6 34
1→2→5→7→9 =29 weeks,
1→2→5→6→8→9 =40 weeks,
1→2→3→4→6→8→9 =38 weeks,
1→4→4→6→8→9 =34 weeks,
1→2→5→7→8→9 =41 weeks it is critical path (CPM) of the project duration.
2. Optimum time and Optimum cost.
Step:1
Crashing in activity 7-8 in 1 week
Now we are identified their activity in critical path which can be crashed with the lowest cost
slope that are to be choose as list activity 7-8 ,∆C/∆T =200.
Activity Duration Total
1-2 2-5 5-7 7-9 8 6 7 8 29
1-2 2-5 5-7 7-8 8-9 8 6 7 13 6 40 1-2 2-5 5-6 6-8 8-9 8 6 15 5 6 40
1-2 2-3 3-4 4-6 6-8 8-9 8 0 7 12 5 6 38
1-3 3-4 4-6 6-8 8-9 4 7 12 5 6 34
Step:2
Crashing in activity 2-5 in 2 weeks
Activity Duration Total
1-2 2-5 5-7 7-9 8 4 7 8 27
1-2 2-5 5-7 7-8 8-9 8 4 7 13 6 38 1-2 2-5 5-6 6-8 8-9 8 4 15 5 6 38 1-2 2-3 3-4 4-6 6-8 8-9 8 0 7 12 5 6 38
Step:3
Crashing in activity 1-2 in 4 weeks
Activity Duration Total
1-2 2-5 5-7 7-9 4 4 7 8 23
1-2 2-5 5-7 7-8 8-9 4 4 7 13 6 34 1-2 2-5 5-6 6-8 8-9 4 4 15 5 6 34 1-2 2-3 3-4 4-6 6-8 8-9 4 0 7 12 5 6 34 1-3 3-4 4-6 6-8 8-9 4 7 12 5 6 34
Step:4
Crashing in activity 8-9 in 2 weeks
Activity Duration Total
1-2 2-5 5-7 7-9 4 4 7 8 23
1-2 2-5 5-7 7-8 8-9 4 4 7 13 4 32 1-2 2-5 5-6 6-8 8-9 4 4 15 5 4 32 1-2 2-3 3-4 4-6 6-8 8-9 4 0 7 12 5 4 32 1-3 3-4 4-6 6-8 8-9 4 7 12 5 4 32
Step:5
Crashing in activity 2-5 in 2 weeks and activity 3-4 in 2 weeks
Activity Duration Total
1-2 2-5 5-7 7-9 4 2 7 8 21
1-2 2-5 5-7 7-8 8-9 4 2 7 13 4 30 1-2 2-5 5-6 6-8 8-9 4 2 15 5 4 30 1-2 2-3 3-4 4-6 6-8 8-9 4 0 5 12 5 4 30 1-3 3-4 4-6 6-8 8-9 4 5 12 5 4 30
Step:6
Crashing in activity 1-2 in 1 week and activity 1-3 in 1 week
Activity Duration Total
1-2 2-5 5-7 7-9 3 2 7 8 20
Step:7
Crashing in activity 2-5 in 1 week and activity 4-6 in 1 week
Activity Duration Total
1-2 2-5 5-7 7-9 3 1 7 8 19 1-2 2-5 5-7 7-8 8-9 3 1 7 13 4 28 1-2 2-5 5-6 6-8 8-9 3 1 15 5 4 28 1-2 2-3 3-4 4-6 6-8 8-9 3 0 5 11 5 4 28 1-3 3-4 4-6 6-8 8-9 3 5 11 5 4 28
Step:8
Crashing in activity 7-8 in 3 weeks, activity 5-6 in 3 weeks and activity 4-6 in 3 weeks
Activity Duration Total
1-2 2-5 5-7 7-9 3 1 7 8 19
1-2 2-5 5-7 7-8 8-9 3 1 7 10 4 25 1-2 2-5 5-6 6-8 8-9 3 1 12 5 4 25 1-2 2-3 3-4 4-6 6-8 8-9 3 0 5 8 5 4 25 1-3 3-4 4-6 6-8 8-9 3 5 8 5 4 25
The above results are summarized in the table below:
Activity
Crashed
No.of
Week
Crash Repr
es ent step Weeks saved in project P rojec t Dur ati on Normal Direct cost (DC) Rs. Indirect cost (IC) Rs. Crash Cost (CC) Rs. Total cost= CC+IC+CC Rs.
CPM - Fig:4 - 41 86500 41X1000
=41000 0 127500
7-8 1 step:1 1 40 86500 40X1000
=40000
1X200=20
0 126700
2-5 2 step:2 2 38 86500 38X1000
=38000
200+
(2X500)
=1200
125700
1-2 4 step:3 4 34 86500 34X1000
=34000
1200+
(4X600)
=3600
8-9 2 step:4 2 32 86500 32X1000 =32000
3600+
(2X900)
=5400
123900
2-5 2
step:5 2 30 86500 30X1000 =30000
5400+ (2X500) +(2X250) =6900
123400 3-4 2
1-2 1
step:6 2 29 86500 29X1000
=29000
6900+
(1X600)
+(1X1000)
=8500
124000
1-3 1
2-5 1
step:7 1 28 86500 28X1000
=28000
8500+
(1X500)
+(1X1500)
=10500
125000
4-6 1
7-8 3
step:8 3 25 86500 25X1000 =25000
10500+ (3X200)+ (3X800)+ (3X1500) =18000
132500 5-6 3
4-6 3
V-Results
The above table indicates,
the normal duration of the project is 41weaks and the corresponding cost is Rs.1, 27,500/-,
the optimum duration of the project is 30weaks and the corresponding cost is Rs.1,23,400/-,
the minimum duration of the project is 25weaks and the corresponding cost is Rs.1,32,500/.
VI- Conclusion
The time network is shown in above steps all the activities are fully crashed. Thus the minimum
project duration is 25 weeks. The maximum (complete) crashing of the network from 41 weeks to 25
weeks. We see that all the activities on the critical path which could be crashed as per the given
condition have been possible to further crash the project network.
REFERENCES
[1] Kishan Mehrotra , John Chai and Sharma Pillutla, A study of approximating the moments of job
completion time in PERT networks in Electrical Engineering and computer Science Technical
[2] W.A. Haga, Tim O’keefe, Crashing PERT networks: a simulation approach, in: 4th International
Conference of the Academy of Business and Administrative Sciences, Quebec City, Canada, July 12–
14, 2001.
[3] Nasim Monjezi, Mohammad Javad Sheikhdavoodi and Hadi Basirzadeh, Application of Project
Scheduling in Agriculture (Case Study: Mechanized Greenhouses Construction Project) in Research
Journal of Applied Sciences,Engineering and Technology4(3):241-244,2012,ISSN:2040-7467.
[4] M Nazrul, Eugen and M Sharif, Project Completion Probability after crashing PERT/CPM
network.
[5] Ten Wei Peng, Mustafa bin Mamat, Yosza bin Dasril,An improvement of Numerical Result of
Crashing CPM/PERT Network in Journal of Science and Technology.
[6] Ms.Patricia D.Galloway,PE, CPM Scheduling and How the Industry Views its Use in
CDR.07,2005 AACE International Transactions.
[7] Nasim Monjezi,Mohammad Javad Sheikhdavoodi,Hadi Basirzadeh and Hassan
Zakidizaji,Analysis and Evaluation of Mechanized Greenhouse Construction Project using CPM
Methods in Research Journal of Applied Sciences ,Engineering and
Technology4(18):3267-3273,2012,ISSN:2040-7467.
[8] Siddharth Chatwal, Application of Project Scheduling in a Bottling Unit startup using PERT and
CPM Techniques in International Journal of Advanced Research in Engineering and Applied
Sciences,ISSN:2278-6252.
[9] Priti Singh, Florentin Smarandache, Dipti Chauhan ,Amit Bhaghel, A Unit Based Crashing Pert
Network For Optimization Of Software Project Cost.
[10] Nafish sarwar Islam, Complex Project Crashing Algorithm, IOSR Journal of Business and