Published online November 20, 2013 (http://www.sciencepublishinggroup.com/j/ogce) doi: 10.11648/j.ogce.20130103.11
Evaluation of giant new and mature oil fields
developments - history and prediction study for applying
horizontal wells using simulation and field practices
Taha Moustafa Moawad
Petroleum Engineering Department, Faculty of Petroleum and Mining Engineering, Suez University, Egypt
Email address:
To cite this article:
Taha Moustafa Moawad. Evaluation of Giant New and Mature Oil Fields Developments - History and Prediction Study for Applying Horizontal Wells Using Simulation and Field Practices. International Journal of Oil, Gas and Coal Engineering,
Vol. 1, No. 3, 2013, pp. 29-35. doi: 10.11648/j.ogce.20130103.11
Abstract:
Developing giant new and mature oil fields by horizontal drilling is one of the most valuable technologies employed nowadays since it can maximize mature field's benefits. Horizontal wells are offering multiple advantages including, higher production rates, better drainage, lower drawdown and delay water production. In addition, especially in offshore fields, horizontal wells compromise the ability to drill more multi-lateral wells from a single platform enhancing ultimate recovery because of reaching the bypassed oil buckets away from the offshore jackets reducing the number of vertical wells and minimizing offshore infrastructures reducing costs and time. These technologies have been, and will become an attractive topic for more studies and investigations. Development of mature fields, could be included into three major categories (a) well engineering (b) surface facilities and (c) reservoir engineering. This paper focuses on the reservoir engineering aspects and mainly on applying horizontal wells in giant mature fields to maximize their oil recovery. Field maturity in both well engineering and surface facilities will be the subject of next papers. The results have shown that, applying horizontal well drilling in giant mature fields is very crucial because of the horizontal well production improving factor (PIF), which represents the improvement of horizontal well production compared with vertical well production at the same locations, has been significantly increased. Horizontal well production improving factor (PIF) has increased with time along the reservoir life from pre-mature (virgin) to mature phases. In this study, it has increased from 1.23 to 1.28 during the last 9 years (2004-2012). However, simulation prediction results for next 9 years (2013-2021) have shown that, PIF has reached almost 5. That is because the oil column thickness become more thinner due to water movement through moving up toward the water oil contact and through high permeability streaks. As field practice, using pilot holes during drilling new infill and/or re-entry horizontal wells in mature oil fields is essential for successful high potential horizontal wells.Keywords:
Mature Oil Fields, Reservoir Simulation, Horizontal Wells, Production Improving Factor, Field Practices1. Introduction
Before implementing horizontal drilling in the giant new and matured oil and gas fields, it is absolutely necessary that each and every engineer fully comprehends the far-reaching advantages of this exciting technology to be used effectively. The role of horizontal drilling today is not only restricted to offer multiple advantages including, high production rates, better drainage, lower drawdown and delay water production, but also horizontal wells give the ability to drill more wells from a single platform in offshore fields. Many companies are coming forward to apply horizontal drilling for driving better results specially in
mature fields by enhancing ultimate recovery because of reaching the bypassed oil buckets away from the offshore existing jackets reducing the needed vertical wells number and minimizing offshore and infrastructures which could effectively reduce costs and time needed for exploiting oil fields.
Mature fields, in fact, are still representing the backbone of global oil production. Mature fields produce about two thirds of global daily average oil production and this percentage is increasing with time [1,2].
included in three major categories: (a) well engineering, including well integrity and well construction since aging of the used materials such as corrosion of casing; failure of cement and/or scaling through tubing or perforations can be causes for the field maturity, (b) surface facilities; including manifolds, pipe lines, separators,…etc. and (c) reservoir engineering; involving reservoir parameters such as reservoir initial and current pressures, water and oil production volumes, initial and residual oil and gas saturation.
This paper focuses on reservoir engineering aspects by studying horizontal well applications to maximize the oil recovery from giant new and mature fields. Investigation studies on field maturity in both well engineering and surface facilities and their improvements will be the subject of the next work. In addition, practical factors affecting the horizontal well efficiency based on experience in four matured reservoirs have been considered and compared. One of these four mature reservoirs, reservoir A, which has many different difficulties and challenges for new and re-entry horizontal wells has been deeply investigated. Horizontal well efficiency compared with vertical wells in past and future of giant new and matured reservoirs and their main controlling factors including suitable well length, well placement, water movements and field production network capabilities has been studied.
2. Work Methodology
A three dimensional simulation sector model has been constructed and applied for the present work to simulate a giant new and mature oil reservoirs. Under-saturated reservoir with rock properties of high sand thickness of more than 400 ft., permeability ranges from 100 md to 4000 md, bottom and edge water aquifer and medium oil of 26 API have been applied [6].
In addition, the field data using the updated existing reservoir management tool-kits including well logging, well testing, production analysis and water movement
studies are applied as reservoir surveillance tools [3,4,5,6], for the evaluation of reservoir performance.
The following cases were studied:
A. Evaluation of field practical factors controlling horizontal well production improving factor (PIF) in mature oil fields.
B. Overview evaluation of PIF for existing 4 matured reservoirs: A, B, C, and D (240 wells).
C. History evaluation of PIF for existing vertical and horizontal wells in reservoir A (70 wells).
D. Evaluation of PIF for a history of an existing vertical well and prediction of the same well when converted to horizontal well (re-entry well) in reservoir A.
E. Prediction evaluation of one vertical well or one horizontal well on the same location and same time (alternative) in reservoir A.
3. Results and Discussion
3.1. Evaluation of Factors Controlling Horizontal Well Production Improving Factor (PIF) in Mature Oil Fields
Many factors controlling the horizontal wells performance related to vertical wells have been investigated such as:
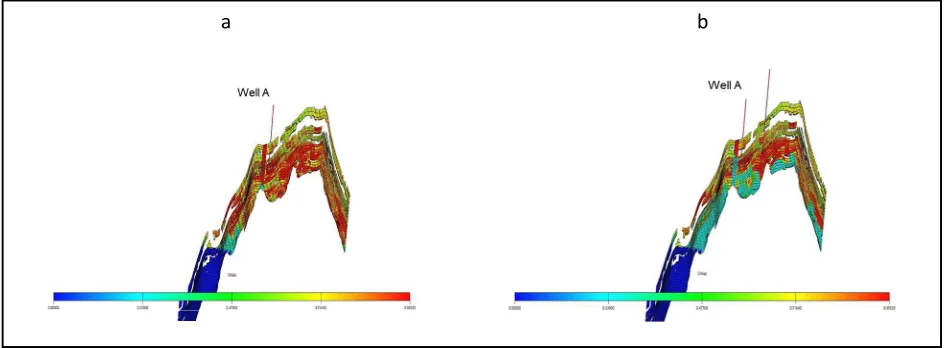
Estimation of remaining reserves: The first issue should be covered is the estimation of remaining oil in place (ROIP) focusing on the determination of the amount and location of the residual oil at current stage using field data, well logging, core data and dynamic simulation models. The amount and distribution of the ROIP will determine the success of choosing well type (if producer or injector either vertical or horizontal), well length, well placement and perforation intervals and other reservoir management practices.
Fig 1-a and 1-b are illustrations of ROIP in simulation cross sections in reservoir A at early life and mature
Figure 1. Illustration of simulation cross section results for OIP in reservoir A: (a) Early phase (b) Mature phase
phases of the studied reservoir A. The oil saturation can vary areally and vertically within the reservoir, and after the remaining oil estimations, methods to recover it are classified using different well types and techniques [11,13,14].
Expected and extended growth of using horizontal drilling in the studied reservoir A: Although, the first horizontal well was drilled in the mentioned fields was in 1995, since 2004 till nowadays all the new drilling wells and also the re-entry wells are horizontal wells. Therefore the present study will focus on the period from 2004 till 2013 due to the availability of field data. In addition, as a worldwide trend, all relevant recent publications in trade journals have carried articles [1,2,6,7,8,9,12] expressing extensive increase of horizontal drilling in both new and mature fields.
Horizontal well length in the studied reservoir A: Development of horizontal well length has rapidly climbed through the last few years to be several thousands of feet as recorded by longest horizontal length drilled by Maersk Oil Qatar [8,12]. However, it is essential to know if is it necessary to drill so long horizontal wellbores? Is there an optimal horizontal wellbore length and how could it be made efficient if it does exist [12,15]? To answer such questions, it is needed to know the advantages and challenges of horizontal well length in mature fields which could be concluded as followings: The advantages are represented by the long past experience and large amount of data available. Moreover, improving the ultimate oil recovery by delaying water production and reaching the residual oil buckets away from the jackets is one of the main advantages of horizontal drilling. Reducing the needed well numbers to sweep the residual oil effectively is also a target of drilling horizontal wells especially in offshore fields. In the other hand, the challenges become more than the advantages due to the field maturity. These challenges could be concluded in the lower oil saturations than before which leads to the presence of only oil buckets.
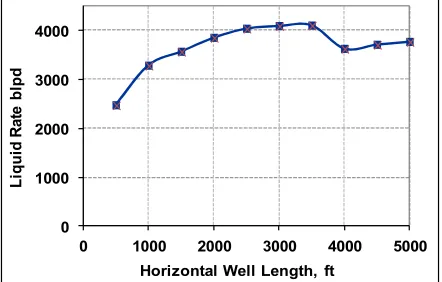
Figure 2. Horizontal well length vs liquid rate, blpd
Moreover, variations and complexity of water sources, if from bottom aquifers or from high permeability streaks, and the practical well and fields constrains for water
production based on the capacity of production facility are also vital challenges [15].
In this paper, horizontal well length has been studied based on the reservoir and fluid parameters and the results are shown in Fig 2. Optimum horizontal well length has been calculated using the most common used tubing size of 3.5 inch which is the suitable size after a very detailed study for the mentioned reservoir. The most drilling horizontal well lengths applied were ±3000 ft. Effective well length was calculated to be ±2250 based on field practices analysis for the applied wells. This effective length had been agreed with a laboratory study [4,5] and also with theoretical approaches [9], which stated that, the effective horizontal section was found to be 75% of the well length depending on the reservoir parameters, see Fig 3. This horizontal length is the most successful drilling practices in the studied reservoirs.
Figure 3. Effective horizontal well length vs liquid rate, blpd
Reservoir thickness and well placement: Giant fields are characterized by thick oil bearing layers of more than 400 ft. In such reservoirs and in the pre-mature phase, the vertical well performance is always high and the need for horizontal wells is low. In mature phase, the vertical well performance become lower and horizontal well becomes necessary. Placement of the horizontal wells above the OWC (Oil Water Contact) depends on: vertical permeability, fluid viscosities, mobility ratios and pay zone thickness.
Reservoir thickness in reservoir A is in the range of 200-400 ft. Field experience in the area from both the reservoir management and production engineering point of view has been adopted since, the well placement in the mature phase is always in the upper 30-60 ft.
Practical well and field production engineering constrains: Usually mature fields suffer from high water production related problems. Some parameters like water cut for both wells and the field should be controlled based on the available piping network and surface facilities capacities and based on well and field constrains. The same specific control should be applied for choosing the types of the artificial well lift methods and their effect on well productivity. In the simulation study, the practical
0 1000 2000 3000 4000
0 1000 2000 3000 4000 5000
L
iq
u
id
R
a
te
b
lp
d
Horizontal Well Length, ft
0 1000 2000 3000 4000
0 25 50 75 100
L
iq
u
id
R
a
te
b
lp
d
parameters are set for the simulation runs as controlling parameters. Maximum water cut of 70% and minimum oil rate of 600 BOPD have been applied.
3.2. Overview Evaluation of PIF for Existing 4 Giant New and Matured Reservoirs A, B, C and D
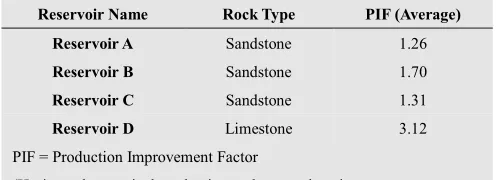
The well average production rate for more than 240 vertical and horizontal wells in different 4 reservoirs (A, B, C and D) are deeply investigated and compared. Table 1 shows that, the first three reservoirs (A, B and C) are sandstone reservoirs and the fourth one is fractured limestone. The results show that, the horizontal well production improving factor (PIF) in the sandstone reservoirs is generally low values (1.26, 1.7 and 1.31 for reservoirs A, B and C respectively). The PIF for the limestone reservoir could be considered as high, with value of 3.12, compared with other three sandstone reservoirs. From reservoirs point of view and the updated existing reservoir management tool-kits including well logging, well testing, production analysis and water movement studies and production and after screening the field data, it could be concluded that, applying horizontal wells in giant high permeable thick sandstone reservoirs from beginning (pre-mature phase) is not recommended while, it is strongly recommended in case of fractured limestone reservoirs.
Table 1. Comparison of historical Production Improvement Factor (PIF)
for 4 reservoirs (240 Wells).
Reservoir Name Rock Type PIF (Average)
Reservoir A Sandstone 1.26
Reservoir B Sandstone 1.70
Reservoir C Sandstone 1.31
Reservoir D Limestone 3.12
PIF = Production Improvement Factor
(Horizontal to vertical production at the same location
The reason for low PIF values in the mentioned three sandstone reservoirs is because these reservoirs are classified as a giant reservoirs with high sand thickness (200-400 ft) and high permeability ranges. In addition, high initial oil in place in the reservoir pre-matured phase beside the supporting water source is away from production wells, see Fig 1-a and 1-b. These important parameters make the vertical well performance to be high and no crucial need for horizontal wells in this pre-matured phase.
3.3. History Evaluation of PIF for Existing Vertical and Horizontal Wells in Reservoir A (70 wells).
More investigation was done for the sandstone reservoir A. Table 2 and Fig 4 show the historical PIF for more than 70 vertical and horizontal wells from actual field data. The average oil production for all horizontal wells (Qo_AH) and average oil production for all vertical wells (Qo_AV) during the period 2004-2012 was investigated and analyzed. The average PIF ranges from 1.23 to 1.28. with average
value of 1.26.
As described before, the causes for low PIF in three sandstone reservoirs are the same for reservoir A.. Because it is a giant reservoir and produce more than the half of the field. It is also characterized with high sand thickness of more than 400 ft., with edge water drive and imbedded high permeability streaks which ensure the results that the vertical well performance is high and no crucial need for horizontal wells in this pre-mature phase.
Figure 4.History of production rate for average horizontal wells (Qo_AH)
and average vertical wells (Qo_AV) and PIF.
Table 2. Historical Production Improvement Factor (PIF) for reservoir A
(70 Wells).
Year PIF
2004 1.23
2005 1.24
2006 1.25
2007 1.25
2008 1.26
2009 1.28
2010 1.27
2011 1.28
2012 1.28
3.4. Evaluation of Historical PIF of an Existing Vertical Well and Prediction of the Same Well When Converted to Horizontal Well (Re-Entry Well) in Reservoir A.
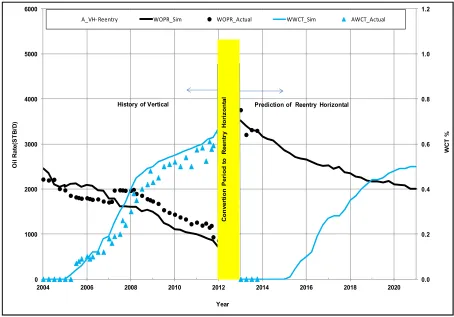
The historical PIF for an actual existing vertical well from 2004 till the well was shut in 2012 is shown in Fig 5 (left side) . The well was shut-in because the water cut has increased to about 70% and the oil rate was reduced to about 600 BOPD which is the practical well and field production constrains of the operating company. In such cases, after shutting the wells, the adopted company’s practice is to convert these wells into re-entry horizontal wells in the upper section of the oil zones based on the well logging, water movement studies and other reservoir management tool-kits [3].
0 0.5 1 1.5 2 2.5 3 3.5
-5000 -2500 0 2500 5000
2004 2006 2008 2010 2012
W
a
te
r
C
u
t
%
a
n
d
P
IF
O
il
R
a
te
(
S
T
B
/D
)
Year
Qo AH Qo AV
wct AH wct AV
After the decision of this conversion of the vertical well to a horizontal well, the simulation prediction of the well has been investigated and shown in Fig 5 (right side).
For simulation prediction work, as mentioned above, a three dimensional simulation black oil model has been constructed and applied. The model is up to date with all requirements and well history matched for every well and
for the full field reservoir and simulation sector. The same reservoir and rock properties have been applied for both the horizontal and vertical wells.
A good match for both oil production rate and water cut is shown in the left side part of Fig 5 from 2004 to2013. Also, on the right side of Fig 5, the prediction period 9 years (2013-2021) is illustrated.
Figure 5.Converting existing vertical well to re-entry horizontal well
The results show that, the oil production for new horizontal well has started with 3750 BOPD and has reduced to reach about 2000 BOPD in 2021. Water cut was zero till 2015.25 and started to increase rapidly until reached about 50% at the end of prediction.
The cumulative oil from the new re-entry horizontal well is about 8.46 MMSTB and water cut has reached only 50%. While the cumulative oil from the vertical well from the actual data is about 5.42 MMSTB and water cut has reached about 70%. The difference of the cumulative oil is more than 3.0 MMSTB which explain the importance of converting the vertical wells to horizontal wells.
3.5. Prediction Evaluation Comparison of One Vertical Well or One Horizontal Well on the Same Location and Same Time (Alternative) in Reservoir A.
In this section a comparison and evaluation of the prediction of one horizontal well or one vertical well from the same location and on the same time has been studied. Table 3 and Fig 6 show the prediction of the production
rate and PIF for two assumed wells, one vertical or one horizontal well from 2013 to 2021. The two wells are alternative to each other. The vertical well production rate has started with oil rate of 3110 BOPD and the rate was declined till reach to zero at 2021. Horizontal well production rate has started with 4760 BOPD of oil and reached 2870 BOPD at 2021. The PIF was calculated along the time and shown in Fig 6 and Table 3. It is started with 1.53 and has increased to be 4.83 in 2020 while in 2021 could not be calculated since the vertical production rate is zero. The well was shut-in because the water cut has increased to 67% based on the company production constrains (65-70% water cut and <700 BOPD of oil).
Fig. 7 shows the main conclusion of the studied PIF with time. It is clear that, in first years (pre-mature phase), the production improvement factor of horizontal well is small and the benefits of horizontal wells are small, while in the mature phase when the oil column become thinner than before with smaller residual oil saturations, the horizontal well benefits has greatly increased.
0.0 0.2 0.4 0.6 0.8 1.0 1.2
0 1000 2000 3000 4000 5000 6000
2004 2006 2008 2010 2012 2014 2016 2018 2020
W
C
T
%
O
il
R
a
te
(S
T
B
/D
)
A_VH- Reentry WOPR_Sim WOPR_Actual WWCT_Sim AWCT_Actual
Prediction of Reentry Horizontal History of Vertical
Year
C
o
n
v
e
rt
io
n
P
e
ri
o
d
t
o
R
e
e
n
tr
y
H
o
ri
z
o
n
ta
Finally, horizontal well Production Improving Factor (PIF) for reservoir A has increased with time along the reservoir life from pre-mature to mature phases. In this study, it has increased from 1.23 to 1.28 during the past 9 years (2004-2012). However, simulation prediction results for next 9 years (2013-2021) has exposed that PIF has reached almost 5. That is because, the oil column thickness become more thinner due to water movement through moving up toward the water oil contact and through high permeability streaks.
Table 3. PIF Prediction for a horizontal or a vertical wells starting 2013
in reservoir A.
Year PIF
2013 1.53
2014 1.70
2015 1.95
2016 2.21
2017 2.36
2018 2.83
2019 3.55
2020 4.83
2021 ∞ (vertical well is shut-off)
Figure 6. Prediction of production rates and PIF for a horizontal well or
a vertical well at same location with time
Figure 7. History and prediction for Production Improvement Factor (PIF)
4. Conclusions
1. Applying horizontal wells in giant high permeable thick sandstone new reservoirs (virgin phase) is not recommended while, it is well recommended in case of fractured limestone reservoirs.
2. Using horizontal drilling in mature giant reservoirs specially in thick sandstones is essential since its production improvement factor (PIF) could be increased up to 5.
3. High horizontal well improvements in mature reservoirs is due to the thick sand becomes thinner and the benefits of horizontal are maximized. 4. In prediction, faster water conning for vertical wells
have been noticed compared with the horizontal wells.
5. In the history, and because of thick pay zones (more than 200-400 ft. has been applied), the production improvement factor (PIF) is only 1.26.
6. In addition, high permeable streaks can help water conning and channeling quickly in vertical wells which could be minimized by using horizontal wells.
7. From field practice, using pilot holes during drilling new infill and/or re-entry horizontal wells in mature oil fields with applying the most new technology tools is essential for successful high potential wells.
References
[1] Syed, A. “Mature Fields and Well Revitalization” JPT, January 2012, pp. 73-84.
[2] Syed, A. “Mature Field Revitalization” JPT, January 2009, pp. 58-69.
[3] Moawad, T.; AlDhafeeri, A. and Ibrahim, T. “Successful Applied Reservoir Management Tool-Kits in Offshore Khafji Field for Water Conning Problems” published in ARPN Journal of Science and Technology in Vol.3 No.5, May 2013.
[4] Moawad, T. ‘’ Investigation of factors Affecting the Productivity Index of a Horizontal Well’’ M. SC. Thesis, Suez Canal University, Egypt, 1994.
[5] Moawad, T. et al. ‘’ A laboratory Study to Investigate factors Affecting the Productivity of a Horizontal Well’’ Al-Azher International Conference, Cairo, 16-19 Dec., 1995.
[6] Moawad T. “A Simulation Case Study for Economically Improved Oil Recovery and Shut-off Strategies on the Basis of a Stratified High Temperature Oil Reservoir” Ph. D. Thesis, Clausthal Technical University, Germany, 2004. [7] Baack, W. and Latif, M. “Innovative Use of Horizontal
Wells in Mature Fields Boosts Production/Reserves” Middle East Oil Show, 11-14 March 1995, Bahrain.
[8] Rob Buitenkamp, Steve Fischer and Jim Reynolds, "Well claims world record for horizontal displacement," World Oil, October 1992, p. 41.
0 0.5 1 1.5 2 2.5 3 3.5 4 4.5 5 5.5
-5000 -2500 0 2500 5000 7500
2013 2015 2017 2019 2021
W
a
te
r
C
u
t
%
a
n
d
P
IF
O
il
R
a
te
(
S
T
B
/D
)
Year
Qo H Qo V
wct H wct V
PIF
0 1 2 3 4 5 6
2004 2008 2012 2016 2020 2024
P
IF
Year
Prediction for mature phase History for early phase
[9] Joshi S. D. "Horizontal Well Technology" Pennwell Books,1991, ISBN: 9780878143504.
[10] Eclipse Technical Description Manual, 2012, Schlumberger. [11] Wijanarko, A. et al. “Renewal Plan: Efficient Strategy for
Optimum Development in Mature Fields - A Success Story from Sanga-Sanga Assets, Indonesia” SPE Asia Pacific Oil and Gas Conference and Exhibition, 22-24 October 2012, Perth, Australia.
[12] Kumud S. et al. “How Continuous Improvement Lead to the Longest Horizontal Well in the World” SPE/IADC Drilling Conference and Exhibition, 17-19 March 2009, Amsterdam, The Netherlands.
[13] Bhattacharya S., et al. “Arresting Production Decline of a Mature Offshore Field Using Horizontal Sidetracks” Canadian International Petroleum Conference, 12-14 June 2007, Calgary, Alberta