Prof. C. Rambabu
Mobile: 9949838299 E-mail: [email protected] Address for correspondence
STABILITY INDICATING REVERSED PHASE UPLC METHOD FOR THE ASSAY OF LAMOTRIGINE IN TABLET DOSAGE FORMS
1. INTRODUCTION
Lamotrigine (LTG) is an anticonvulsant drug used in the treatment of epilepsy and bipolar disorder. It is generally accepted to be a member of the sodium channel blocking class of antiepileptic drugs [1]. LTG shares few side-effects with other, unrelated anticonvulsants known to inhibit sodium channels, which further emphasizes its unique properties [2]. It is chemically known as 3, 5-diamino-6-(2,3-dichorophenyl)-1,2,4-triazine, with molecular formula and molecular weight C9H7Cl2N5 and
256.0g respectively. The chemical structure of LTG is presented in Figure-1.
Fig.1:Chemical Structure of Lamotrigine
Several HPLC methods were reported in the literature for the determination of LTG in different biological fluids [3–14]. Emami et al. [15] developed a HPLC method for determination of LTG and related compounds in tablet formulations. Youssef and Taha [16] have developed spectrophotometric, TLC, and HPLC methods for the determination of LTG in presence of its impurity. A stability indicating LC method was developed for the determination of LTG by Srinivasulu et al. [17]. Sallustio and Morris [18] reported a high-performance liquid
A reverse phase ultra performance liquid chromatographic method (RP-UPLC) was developed for the determination of Lamotrigine (LTG) in pure and tablet dosage forms. Separation was carried out by using Waters- Alliance UPLC system equipped with auto sampler, PDA detector, symmetry C18 (2.1 x 100mm, 1.7 m, Make: BEH) column, potassium dihydrogen phosphate buffer of pH=7.0 and acetonitrile in the ratio 40:60 v/v at a flow rate of 0.4ml/min as mobile phase and detection at 215nm at ambient temperature. The system suitability parameters such as retention time, tailing factor and theoretical plate count were calculated by injecting about 4 µL of working standard solution and found to be 0.620 min, 1.5 and 14367.9 respectively. Linearity between peak area and concentration, limit of detection and limit of quantification were also found to be 2.0-10.0μg/mL, 0.004μg/mL and 0.012µg/mL respectively. The stability of the drug under the different degradation conditions such as 0.1N HCl, 0.1N NaOH, 3%H2O2), photolytic and thermal was tested and found to be 90.1, 88.0, 81.0, 84.0 and 86.0 respectively. The developed method was found to be repeatable, reproducible, robust and rugged hence it can be used as a new analytical method for the analysis of pharmaceutical formulations in any pharmaceutical industries.
Keywords: Assay, Lamotrigine, Optimization, Recovery, RP-UPLC and Validation
ABSTRACT T. Vijaya Bhaskara Reddy1,
N. Sowjanya Reddy1, Ruby Mishra1,
G.Ramu2 C.Rambabu1*
1Department of Chemistry,
Acharya Nagarjuna University, Nagarjuna Nagar, AP- India.
2Sir C.R.Reddy College
P.G.Coureses,Eluru, Anadhra Pradesh, India
Journal of Global Trends in Pharmaceutical Sciences
Available online at www.JGTPS.com
ISSN: 2230-7346
Journal of Global Trends in Pharmaceutical Sciences Volume-4, Issue- 4, pp -1346-1355, October-December 2013
chromatography method for quantitation of plasma LTG concentrations in patients with epilepsy. Simultaneous determination of LTG, zonisamide, and carbamazepine in human plasma by high-performance liquid chromatography was reported by Griner-Sosanko et al. [19]. M. C. Sharma and Sharma [20] developed a validated densitometric method for the quantification of LTG in dosage form. M. T. Martins, C. S. Paim, and M. Steppe reported a LC and UV methods [21] for LTG determination in pharmaceutical formulation. N. M. El-Enany et al. [22] published a validated spectrofluorimetric method for the determination of LTG in tablets and human plasma through derivatization with o-phthalaldehyde S. Pollisetty and others developed a validated stability indicating LC method [23] for LTG. Rambabu et al. [24] published a research paper on development and validation of HLPC method for the estimation of LTG in bulk and pharmaceutical formulations. Ching-Ling Cheng, Chen-Hsi Chou, and Oliver Yoa-Pu Hu [25] had determined LTG in small volumes of plasma by high-performance liquid chromatography. A spectroscopic method [26] in UV region was developed for the quantitative determination of LTG in bulk and in dosage form. A few visible spectrophotometric methods [27–29] were developed for the determination of LTG in pharmaceutical dosage forms and urine samples using some chromogenic reagents. From the entire survey it was found that no reverse phase ultra performance liquid chromatographic (RP-UPLC) method reported for the determination of LTG, hence the authors were interested in developing the above method. The objective of the present investigation was to develop a validated RP-UPLC for the determination of LTG in pure and pharmaceutical formulations. This method was applied to study the assay of the drug different stressed conditions.
2. EXPERIMENTAL
2.1 Equipment: Waters-Alliance UPLC system
equipped with auto sampler, binary gradient pump, and PDA detector was used for the separation. An analytical column; Symmetry C18 (2.1 x 100mm, 1.7 m, Make: BEH) was used in the analysis. Chromatographic software
Empower -2 was used for data collection and processing.
2.2 Materials and Methods: Lamotrigine pure drug was gifted by Dr.Reddy’s Laboratories Ltd., Hyderabad. The commercially available formulations of Lamotrigine were purchased from the local market. The HPLC grade water was prepared by double glass distillation and filtration through 0.45 mm filters. Acetonitrile of HPLC grade was obtained from E.Merck. (India) Ltd., Mumbai. Potassium dihydrogen phosphate, hydrochloric acid, hydrogen peroxide, methanol and sodium hydroxide of analytical grade are purchased from Qualigens Fine Chemicals Ltd., Mumbai.
2.3 Preparation of solutions
2.3.1 Preparation of mobile phase: About 7.0 grams of potassium dihydrogen phosphate was weighed accurately, transferred into a 1000mL beaker and dissolved in 1000mL of HPLC grade water. The solution was sonicated for 30min., and degassed in ultrasonic water bath for 5 minutes. The pH of the resulting solution was adjusted to pH 7.0 by adding dilute sodium hydroxide solution and filtered through 0.45µm membrane filter. The mobile phase was prepared by adding of 600mL acetonitrile to 400mL buffer, the solutions were mixed well, sonicated for 30min. and degassed in ultrasonic water bath for 5 minutes and filtered through 0.45µm membrane filter.
2.3.2 Preparation of standards: Stock solution (100 µg/mL ) of the LTG was prepared by dissolving accurately weighed 10mg of LTG standard in 70mL of diluent (mobile phase) in a 100 mL volumetric flask, sonicated and made up to the mark. Further working standard (6 µg/mL ) was prepared by transferring 0.6mL of the stock solution into 10mL volumetric flask and diluted up to the mark with diluent, sonicated and filter through 0.45µm filter. A series dilute solutions ranging from 2.0-10.0 µg/mL were prepared by taking different aliquots (0.2 – 1.0mL) of the stock solution and diluted in similar manner.
for 5 min, diluted to volume with diluent and then filtered through 0.45µm membrane. Further sample solution of concentration 6 µg/mL was prepared by transferring 0.6mL of the stock solution into 10mL volumetric flask and further three different concentration solutions (i.e. 50%, 100% and 150%) of the target concentration were prepared and the percent of recovery was studied.
2.4 Chromatographic conditions: In order to establish suitable chromatographic conditions four different trails with varying chromatographic parameters such as column, flow rate, injection volume and run time were tested so as to obtain best system suitability parameters such as peak shape, minimum run time and less tailing factor. The chromatographic separation was carried out under the isocratic mode by injecting about 4.0 µL of working standard solution into the BEH Symmetric C18 (2.1mmx100mmx1.7 μm), the components were eluted by using the mobile phase potassium dihydrogen phosphate buffer of pH=7.0 and acetonitrile in the ratio 40:60 v/v at a flow rate of 0.4mL/min for a period of 2.0 minutes and the components were detected at 215nm. Typical chromatograms for standard and test were shown in Figure-2 and Figure-3 respectively
2.5 Study of forced degradation
The percent of drug that was degraded in the presence of different stressed conditions like acid, base, peroxide, photolytic and thermal were studied. The amount of drug degraded was calculated by comparing the area of the standard with that of the area of the degraded sample. About 10mg was accurately transferred to a 100mL volumetric flask and dissolved in 70 mL of diluents sonicated for 5min in ultrasonic bath to dissolve and diluted to volume with diluent and then filtered through 0.45µm membrane. Further 0.6 mL of the above stock solution was transferred into a 10mL volumetric flask and made up to the mark to prepare working sample solution of concentration 6 µg/mL. The experimental details in forced degradation were presented in detail in the following subsections.
2.5.1 Acid Degradation: About 1.0mL of the above working standard solution was transferred into a 10mL volumetric flask, 1.0mL of 0.1N HCl solution was added and kept aside.
After 48 hours the resulting solution was neutralized by adding 0.1N NaOH drop wise and then chromatogram was recorded under the optimized conditions. The stability of drug was calculated by comparing the peak area of compound in presence of 0.1N HCl with the peak area of the standard chromatogram.
2.5.2 Base Degradation: Into a10mL
volumetric flask, about 1.0mL of the above working standard solution was taken and 1.0mL of 0.1N NaOH solution was added and kept aside for 48 hours, after that it was neutralized with 0.1N HCl solution and then chromatogram was recorded under the optimized conditions. The amount of degradation of drug was calculated by comparing the peak area of degraded compound with the peak area of the standard.
2.5.3 Peroxide degradation: In case of peroxide degradation, 1.0 mL of the stock solution was taken into a 10mL volumetric flask 1.0mL of 1%H2O2 was added and allowed to degrade for
48 hours and then add 1.0mL of water and made up to the mark, chromatogram was recorded under the optimized conditions. The percent of degradation the drug was calculated by comparing the area of the peak under stressed condition with the area of the standard chromatogram.
2.5.4 Photolytic Degradation: The reference sample was kept under UV radiation for 36 hours, about 10mg of the above sample was accurately weighed, transferred to a 100mL volumetric flask and dissolved in 70 mL of diluents sonicated for 5min in ultrasonic bath to dissolve and diluted to volume with diluent and then filtered through 0.45µm membrane. Further 0.6 mL of the above stock solution was transferred into a 10mL volumetric flask and made up to the mark to prepare working sample solution of concentration 6 µg/mL. The chromatogram of the resulting solution was recorded and the amount of drug recovered after degradation was calculated by comparing the area of the standard with that of the area of the degraded sample calculated.
2.5.5 Thermal Degradation: The reference
then filtered through 0.45µm membrane. Further 0.6 mL of the above stock solution was transferred into a 10mL volumetric flask and made up to the mark to prepare working sample solution of concentration 6 µg/mL. The chromatogram was recorded under the optimized conditions and the amount of drug recovered after degradation was calculated by comparing the area of the standard with that of the area of the degraded sample calculated.
3. RESULTS AND DISCUSSION
3.1 Method Development and Optimization:
The chromatographic separation was carried out under the isocratic mode. Four different trails with varying chromatographic parameters such as column, flow rate, injection volume and run time were tested for obtaining best system suitability parameters such as peak shape, minimum run time and less tailing factor. The composition of mobile phase (potassium dihydrogen phosphate buffer of pH=7.0 and acetonitrile in the ratio 40:60 v/v) and detection wavelength (215nm) were not altered during optimization. In Trail-I, about 3.0µL of working standard solution was injected into a BEH Symmetric C18 (2.1mmx100mmx1.7 μm) column, components were eluted at a flow rate of 0.6mL/min for the period of 4.0minrun time. The resulting peak appeared to be sharp having high tailing factor. About 2.0µL of working standard solution was injected into same column, but the components were eluted at a flow rate of 0.3mL/min for the period of 2.7min run time in Trail-II, under these conditions the peak shape was found to be broad and diffused. In Trail-III, the short length column (BEH Symmetric C18 (2.1mmx50mmx1.7μm)) was preferred, about 4.0 µL of working standard solution was injected into above column and the components were eluted at a flow rate of 0.5mL/min for the period of 4.0min, under these conditions the shape of the peak was found to be not symmetric. In the final Trail (Trail-IV optimized), about 4.0 µL of working standard solution was injected into the previous column i.e. BEH Symmetric C18 (2.1mmx100mmx1.7
μm), the components were eluted at a flow rate of 0.4mL/min for a period of 2.0 minutes. The recorded chromatogram was found to have a sharp symmetric peak, having high area, height, plate count, valid tailing factor and comparable
retention time relative to chromatograms in other trails.
3.2 Method Validation
3.2.1 System suitability parameters: To
evaluate system suitability parameters such as retention time, tailing factor and USP theoretical plate count, the mobile phase was allowed to flow through the column at a flow rate of 0.4mL/min for 2 minutes to equilibrate the column at ambient temperature. Chromatographic separation was achieved by injecting a volume of 4 µL of standard into Symmetry C18 (2.1 x 100mm, 1.7 m, Make: BEH) column, the mobile phase of composition potassium dihydrogen phosphate buffer of pH=7.0 and acetonitrile in the ratio 40:60 v/v was allowed to flow through the column at a flow rate of 0.4 per minute. Retention time, tailing factor and USP theoretical plate count of the developed method were found to be 0.620 minute, 1.5 and 14367.9 respectively.
3.2.2 Intraday and interday precision: Intraday precision (repeatability) was determined by injecting working standard (6µg/mL) solution of LTG five times, chromatograms were obtained, and the % R.S.D. of the area of five replicates was calculated and found to be 0.4%. The intermediate precision (reproducibility of the results in different days) of the method was determined on five replicates from same lot. The %R.S.D of the area of five chromatograms was evaluated and found to be 0.2%. The results thus obtained were shown in Table-1.
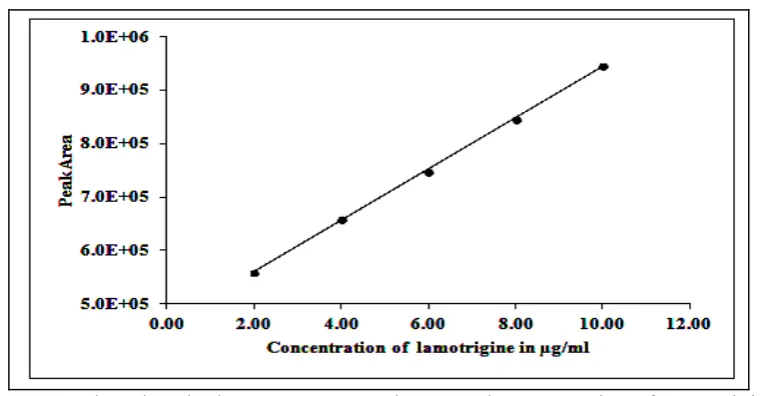
3.2.3 Linearity: To determine the linearity of the proposed method, a series of six different concentrated solutions of the standard LTG were prepared and about 4µL of each solution was injected in duplicate into the UPLC system, chromatograms were recorded under the optimum chromatographic conditions. A plot between mean peak area and concentration was found to be linear in the range of concentration 2.0-10.0 µg/mL and it was presented in Figure-4. Slope, intercept and correlation coefficient were calculated by least square regression method and were presented in Table-2.
of signal/noise ratio (S/N) from the average baseline noise obtained of blank (51µV) and signal obtained from 0.004µg/mL of target assay concentration (152µV) was found to be 2.98. The chromatogram for LOD was presented in Figure-5.
3.2.5 Limit of quantization (LOQ):Pipetted 1.0 mL of 10µg/mL solution into a 10 mL of volumetric flask and dilute up to the mark with diluent. Further pipetted 0.12mL of above diluted solution into a 10 mL of volumetric flask and dilute up to the mark with diluent. Calculation of signal/noise ratio (S/N) from the average baseline noise obtained of blank (51µV) and signal obtained from 0.012µg/mL of target assay concentration (513µV) was found to be 10.1. Respective chromatogram for LOQ was presented in Figure-6.
3.2.6 Accuracy: Accuracy of the proposed
method was determined by analyzing LTG sample spiked at three different concentration levels in triplicate, a known amount of standard drug was added to the fixed amount of pre-analyzed sample solution at three different concentration levels in triplicate. Percent recovery of the drug was calculated by comparing the area before and after the addition of the standard drug. The mean recovery of the drug was found to be 100.3% and shown in Table-3.
3.2.7 Robustness and Ruggedness: The study of robustness was performed by slight modification in chromatographic conditions such as flow rate of the mobile phase, pH of the buffer, wavelength and composition of the mobile phase. The working standard solution of LTG was analyzed under these new set of experimental conditions. Only one parameter was changed while the others were kept unaltered. The system suitability parameters were evaluated as per the test method in all the cases and found to be within limits shown in Table-4. Ruggedness was the degree of reproducibility of results between different columns, different systems and different labs under normal experimental conditions. It was determined by injecting six replicate injections of sample solution and the percent of assay was determined.
3.3 Forced Degradation: The percent of drug that was degraded in the presence of different stressed conditions like acid, base, peroxide,
photolytic and thermal were studied. The drug standard was exposed to 0.1NHCl solution; 0.1N NaOH and 3% peroxide solutions for 48 hours at room temperature. To study the percent of degradation in the presence of light and thermal conditions the standard was exposed to UV light and a temperature of 45oC separately for about 36 hours. In each case a working standard (6µg/mL) solution was prepared, injected into the system and the chromatograms were recorded. The amount of drug degraded was calculated by comparing the area of the standard with that of the area of the degraded sample. The results are presented in Table-5.
4. Analysis of Tablets: Study of assay of different pharmaceutical formulations by the proposed method was carried out by calculating average weight of three tablets (Lamictal tablets of dosage 25 mg and 100 mg) was determined, finely powdered in a mortar and stock solution of concentration 100µg/mL was prepared by weighing an amount of the tablet powder equivalent to 10mg and then working standard solution of concentration 6 µg/mL was prepared as explained in experimental section. A volume of 0.4µLof placebo, standard preparation (3 times) and sample preparation (3 times) were separately injected into the chromatographic system. Then the chromatograms and the peak responses were measured. The placebo chromatogram was examined for any extraneous peaks that were observed in the chromatograms of sample and standard preparations. Chromatogram of the standard preparation was recorded and the peak responses were measured..The result of assay analysis was presented in Table-6.
CONCLUSIONS
The system suitability parameters were found to be within the limits and the retention time of the component was found to be 0.624min. The developed method was proved to be precise, accurate and linear in the range of concentration 2.0-10.0 μg/mL with good
ACKNOWLEDGEMENTS
The authors would like to thank to Dr. Reddy’s Laboratory for gifted samples and Pharma Train, an analytical testing laboratory,
Hyderabad for providing laboratory facilities, and to the authorities of Acharya Nagarjuna University for providing provision for research work.
Figure 2: A typical chromatogram of Lamotrigine working standard
Figure 3: A typical chromatogram of Lamotrigine test solution
Figure 5:A typical chromatogram for LOD studies of Lamotrigine
Figure 6:A typical chromatogram for LOQ studies of Lamotrigine
Table 1:Intraday and Interday Precision of the proposed method
Injection Intraday Peak Area Interday Peak Area
Injection-1 739175 735868
Injection-2 733155 736989
Injection-3 732791 734623
Injection-4 732856 736622
Injection-5 732801 733624
Average 734155.6 735545.1
Standard Deviation 2810.1 1404.6
%RSD 0.4 0.2
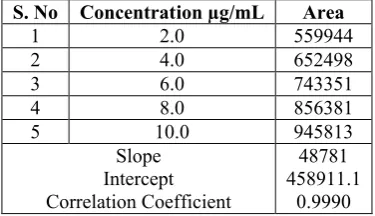
Table 2:Linearity of the peak area against amount of the drug
S. No Concentration µg/mL Area
1 2.0 559944
2 4.0 652498
3 6.0 743351
4 8.0 856381
5 10.0 945813
Slope Intercept Correlation Coefficient
48781 458911.1
Table 3:Accuracy of the proposed method
%Concentration Area Amount Added Amount Found % Recovery Mean Recovery 50% 373157 5.0 5.06 101.2%
100% 735572 10.0 9.97 99.7% 100.3% 150% 1105608 15.0 15.0 100.0%
Table 4:Study of Robustness of the proposed UPLC method
S. No. Parameter RT Area Height P C TF
Less flow rate:0.3mL/min 0.682 736985 459682 14361.0 1.4 1 Optimized flow rate: 0.4mL/min 0.620 735789 439147 14367.9 1.5 High flow rate:0.5mL/min 0.550 739983 455130 13833.0 1.4 10% Less organic solvent 0.688 738695 458695 14836.3 1.4 2 Optimized ratio 40:60 0.620 735789 439147 14367.9 1.5 10% More organic solvent 0.502 739685 455862 13979.9 1.4 Less wavelength 213nm 0.630 728665 442145 14261 1.4 3 Optimized wavelength 215nm 0.620 735789 439147 14367.9 1.5 High wavelength 217nm 0.557 742512 438145 14268.8 1.5 Less pH:6.8 0.676 725896 428594 142612 1.4 4 Optimized pH =7.0 0.620 735789 439147 14367.9 1.5 More pH:7.2 0.550 746983 445130 13683.0 1.5
RT: Retention time, P C: Plate count, TF: Tailing factor
Table 5:Study of degradation of the drug
Degradation Parameter Time Period Peak Area of sample Peak Area of Standard Assay of LTG % of Degradation 0.1N HCl 48 hours 669474 735693 90.10 9.90 0.1N NaOH 48 hours 647435 735693 88.00 12.00
Peroxide 48 hours 595920 735693 81.00 19.00 Photolytic 36 hours 617987 735693 84.00 16.00 Thermal 36 hours 632722 735693 86.00 14.00
Table 6: Assay of Lamotrigine formulations
S. No. Formulation Amount Taken Amount Found ± SD %Assay*±%RSD 1 Lamictal 25mg 24.99±1.046 99.97±1.0464 2 Lamictal 100mg 99.80±1.0972 99.80±1.0994
REFERENCES
1. M. A. Rogawski and W. Löscher, “The neurobiology of antiepileptic drugs,”Nature Reviews Neuroscience, vol. 5, no. 7, pp. 553–564, 2004.
2. G. Lees and M. J. Leach, “Studies on the mechanism of action of the novel anticonvulsant Lamotrigine (Lamictal) using primary neuroglial cultures from rat cortex,”Brain Research, vol. 612, no. 1-2, pp. 190–199, 1993.
3. S. Bompadre, A. Tagliabracci, M. Battino, and R. Giorgetti, “Determination of Lamotrigine in whole blood with on line solid phase extraction,”Journal of Chromatography B, vol. 863, no. 1, pp. 177–180, 2008.
4. S. M. Addolorata, B. Francesca, C. Matteo, A. Mario, and M. A. Raggi, “Rapid HPLC analysis of the antiepileptic Lamotrigine and its metabolites in human plasma,”Journal of Separation Science, vol. 30, no. 14, pp. 2249–2255, 2007. 5. D. Croci, A. Salmaggi, U. De Grazia, and
G. Bernardi, “New high-performance liquid chromatographic method for plasma/serum analysis of Lamotrigine,”Therapeutic Drug Monitoring, vol. 23, no. 6, pp. 665–668, 2001.
6. M. M. Castel-Branco, A. M. Almeida, A. C. Falcão, T. A. Macedo, M. M. Caramona, and F. G. Lopez, “Lamotrigine analysis in blood and brain by
high-performance liquid
chromatography,”Journal of Chromatography B, vol. 755, no. 1-2, pp. 119–127, 2001.
7. M. Torra, M. Rodamilans, S. Arroyo, and J. Corbella, “Optimized procedure for Lamotrigine analysis in serum by high-performance liquid chromatography without interferences from other frequently coadministered anticonvulsants,”Therapeutic Drug Monitoring, vol. 22, no. 5, pp. 621–625, 2000.
8. N. R. Barbosa and A. F. Mídio, “Validated high-performance liquid chromatographic method for the determination of Lamotrigine in human plasma,”Journal of Chromatography B, vol. 741, no. 2, pp. 289–293, 2000.
9. Y. Böttiger, J. O. Svensson, and L. Ståhle, “Lamotrigine drug interactions in a TDM material,”Therapeutic Drug Monitoring, vol. 21, no. 2, pp. 171–174, 1999.
10. E. Vidal, C. Pascual, and L. Pou, “Determination of Lamotrigine in human
serum by liquid
chromatography,”Journal of Chromatography B, vol. 736, no. 1-2, pp. 295–298, 1999.
11. P. Angelis-Stoforidis, D. J. Morgan, T. J. O'Brien, and F. J. E. Vajda, “Determination of Lamotrigine in human plasma by high-performance liquid chromatography,”Journal of Chromatography B, vol. 727, no. 1-2, pp. 113–118, 1999.
12. K. M. Matar, P. J. Nicholls, S. A. Bawazir, M. I. Al-Hassan, and A. Tekle, “A rapid liquid chromatographic method for the determination of Lamotrigine in plasma,”Journal of Pharmaceutical and Biomedical Analysis, vol. 17, no. 3, pp. 525–531, 1998.
13. M. Cociglio, R. Alric, and O. Bouvier, “Performance analysis of a reversed-phase liquid chromatographic assay of Lamotrigine in plasma using solvent-demixing extraction,”Journal of Chromatography, vol. 572, no. 1-2, pp. 269–276, 1991.
14. C. L. Cheng, C. H. Chou, and O. Y. P. Hu, “Determination of Lamotrigine in small volumes of plasma by
high-performance liquid
chromatography,”Journal of Chromatography B, vol. 817, no. 2, pp. 199–206, 2005.
15. J. Emami, N. Ghassami, and F. Ahmadi, “Development and validation of a new HPLC method for determination of Lamotrigine and related compounds in tablet formulations,”Journal of Pharmaceutical and Biomedical Analysis, vol. 40, no. 4, pp. 999–1005, 2006.
17. P. Srinivasulu, K. Mukkanti, B. R. Reguri, and K. S. V. Srinivas, “Development of a validated stability indicating LC method for Lamotrigine,”Chromatographia, vol. 70, no. 1-2, pp. 271–276, 2009.
18. B. C. Sallustio and R. G. Morris, “High-performance liquid chromatography quantitation of plasma Lamotrigine concentrations: application measuring trough concentrations in patients with epilepsy,”Therapeutic Drug Monitoring, vol. 19, no. 6, pp. 688–693, 1997.
19. E. Griner-Sosanko, D. R. Lower, M. A. Virji, and M. D. Krasowski, “Simultaneous determination of Lamotrigine, zonisamide and carbamazepine in human plasma by
high-performance liquid
chromatography,”Biomedical
Chromatography, vol. 21, no. 3, pp. 225– 228, 2007.
20. M. C. Sharma and S. Sharma, “Validated densitometric method for the quantification of Lamotrigine in dosage form,”International Journal of PharmTech Research, vol. 3, no. 2, pp. 1174–1178, 2011.
21. M. T. Martins, C. S. Paim, and M. Steppe, “LC and UV methods for Lamotrigine determination in pharmaceutical formulation,”Chromatography Research International, vol. 2011, Article ID 860168, 8 pages, 2011.
22. N. M. El-Enany, D. T. El-Sherbiny, A. A. Abdelal, and F. F. Belal, “Validated spectrofluorimetric method for the determination of Lamotrigine in tablets and human plasma through derivatization with o-phthalaldehyde,”Journal of Fluorescence, vol. 20, no. 2, pp. 463–472, 2010.
23. S. Pollisetty, M. Khagga, R. R. Buchi, and S. S. V. Koduvi, “Development of a validated stability indicating LC method
for Lamotrigine,”Chromatographia, vol. 70, no. 1-2, pp. 271–276, 2009.
24. T. Vijaya Bhaskara Reddy, G. Ramu, A. Biksham Babu, and C.Rambabu, “Development and Validation of HLPC Method for the Estimation of Lamotrigine in Bulk and Pharmaceutical Formulations”, Journal of Chemistry, Vol. 2013, Article ID 846170, pp.1-4, 2013.
25. Ching-Ling Cheng, Chen-Hsi Chou, and Oliver Yoa-Pu Hu, “Determination of Lamotrigine in small volumes of plasma by high-performance liquid chromatography”Liquid Journal of Chromatography B, vol.817, no.2, pp.199–206, 2005.
26. Koyal Saini, and Navdeep Saini, “Quantitative determination of lamotrigine in bulk and dosage form by UV Spectrophotometry”Journal of Applied Pharmaceutical Science, vol.1, no.3, pp.113-116. 2011.
27. R. S. Chandan, M. Vasudevan, Deecaraman, B. M. Gurupadayya, and M. Indupriya, “Spectrophotometric determination of Lamotrigine using Gibb's and MBTH reagent in pharmaceutical dosage form,”Journal of Pharmacy Research, vol. 4, no. 6, pp. 1813–1815, 2011.
28. N. Alizadeh, R. Khakinahad, and A. Jabbari, “Spectrophotometric determination of Lamotrigine in pharmaceutical preparations and urine by charge-transfer
complexation,”Pharmazie, vol. 63, no. 11, pp. 791–795, 2008.