R E S E A R C H
Open Access
Frequency difference beyond behavioral limen
reflected by frequency following response of
human auditory Brainstem
Qin Xu and Qin Gong
** Correspondence:
[email protected] Postal address: Department of Biomedical Engineering, Medical School, Tsinghua University, Beijing 100084, China
Abstract
Background:The present study investigated whether the frequency-following response (FFR) of the auditory brainstem can represent individual frequency-discrimination ability. Method:We measured behavioral frequency-difference limens (FDLs) in normal hearing young adults. Then FFRs were evoked by two pure tones, whose frequency difference was no larger than behavioral FDL. Discrimination of FFRs to individual frequencies was conducted as the neural representation of stimulus frequency difference. Participants were 15 Chinese college students (ages 19–25; 3 males, 12 females) with normal hearing characteristics.
Results:According to discriminative neural representations of individual frequencies, FFRs accurately reflected individual FDLs and detected stimulus-frequency differences smaller than behavioral threshold (e.g., 75% of FDL).
Conclusions:These results suggest that when a frequency difference cannot be behaviorally distinguished, there is still a possibility of it being detected physiologically.
Keywords:Frequency following response (FFR), Frequency difference limen (FDL), Frequency discrimination
Background
Pitch plays an important role in the perception of speech, language and music. In gen-eral, sounds may be ordered on a scale extending from low to high pitch. In speech, pitch carries information about talker identification and emotions. In music, changes in pitch convey melody. For pure tones, the physical correlate of pitch is frequency [1]. By convention, the pitches of pure tones are used as standards to judge the pitches of other sounds [2].
The electrical frequency-following response (FFR) recordable from the scalp reflects the sum of sustained phase-locked activity evoked by periodic sounds in brainstem neurons [3,4]. Stimulus periodicity (and hence frequency) is reflected in the FFR, which includes pitch-relevant information [4,5] allowing, for instance, to track the pitch con-tours of the four lexical tones of Mandarin Chinese [5,6]. Thus, FFR is related to be-havioral pitch perception. Deficient phase-locking of FFR is reported for elder people [7,8] and for children with autism spectrum disorders [9]. Tone-language speakers [6,10-12] and musicians [13-15] produce stronger FFRs than English speakers or
musicians. Appropriately, higher FFR pitch-tracking accuracy accompanies improved behavioral performance following training [16,17]. Specifically, correlation between be-havioral pitch discrimination and FFR has been investigated in previous studies. FFR strength covaries with fundamental-frequency difference limens (F0DLs) for iterated rippled noise with increasing temporal regularity [18,19]. For the detection of unre-solved harmonic complex tones in noise, increased F0DLs and decreased FFR strength correlate with increases in noise level [20]. In the case of musical pitch, a significant as-sociation between FFR representation of F0 and behavioral F0DL is found for musicians (but not for non-musicians or tone-language speakers [15]). Short-term training im-proves both behavioral measures of pitch discrimination and FFR strength for complex tones with rising or static pitch contours (but not for falling pitch contours) [17]. A sig-nificant correlation is found between FFR strength and behavioral frequency difference limen (FDL) for pure tone in one study [21] but not in another [8].
The aforementioned studies focused on the relationship between FFR phase locking to a single frequency and behavioral pitch discrimination. The present study explores the FFR representations of frequency discrimination more directly. Specifically, FFRs evoked by two tones with different frequencies were discriminated so as to represent the frequency difference. We ask how well FFRs evoked by two frequencies can detect their frequency difference. Frequency discrimination abilities of normal hearing subjects were assessed. In each subject, the smallest detectable frequency difference between two pure tones, the frequency-difference limen (FDL), was measured psychoacousti-cally. Then we investigated whether FFR can detect frequency differences equal to, or even smaller than, the behavioral FDLs.
Methods
Experiments arrangement
Behavioral FDLs were obtained first for all subjects. Then, FFRs for two-tone stimuli were recorded for tones with frequency difference equal to: 1) FDL (100% FDL condition); 2) 75% of FDL (75% FDL condition); and 3) 50% of FDL (50% FDL condition). Some subjects with relatively large FDLs (with 50% FDL similar to the 75% FDL of other subjects) were selected to participate in the 50% FDL condition. The 50% FDLs of these subjects were paired with the 75% FDLs of others. Control FFRs were recorded with the earphone blocked and the subject’s ear occluded. The order of the FFR recordings was randomized. Each test or condition lasted around half an hour. For each subject, the tests were taken separately on different days in two weeks.
Subjects
Psychoacoustic experiment
Stimuli
Stimuli were tone pairs. One tone was always set at 140 Hz (the reference frequency or F_ref ) and the other (the comparison frequency or F_comp) at a higher frequency. The duration of both tones was 250 ms, including 10-ms rise/fall times shaped with a Black-man window. An insert earphone delivered the stimuli to the right ear. The overall level of each tone including onset and offset ramps was 83 dB SPL. Calibration was performed with a Brüel & Kjær type 3160-A-042 sound analyzer and a type 4157 2-cc coupler.
Behavioral procedure
Frequency discrimination was tested using an adaptive three-interval forced choice pro-cedure [two-down, one-up rule [22], programmed using MATLAB]. For each test trial, subjects heard three sequential intervals, two of them identical, containing the reference frequency F_ref, and the other one containing the comparison frequency F_comp. F_comp was always higher than 140 Hz and its initial value was 170 Hz. The three tones for each trial were assigned randomly. Subjects were instructed to identify the interval perceived as having a higher pitch by mouse clicking on the corresponding button on a computer monitor. The inter-sound interval was 0.8 s and there was a pause with 3-s dur-ation between the subject selecting an answer and the beginning of the next trial. After two consecutive correct responses, F_comp was decreased by one step for the subsequent trial; conversely, F_comp was increased by one step following a single incorrect response.
The step size was changed adaptively: its initial value, 6 Hz, was decreased to 1=pffiffiffi2of its previous value after each reversal. When the step size reached a pre-determined small value (0.1 Hz), it remained fixed. Each trial included 14 reversals, and the geometric mean of the frequency differences (F_comp-F_ref) across the last 8 reversals was taken as the FDL (in Hz). Every subject took at least one practice test and two formal tests. The mean of the formal tests was taken as the individual’s behavioral FDL. All tests were performed in an acoustically- and electrically-shielded booth.
FFR experiment Stimuli
Two tones with frequencies F_ref and F_comp were presented alternatively. The dur-ation of each tone was 144 ms, including 7-ms rise/fall times shaped with a Blackman window and 0° initial phase. This duration, shorter than that used in the psychoacoustic experiment, was of little consequence, since frequency discrimination improves minim-ally with increasing duration beyond 100 ms [23,24]. Stimuli were delivered to the right ear at 83 dB SPL through an insert earphone (Etymotic, ER-2) at a rate of 2.4 per sec-ond. The earphone was shielded in a Faraday cage, with the transducers and electric wires wrapped by aluminum foil linked to common ground [25,26].
F_ref was always 140 Hz but F_comp varied across the three FFR conditions for each subject. 1) In the 100% FDL condition, F_comp equaled 140 Hz plus FDL. 2) In the 75% FDL condition, F_comp equaled 140 Hz plus 75% of FDL. 3) In the 50% FDL con-dition, F_comp equaled 140 Hz plus 50% of FDL.
FFR recording
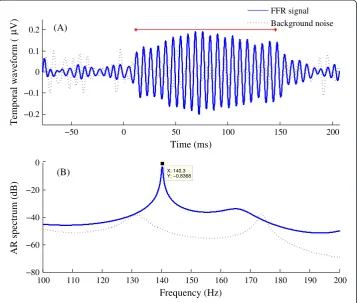
minimize myogenic artifacts. FFRs were recorded with a Grass LP511 AC amplifier and digitized by a National Instruments data acquisition card, as described in our previous work [27]. A vertical electrode montage [3,4], with the non-inverting electrode placed on the midline of the forehead at the hairline (+, Fz), a reference electrode placed on the ipsilateral mastoid (−, M2) and the common ground electrode placed on mid-forehead (Fpz). FFRs were recorded differentially from Fz-to-ipsilateral mastoid, ampli-fied by a factor of 50,000 and band-pass filtered (1–3000 Hz) online. FFR recording was started 77.7 ms before the onset of stimuli and was ended at 61.6 ms post-stimuli offset. Two thousand sweeps were recorded for each tone with a sampling rate of 10,000 Hz. The ear probe included an ER-2 earphone and a microphone (ER-10B+, Ety-motic research), through which the ear-canal sound pressure was recorded concurrently with FFR recordings. The sound pressure signal was used to ascertain appropriate place-ment of the earphone and to measure the system delay, including the travel time in the 30-cm rubber tubes. In addition, the cross-correlation between the sound pressure signal and FFR recording was performed and the time lag corresponding to the highest peak of the cross-correlation function was taken as the latency of FFR. All the latencies of our FFR recordings were in the range of 5 ~ 10 ms, much larger than the latency of cochlear microphonic occurring within 1 ms after the stimulation onset [28]. Background EEG noise was also recorded when stimuli were rendered inaudible by blocking the earphone. As shown by the dotted line in Figure 1, there were no periodic components in the back-ground noise. Thus, our FFR recordings reflected neural activity rather than CM or stimu-lus artifact [27].
FFR data processing and analysis
FFR processing and analysis were done offline, using software programmed in MATLAB, after isolating the 2000-sweep raw data for each of the two tones. Pre-processing was done first and then data were selected according to the calculated SNR. FFRs were analyzed both in the frequency and time domains (using spectra and auto-correlations, respectively) to extract the frequency encoded in the FFR. To represent the stimulus frequency difference, FFRs to paired tones was discriminated by compar-ing their spectra and autocorrelations.
Pre-processing
Details about pre-processing were described in our previous work [27]. Monitoring of sound in the ear canal permitted the identification and exclusion of trials which were contaminated by subject motion or slippage of the earphone. Trials in which the FFR signal excursions exceeded 95% of the measuring range of the recording equipment were also excluded from further analysis. The remaining trials were averaged together. Then, a posterior Wiener filtering and band-pass (70–210 Hz) filtering were used to re-duce noise. The analysis time window was 12 ~ 145.6 ms, corresponding to the steady-state portion of the stimulus tones.
Signal-to-noise ratio (SNR)
SNR < 0 dB), the subject’s FFR data were excluded from further statistical analysis. This happened for one subject in the 100% FDL condition and another in the 75% FDL con-dition. After these exclusions, the SNR values were 8.66 ± 4.1 dB (mean ± standard de-viation) for the 100% FDL condition and 8.31 ± 2.78 Hz for the 75% FDL condition.
Spectrum analysis
Data in the interval 12 ~ 145.6 ms were subjected to spectrum analysis. Classical spectrum analysis (e.g., the periodogram) was not used because of its poor frequency resolution: in our case, the resolution is about 1000 / (145.6-12) ms or ~7.48 Hz (i.e., larger than the behavioral FDLs). As an alternative, we chose the autoregressive (AR) spectral estimator, which has high resolution. The approximate resolution of AR spec-tral estimator is given in equation (1),
δfAR¼
1:03
p½ηðpþ1Þ0:31 ð1Þ
whereηis the SNR of one sinusoid,pis the order of the AR model [29] andpη> 10. The AR model parameters were estimated using the modified covariance method andp was set to 32. Since the minimum SNR was 4 dB,η≥4 and the frequency resolution of the AR spectrumδfAR< 0.007Hz.
−50 0 50 100 150 200
−0.2 −0.1 0 0.1 0.2
Time (ms)
Temporal waveform (
µV)
FFR signal Background noise
100 110 120 130 140 150 160 170 180 190 200
−80 −60 −40 −20 0
X: 140.3 Y: −0.8368
Frequency (Hz)
AR spectrum (dB)
(A)
(B)
One example of AR-spectrum estimation is shown in Figure 1. The highest spectral peak indicates the frequency at which the FFR has most of its energy, i.e., its “character-istic frequency”, corresponding to the stimulus frequency. The−10 dB frequency points at which the spectrum amplitude is 10 dB lower than the peak amplitude were ex-tracted. To separate FFRs to tones with different frequencies, the spectral peaks should be sufficiently narrow to prevent overlap at the −10 dB frequencies. Then, the“-10 dB frequency gap” was calculated by subtracting the higher −10 dB frequency of F_ref from the lower−10 dB frequency of F_comp, to estimate the separation between spec-tral peaks [see Figure 2(A)].
Autocorrelation
Autocorrelation (ACF) can be used to detect periodicity within a signal. After prepro-cessing, autocorrelation was performed by making a copy of the FFR signal and shifting it forward in time. For discrete signal representation, the entire signal isx(n),n= 1 ~N. N is the total number of sampling points. The autocorrelation function is computed as equation (2).
r mð Þ ¼
XN
n¼1x nð Þx nð −mÞ
XN
n¼1x 2
n
ð Þ ;m¼0eN−1 ð2Þ
The first peak in the normalized autocorrelation function at a non-zero lag re-flects the dominant periodicity. Autocorrelation can also be used to estimate the
120 130 140 150 160
−50 −40 −30 −20 −10 0
100% FDL
AR spectrum (dB)
0 50 100 150
−1 −0.5 0 0.5 1
ACF (normalized)
Time−lag (ms)
120 130 140 150 160
−50 −40 −30 −20 −10 0
75%FDL
AR spectrum (dB)
Frequency (Hz)
0 50 100 150
−1 −0.5 0 0.5 1
ACF (normalized)
Time−lag (ms) F−ref F−comp
Frequency(Hz)
(B) (A)
(D) (C)
characteristic frequency of the FFR, calculated as 1/d, where d is the time shift that yields a local maximum, representing the period of the FFR. d was estimated as the mean of the first ten inter-peak intervals, thus improving the accuracy of calculation.
Only FFRs evoked by F_ref were used to calculate FFR frequency tracking accuracy, since F_ref across all subjects and all experiment conditions were the same (140 Hz). The FFR signal was windowed into 30-ms bins with a 1-ms step shift of the window. The time lag of the maximum ACF peak in theithbin was τi. The RMS of differences between the time lags and the stimulus periodicity across all time bins serves as a measure of FFR frequency tracking accuracy, calculated as:
Δa¼
XQ
i¼1 τi− 1 f
2
Q
2 6 6 6 4
3 7 7 7 5
1 2
ð3Þ
where Q was the total number of time bins and f was the frequency of stimulus. HigherΔa values indicated poorer FFR frequency tracking accuracy results [27].
Statistical analysis
Statistical analysis was conducted with IBM SPSS Statistics 20.0 software. Levene’s Test for Equality of Variances and Shapiro-Wilk test for normality were applied for each statistical analysis except for non-parametric test.
Linear regression was used to assess the relationship between FFR measures and the stimulus frequency difference. The characteristic frequencies (FFR_F_ref and FFR_F_comp) of responses evoked respectively by the reference frequency, F_ref, and the comparison frequency, F_comp, were calculated in the frequency domain by AR spectrum estimation. The linear regression analyses were performed between the stimulus frequency difference (FD = F_comp-F_ref), the independent variable, and the FFR fre-quency difference (AR_FD = FFR_F_comp-FFR_F_ref), the dependent variable. In the case of autocorrelation method, the FFR period difference (ACF_PD = FFR_d_comp-FFR_d_ref) was taken as the dependent variable. A comparison of the regression results of 100% FDL condition and 75% FDL condition allowed ascertaining the correspondence between changes in the FFR measures and changes in the frequency difference between the tone stimuli.
Paired-Sample T tests were carried out to compare the differences on FFR frequency tracking accuracy in the 100% and 75% FDL conditions. For the comparison of 50% FDL condition and 75% FDL condition, non-parametric statistics Wilcoxon signed ranks tests were used.
Results
FFR representation of frequency difference
The FFR correlates of frequency differences were assessed by comparing the FFRs evoked by F_ref and F_comp in the spectral and time domains (Figure 2). Discrimin-ation between individual frequencies may be inferred from the absence of overlap be-tween the FFR spectra for the two stimuli and, in the time domain, from the difference between the FFR ACFs. Figure 2 illustrates the FFRs for one subject whose FDL was 5.63 Hz. The top and bottom rows, respectively, illustrate results for the 100% and 75% FDL conditions. The reference frequency F_ref was 140 Hz and the comparison fquencies F_comp were 145.63 Hz and 144.22 Hz. The left- and right-side panels, re-spectively, show the AR spectra and the FFR ACFs. As shown in Figure 2(A), the FFR spectra reach peaks at 140.57 Hz and 146.11 Hz and do not overlap at their -10 dB fre-quencies (where the -10 dB frequency gap between the spectra is 4.81 Hz). The spectra in panel B have peaks at 140.26 Hz and 144.24 Hz and a −10 dB frequency gap of 2.34 Hz. Graphs in the right illustrate the ACFs of the FFRs for frequencies F_ref and F_comp. The periods of the two FFR signals are 7.12 and 6.85 ms for F_ref and F_comp, respectively, in panel C and 7.12 and 6.93 ms in panel D.
Comparison of 100% FDL and 75% FDL conditions
Linear regression analyses of the FFR results for the 100% and 75% FDL conditions are shown in Figure 3. The differences between the characteristic frequencies of the FFRs evoked by paired tones (AR_FD) were used for linear regression analysis. Correlations between AR_FD and the stimulus FD were significant for both the 100% and the 75% FDL conditions [(A): R2= 0.59, p = 0.001; (B): R2= 0.53, p = 0.003)]. Thus, it is clear that FFRs can detect the stimulus frequency differences for these two conditions. Panels C and D show that the differences between autocorrelation time lags (ACF_PD) were also
1 2 3 4 5 6
0 2 4 6
R2 = 0.59 p = 0.001
100% FDL AR−FD (Hz)
Stimuli FD (Hz)
1 2 3 4 5 6
−0.3 −0.2 −0.1 0
R2 = 0.88 p <0.001
ACF−PD (ms)
Stimuli FD (Hz)
1 2 3 4
0 2 4 6
R2 = 0.53 p = 0.003
Stimuli FD (Hz)
75% FDL
AR−FD (Hz)
1 1.5 2 2.5 3 3.5 4 4.5
−0.3 −0.2 −0.1 0
R2 = 0.77 p <0.001
Stimuli FD (Hz)
ACF−PD (ms)
(A) (C)
(B) (D)
significantly correlated with stimulus frequency differences [(C): R2= 0.88, p < 0.001; (D): R2= 0.77, p < 0.001)]. To conclude, when subjects can detect a frequency difference behaviorally in 100% FDL condition, the same difference is also reflected by the FFR; and the FFR could also reflect a difference that was not behaviorally detectable in 75% of FDL condition. The results of FDL and FFR frequency tracking for the 100% and 75% FDL conditions in all subjects are listed in Table 1. Two tailed paired-sampled T tests were performed comparing tracking accuracy Δa in the two conditions. For 13 subjects with available data from both conditions, no significant differences were found [t (12) = 1.87, p = 0.086]. Besides, subjects S1 ~ S12 in 100% FDL were paired with sub-jects S4 ~ S15 in 75% FDL to achieve similar stimulus FD for the two conditions, and still no significant difference existed [t (10) = 1.32, p = 0.215]. In other words, FFRs de-tected frequency differences smaller than the FDLs because of FFRs’ accurate phase-locking to individual frequencies.
Comparison of 75% FDL and 50% FDL condition
Six subjects whose 50% FDL was similar to the 75% FDL of other subjects were selected to participate in the 50% FDL condition, as listed in Table 2. Subjects with FDLs in the 50% FDL condition were paired with other subjects whose FDL in the 75% FDL condi-tion were similar. For example, subject S12 in the 50% FDL condicondi-tion was paired to subject S5 in the 75% FDL condition. Comparisons of FFRs differences are shown in Figure 4 for Subject S2 (75% FDL condition) and Subject S8 (50% FDL condition). In the
Table 1 Behavioral FDL and FFR frequency tracking for all subjects
Subject FDL 100% FDL condition 75% FDL condition AR_FD ACF_PD Δα
(ms)
AR_FD ACF_PD Δα (ms)
No. (Hz) (Hz) (ms) (Hz) (ms)
S1 1.72 1.55 −0.07 0.219 1.51 −0.04 0.158
S2 2.67 0.88 −0.08 0.112 2.51 −0.10 0.081
S3 2.96 4.12 −0.13 0.206 2.48 −0.08 0.138
S4 2.96 2.21 −0.13 0.147 2.60 −0.10 0.086
S5 3.11 3.09 −0.13 0.131 0.96 −0.06 0.131
S6 3.24 4.39 −0.17 0.126 2.87 −0.13 0.127
S7 3.44 None None None 3.81 −0.20 0.226
S8 3.51 2.57 −0.14 0.365 2.34 −0.13 0.102
S9 3.57 3.6 −0.19 0.107 2.20 −0.12 0.153
S10 3.58 4.93 −0.17 0.195 None None None
S11 4.54 4.31 −0.25 0.127 2.68 −0.16 0.083
S12 4.66 4.84 −0.28 0.128 3.62 −0.22 0.103
S13 5.37 4.63 −0.26 0.083 3.64 −0.26 0.148
S14 5.54 4.69 −0.25 0.297 3.58 −0.27 0.172
S15 5.63 5.54 −0.27 0.088 3.97 −0.19 0.094
Mean 3.77 3.67 −0.18 0.17 2.77 −0.15 0.13
Standard deviation 1.10 1.35 0.07 0.08 0.85 0.07 0.04
75% FDL condition, two FFRs evoked by 140 Hz and 142 Hz showed spectral peaks at 139.48 and 141.93 Hz, respectively. The gap between −10 dB frequencies of the two spectra is 2.37 Hz. For the 50% FDL condition, the spectra in panel B with peaks at 139.69 and 141.56 Hz largely overlapped and the −10 dB frequency gap was −1.59 Hz. Panels in the right illustrate the ACFs for the FFRs evoked by F_ref and F_comp. The FFR periods in the 75% FDL condition (panel C) are different, 7.15 and 7.05 ms, whereas the FFR periods for the 50% FDL condition (panel D) are nearly the same (7.12 and 7.1 ms). Wilcoxon signed ranks test showed the FFR frequency tracking accuracy (seeΔa in Table 2) was significantly poorer in the 50% FDL condition than the 75% FDL
Table 2 Paired subjects in two FFR conditions with same stimulus FD
Pair NO.
75% FDL condition 50% FDL condition
Subject Stimulus Δα Subject Stimulus Δα
NO. FD (Hz) (ms) NO. FD (Hz) (ms)
1 S2 2 0.081 S8 1.76 0.15
2 S3 2.22 0.138 S9 1.79 0.163
3 S4 2.22 0.086 S11 2.27 0.319
4 S5 2.33 0.131 S12 2.33 0.176
5 S8 2.63 0.102 S15 2.82 0.156
6 S9 2.68 0.153 S13 2.68 0.166
Mean 2.35 0.12 2.28 0.19
Standard deviation 0.24 0.03 0.40 0.06
120 130 140 150 160
−60 −50 −40 −30 −20 −10 0
Frequency (Hz)
75%FDL
AR spectrum (dB)
120 130 140 150 160
−70 −60 −50 −40 −30 −20 −10 0
Frequency (Hz)
50%FDL
AR spectrum (dB)
0 50 100 150
−1 −0.5 0 0.5 1
Time−lag (ms)
ACF (normalized)
0 50 100 150
−1 −0.5 0 0.5 1
Time−lag (ms)
ACF (normalized)
F−ref F−comp
(A)
(B)
(C)
(D)
condition (z =−2.201, p = 0.028). Thus, FFRs detected the frequency difference in the 75% FDL condition, but not in the 50% FDL condition, even though the stimulus fre-quency differences were similar in both conditions.
Discussion
Frequency-difference discrimination in humans is usually tested using psychophysical methods, which depend on the entire auditory system. Behavioral just noticeable fre-quency differences above 500 Hz increase in proportion to the reference frefre-quency at a rate of 0.2%; the just noticeable frequency difference at lower frequencies is about 1 Hz [2]. In the present study, behavioral FDLs varied from 1.72 to 5.63 Hz with mean (standard deviation) being 3.79 (1.18) Hz, or 1.23% ~ 4.02% of the reference frequency 140 Hz with mean relative FDL being 2.71%.
Physiological representations of frequency difference were measured using FFRs evoked by pairs of tones. In the 100% FDL condition, when subjects detected a fre-quency difference behaviorally, the FFRs also reflected that frefre-quency difference. In the 75% FDL condition, when the subjects could not recognize the frequency difference, the FFR still detected a difference. This indicates that the FFR correlate of frequency discrimination is smaller than the FDL, probably due to additional factors such as at-tention and short-term working memory. Musicians might be better in short-term working memory so that yielded significant better performance both neutrally and be-haviorally than non-musician English speakers [15]. Besides, Marmel et al. found that behavioral FDL was not only affected by FFR phase-locking but also absolute thresholds [21]. Our results are consistent with a study by Clinard et al. which also demonstrated that FFRs could detect smaller frequency differences than the FDLs [8]. In Clinard et al. study, the ratio of FFR phase coherences between the two frequencies (for ex-ample, 998:1000 Hz) was related to behavioral FDL (at 1000 Hz), but the ratio was not significantly predictive of behavioral FDL [8].
In a previous study on frequency discrimination of auditory cortex, MMNs were elicited by frequency changes of 2.5%, 5%, 10% and 20% across a frequency range of 250 ~ 4000 Hz [30]. Larger frequency differences elicited MMNs with larger amplitudes and shorter latencies. In other words, it was more accurate for the cortex to distinguish larger frequency difference. Consistently, in our study FFR phase-locking was more accurate when evoked by stimuli with larger frequency difference. The accuracy of FFR frequency tracking was similar for frequency differences equal to 100% FDL and 75% FDL, but FFR frequency tracking accuracy significantly decreased in the 50% FDL condition. We pre-sume that the strength of the FFR representation of frequency differences covaried with the FDLs, which is consistent with results of some previous studies [15,17-21].
Conclusion
Abbreviations
ABR:Auditory brainstem response; AR: Autoregressive; ACF: Autocorrelation function; FD: Frequency difference; FDL: Frequency difference limen; FFR: Frequency following response; F_ref: The reference frequency; F_comp: The comparison frequency; PD: Period difference; SPL: Sound pressure level; SNR: Signal to noise ratio; RMS: Root mean square.
Competing interest
The authors report no declarations of interest.
Authors’contributions
QG designed the experiments and was responsible for revising this manuscript. This study originated from QG’s idea and problems were solved under her directions. QX initiated and conceived the algorithm, analyzed the data and drafted this paper’s manuscript. All authors read and approved the final manuscript.
Acknowledgement
The authors are grateful for the support of the National Natural Science Foundation of China under the grant no. 61271133, Basic Development Research Key program of Shenzhen under grant no. JC 201105180808A, Specialized Research Fund for the Doctoral Program of Higher Education under grant no.20120002110054, Tsinghua National Laboratory for Information Science and Technology (TNList) Cross-discipline Foundation. The authors thank the referee and professor Mario Ruggero (Northwestern University) for helpful comments.
Received: 14 January 2014 Accepted: 4 August 2014 Published: 9 August 2014
References
1. Shofner WP:Representation of the spectral dominance region of pitch in the steady-state temporal discharge patterns of cochlear nucleus units.J Acoust Soc Am2008,124:3038–3052.
2. Zwicker E, Fastl H:Pitch and pitch strength.InPsychoacoustics: facts and models.Berlin: Springer; 2007:111–148. 3. Krishnan A:Frequency-following response.InAuditory evoked potentials: basic principles and clinical application.
Edited by Burkard RF, Don M, Eggermont JJ. Baltimore: Lippincott Williams & Wilkins; 2007:313–333. 4. Skoe E, Kraus N:Auditory brain stem response to complex sounds: a tutorial.Ear Hear2010,31:302–324. 5. Plack CJ, Barker D, Hall DA:Pitch coding and pitch processing in the human brain.Hearing Res2014,307:53–64. 6. Krishnan A, Xu YS, Gandour JT, Cariani PA:Encoding of pitch in the human brainstem is sensitive to language
experience.Cognitive Brain Res2005,25:161–168.
7. Anderson S, Parbery-Clark A, White-Schwoch T, Kraus N:Aging affects neural precision of speech encoding. J Neurosci2012,32:14156–14164.
8. Clinard CG, Tremblay KL, Krishnan A:Aging alters the perception and physiological representation of frequency: evidence from human frequency-following response recordings.Hearing Res2010,264:48–55. 9. Russo NM, Skoe E, Trommer B:Deficient brainstem encoding of pitch in children with autism spectrum
disorders.Clin Neurophysiol2008,119:1720–1731.
10. Krishnan A, Gandour JT:The role of the auditory brainstem in processing linguistically-relevant pitch patterns. Brain Lang2009,110:135–148.
11. Krishnan A, Gandour JT, Bidelman GM:The effects of tone language experience on pitch processing in the brainstem.J Neurolinguist2010,23:81–95.
12. Kraus N, Skoe E, Parbery-Clark A, Ashley R:Experience-induced malleability in neural encoding of pitch timbre and timing implications for language and music.The neurosciences and music III–Disorders and Plasticity: Ann NY Acad Sci2009,1169:543–557.
13. Musacchia G, Sams M, Skoe E, Kraus N:Musicians have enhanced subcortical auditory and audiovisual processing of speech and music.P Natl Acad Sci USA2007,104:15894–15898.
14. Wong PCM, Skoe E, Russo NM, Dees T, Kraus N:Musical experience shapes human brainstem encoding of linguistic pitch patterns.Nat Neurosci2007,10:420–422.
15. Bidelman GM, Gandour JT, Krishnan A:Cross-domain effects of music and language experience on the representation of pitch in the human auditory brainstem.J Cognitive Neurosci2011,23:425–434.
16. Song JH, Skoe E, Wong PCM, Kraus N:Plasticity in the adult human auditory brainstem following short-term linguistic training.J Cognitive Neurosci2009,20:1892–1902.
17. Carcagno S, Plack CJ:Subcortical plasticity following perceptual learning in a pitch discrimination task.J Assoc Res Otolaryngol2011,12:89–100.
18. Krishnan A, Bidelman GM, Gandour JT:Neural representation of pitch salience in the human brainstem revealed by psychophysical and electrophysiological indices.Hearing Res2010,268:60–66.
19. Krishnan A, Bidelman GM, Smalt CJ, Ananthakrishnan S, Gandour JT:Relationship between brainstem, cortical and behavioral measures relevant to pitch salience in humans.Neuropsychologia2012,50:2849–2859. 20. Smalt CJ, Ananthanarya K, Bidelman GM, Ananthakrishnan S, Gandour J:Distortion products and their influence
on representation of pitch-relevant information in the human brainstem for unresolved harmonic complex tones.Hearing Res2012,292:26–34.
21. Marmel F, Linley D, Carlyon RP, Gockel HE, Hopkins K, Plack CJ:Subcortical neural synchrony and absolute thresholds predict frequency discrimination independently.J Assoc Res Otolaryngol2013,14:757–766. 22. Levitt H:Transformed up-down methods in psychoacoustics.J Acoust Soc Am1971,49:467–477.
23. Micheyl C, Xiao L, Oxenham AJ:Characterizing the dependence of pure-tone frequency difference limens on frequency, duration, and level.Hearing Res2012,292:1–13.
25. Akhoun I, Moulin A, Jeanvoine A, Ménard M, Buret F, Vollaire C, Scorretti R, Veuillet E, Berger-Vachon C, Collet L, Thai-Van H:Speech auditory brainstem response (speech ABR) characteristics depending on recording conditions, and hearing status: an experimental parametric study.J Neurosci Meth2008,175:196–205.
26. Campbell T, Kerlin JR, Bishop CW, Miller LM:Methods to eliminate stimulus transduction artifact from insert earphones during electroencephalography.Ear Hear2012,33:144–150.
27. Gong Q, Xu Q, Sun WS:Design and implementation of frequency following response recording system.Int J Audiol2013,52:824–831.
28. Stillman RD, Crow G, Moushegian G:Components of the frequency-following potential in man.Electroen Clin Neuro1978,44:438–446.
29. Kay SM:Modern spectral estimation: theory and application.Prentice-Hall: Englewood Cliffs, NJ; 1988.
30. Novitski N, Tervaniemi M, Huotilainen M, Naatanen R:Frequency discrimination at different frequency levels as indexed by electro-physiological and behavioral measures.Cognitive Brain Res2004,20:26–36.
doi:10.1186/1475-925X-13-114
Cite this article as:Xu and Gong:Frequency difference beyond behavioral limen reflected by frequency following response of human auditory Brainstem.BioMedical Engineering OnLine201413:114.
Submit your next manuscript to BioMed Central and take full advantage of:
• Convenient online submission
• Thorough peer review
• No space constraints or color figure charges
• Immediate publication on acceptance
• Inclusion in PubMed, CAS, Scopus and Google Scholar
• Research which is freely available for redistribution