R E S E A R C H
Open Access
Model-based PEEP optimisation in mechanical
ventilation
Yeong Shiong Chiew
1, J Geoffrey Chase
1, Geoffrey M Shaw
2, Ashwath Sundaresan
1and Thomas Desaive
3** Correspondence: [email protected]. be
3Thermodynamics of Irreversible
Processes, Institute of Physics, University of Liège, Belgium Full list of author information is available at the end of the article
Abstract
Background:Acute Respiratory Distress Syndrome (ARDS) patients require mechanical ventilation (MV) for breathing support. Patient-specific PEEP is
encouraged for treating different patients but there is no well established method in optimal PEEP selection.
Methods:A study of 10 patients diagnosed with ALI/ARDS whom underwent recruitment manoeuvre is carried out. Airway pressure and flow data are used to identify patient-specific constant lung elastance (Elung) and time-variant dynamic lung
elastance (Edrs) at each PEEP level (increments of 5cmH2O), for a single compartment
linear lung model using integral-based methods. Optimal PEEP is estimated using Elungversus PEEP,Edrs-Pressure curve andEdrsArea at minimum elastance (maximum
compliance) and the inflection of the curves (diminishing return). Results are compared to clinically selected PEEP values. The trials and use of the data were approved by the New Zealand South Island Regional Ethics Committee.
Results:Median absolute percentage fitting error to the data when estimating time-variantEdrsis 0.9% (IQR = 0.5-2.4) and 5.6% [IQR: 1.8-11.3] when estimating constant
Elung. Both ElungandEdrsdecrease with PEEP to a minimum, before rising, and
indicating potential over-inflation. MedianEdrsover all patients across all PEEP values
was 32.2cmH2O/l [IQR: 26.1-46.6], reflecting the heterogeneity of ALI/ARDS patients,
and their response to PEEP, that complicates standard approaches to PEEP selection. AllEdrs-Pressure curves have a clear inflection point before minimumEdrs, making
PEEP selection straightforward. Model-based selected PEEP using the proposed metrics were higher than clinically selected values in 7/10 cases.
Conclusion:Continuous monitoring of the patient-specificElungandEdrsand minimally
invasive PEEP titration provide a unique, patient-specific and physiologically relevant metric to optimize PEEP selection with minimal disruption of MV therapy.
Keywords:ARDS, ALI, Elastance, Compliance, PEEP, Critical care, Mechanical Ventilation
1 Introductions
Acute respiratory distress syndrome (ARDS) and acute lung injury (ALI), occurs due to severe inflammatory response of the lung, resulting in direct alveolar injury, pulmonary oedema and alveolar collapse [1,2]. The lung injury greatly impairs the patients breath-ing, reducing alveolar gas exchange, resulting in possible mortality and morbidity if not given a proper treatment. ALI/ARDS patients are associated with high morbidity, mor-tality up to 60% [3] and significant medical cost [4].
Patients diagnosed with ALI/ARDS are mechanically ventilated for breathing support [5,6]. Various mechanical ventilation (MV) modes have been introduced to clinicians for the support of patients with ALI/ARDS [7]. However, the fundamentals of MV remains in selecting an optimal positive end-expiratory pressure (PEEP) to maximise patients’lung recruitment, prevent alveoli collapse, and avoid ventilator induced lung injury (VILI) [8]. The heterogeneity of the disease and patients’variable response to MV, encourages PEEP treatment to be patient-specific and individualised. However, there is no gold standard method in PEEP selection; consequently, optimising patient-specific PEEP in MV remains a challenge for clinicians [9-11].
Model-based and patient-specific approaches offer the ability to identify intra- and inter-patients variability and thus, potential to guide MV therapy based on patient’s condition and needs [12,13]. This approach provides the opportunity to balance risk of lung injury and lung function support and reduce work of breathing [14] during MV. However, to date, only a few have been tested [15-17] and their potential in critical care is not yet validated.
This research presents several model-based approaches to identify patient-specific disease state and patient-specific response to MV therapy using patient-specific, con-stant lung elastance (Elung) [16,18] with comparison of dynamic lung elastance (Edrs) in
ALI/ARDS. Dynamic lung elastance (Edrs) is a time-variant lung elastance during each
breath in MV.Elungand Edrs are thus proposed for guiding PEEP selection. By
moni-toring both the identified parameters (Elastance = 1/Compliance) through limited PEEP titration, it is possible to identify PEEP settings that maximize recruitment, mini-mize work of breathing without inducing lung injury.
2 Methods 2.1 Study Design
Ten patients in the Intensive Care Unit (ICU), Christchurch Hospital, New Zealand,
diagnosed with ALI or ARDS (PaO2/FiO2(PF ratio) between 150-300 mmHg),
under-went a modified protocol-based recruitment manoeuvre (RM) [17]. PEEP is increased with increments of 5cmH2Ofrom zero PEEP (ZEEP) until peak airway pressure reaches
a limit of 45cmH2O[19]. Patients were sedated and paralyzed with muscle relaxants to
prevent spontaneous breathing efforts. All patients were ventilated using Puritan Ben-nett PB840 ventilators (Covidien, Boulder, CO, USA) with volume control (tidal
volume, Vt= 400~600ml), synchronized intermittent mandatory ventilation (SIMV)
mode, throughout the trial. The clinical trials and the use of the data were approved by the New Zealand, South Island Regional Ethics Committee.
A heated-pneumotachometer with Hamilton Medical flow sensor (Hamilton Medical, Switzerland) connected to the ventilator circuit Y-piece is used to record patient’s airway pressure and flow data. A Dell™(Dell, Austin, TX, USA) laptop was used in conjunction with National Instruments USB6009 and Labview Signal Express (National Instruments, Austin, TX, USA) to obtain measurements at a sampling rate of 100 Hz. Analysis was performed using MATLAB (The Mathworks, Natick, Massachusetts, USA).
2.2 Model-based Analysis
The model-based approach incorporates a physiologically relevant and validated recruitment model [17,20] with the use of a single compartment linear lung model
Chiewet al.BioMedical Engineering OnLine2011,10:111 http://www.biomedical-engineering-online.com/content/10/1/111
that captures fundamental lung mechanics and properties in real-time to identify patient-specific constant lung elastance (Elung) and dynamic lung elastance (Edrs) during
MV. The model uses transpulmonary pressure (Ptp), volume (V) and flow (Q) and
off-set pressure (P0), to identify lung elastance (Elung) and resistance (Rlung). Patient-specific
lung elastance,Elungreflects the lung stiffness (1/Compliance). Therefore, a lowerElung
is a more compliant lung. Elung is identified from measured data using an
integral-based method [21]. The model is defined:
Ptp=ElungV+RlungQ+P0 (1)
Airway pressure is related to transpulmonary pressure (Ptp) and pleural pressure (Ppl)
by:
Ptp=Paw−Ppl (2)
When the patient is sedated and fully dependant on the ventilator to breathe, it can be assumed that there is no chest wall activity, allowing Pplto be omitted in this case.
Equation 1 is then further modified to eliminatePpl, yielding:
Paw=ElungV+RlungQ+P0 (3)
Patient-specific dynamic lung elastance,Edrs, is identified as a time-variant lung
ela-stance and Equation (3) is defined:
Paw(t) =Edrs(t)V(t) +RlungQ(t) +P0 (4)
To ensure that the identified parameters of constant Elungand time-variantEdrs(Edrs
(t)) are valid, the absolute percentage error between the identified model and measured clinical pressure data is reported.
2.3 Model-Based PEEP Selection
During each breathing cycle, as PEEP rises, lung elastance (Elung) falls as new lung
volume is recruited faster than the pressure build-ups in the lung. If little or no
recruitment occurs, Elung rises with PEEP indicating that pressure above that PEEP
level was unable to recruit significant new lung volume and is, instead, beginning to stretch already recruited lung [22]. Hence, recruitment and potential lung injury can be balanced by selecting PEEP at minimum Elung.
Compared to a single, constantElungvalue at each PEEP, identifying time-variantEdrs
allows this change to be seen dynamically within each breath as pressure increases
thus allowing a more detail view of patient’s lung physiological condition. Three
model-based approaches based on patient-specific Elung and Edrs trajectory in a
patient’s breath at different PEEP levels are used to optimize PEEP selection.
MinimumEdrsandElung: locates the point where minimumEdrsor Elungoccurs over
all PEEP values (and pressure for Edrs) during the recruitment manoeuvre.
MinimumEdrs Area: Edrs Area is obtained by integratingEdrs over time during the
patient’s breathing cycle at each PEEP. EdrsArea is more clinically relevant than
med-ian or mean Edrsthroughout each breath and can be shown to be proportional to
patient-specific work of breathing.
Inflection Method: This method detects the inflection in the EdrsArea-PEEP and
above (before) minimumEdrsArea orElung(105~110% of minimumEdrsArea orElung).
PEEP is selected where inflection occurs, as a point of diminishing returns.
The overall approach implies that as long asEdrs falls during each breath, as PEEP
level increases, that recruitment of new volume outweighs lung stretching as flow and volume follow a path of lesser or least resistance. These methods are thus attempts to
maximize recruitment (Minimum Edrsand MinimumEdrsArea) and also ensure safety
from excessive pressure (Inflection Method). These metrics are three of many possibili-ties to demonstrate the concept.
2.4 Edrs Area and Work of Breathing
These approaches were also compared with selecting PEEP using the identified
mini-mum or inflection of constant Elung, for comparison to other similar work [23].
Patient-specificElungandEdrs are only analyzed during inspiration and not during the
expiratory cycle. This choice was made because increases in pressure induce lung damage as it passes a limit and thus expiration (decreasing pressure) should not be used to guide PEEP selection.
A higher resolution of the trend changes in Edrscan be observed usingEdrsArea.Edrs
Area is obtained through integration ofEdrswith time. It is also known that the work
of breathing (WOB) [24,25] for a patient is proportional to lung elastance. In general,
more work is required to fill a given lung volume with higher elastance. WOB is
defined:
WOB=Paw×V (5)
Substituting Paw from Equation (3) into Equation (5) and using P0 = 0,
(atmo-spheric).
WOB= (ElungV+RlungQ)×V
=ElungV2+RlungQV
(6)
From Equation (6), work of breathing can be divided into work to overcome lung
elastance (WOBE = ElungV2) and work to overcome airway resistance (WOBR =
RlungQV). Substitution of dynamic lung elastance, Edrs, for constantElungenables a
deri-vation forWOBE:
Edrs=WOBE(t)/V(t)2 (7)
EdrsArea in Equation (8) is the integral of Equation (7), yielding the relation of Edrs
to the work of breathing required to overcome lung elastance at a given level of PEEP and mode of MV.
EdrsArea=
Edrs(t)dt (8)
2.5 Analysis and Comparisons
In this study, Elungand medianEdrsare compared using Pearson’s linear correlation
coefficients to relate these metrics. Elung andEdrs Area are also compared to median
EdrsandWOBEto ensure there was no loss of information for each patient at different
PEEP values, and to show the validity of Equation (7) and using Edrs Area. Finally,
Chiewet al.BioMedical Engineering OnLine2011,10:111 http://www.biomedical-engineering-online.com/content/10/1/111
clinically selected PEEP is compared to the value determined by proposed model-based metrics.
3 Results
Table 1 shows the clinical details of the 10 patients recruited with their clinical diag-nostics, and PF ratios. Table 2 shows the median [Inter-quartile Range (IQR)]Edrs for
each patient and PEEP, and absolute percentage fitting error. Median absolute percen-tage fitting error (APEEdrs(t)) across all patients and PEEP is 0.9% [IQR: 0.5-2.4]. Med-ian Edrsat each PEEP is 32.2cmH2O/l[IQR: 26.1-46.6]. Median [IQR] Edrsdecreases
with increasing PEEP until the minimum Edrs. Patients who suffer from COPD
(Patients 1, 4, 5, 9 and 10) have significantly higher Edrs than others (P < 0.0001), as
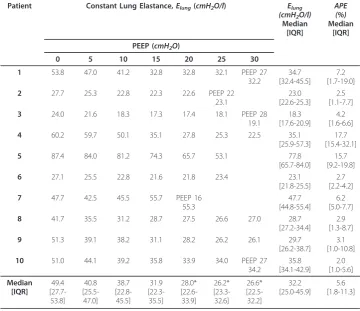
expected clinically. Table 3 shows the constant lung elastance (Elung) at each PEEP
with median = 32.2cmH2O/l [IQR: 25.0-45.9], and absolute percentage fitting
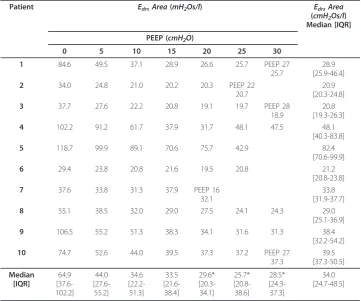
(APEE-lung) at 5.6% [IQR: 1.8-11.3]. Table 4 shows theEdrs Area at each PEEP with median
[IQR] of 34.0cmH2Os/l [IQR: 24.7-48.5].
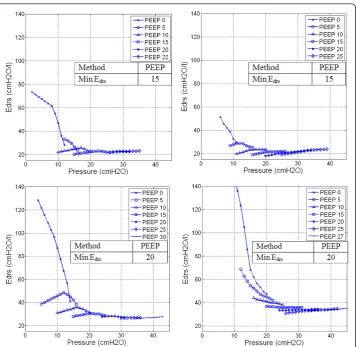
Figure 1 shows patient-specific time-varyingEdrsat each PEEP level for Patients 2, 6,
8 and 10. Edrsdecreases as pressure increases at each PEEP. However, at higher PEEP,
this trend can reverse indicating stretching exceeding recruitment of new lung volume. The optimal PEEP derived by minimum Edrsis indicated.
Figure 2 shows patient-specific Edrs Area for Patients 2, 6, 8 and 10 with PEEP. The
optimal PEEP is derived using minimum EdrsArea and Inflection method with the
band of 5-10% above minimum EdrsArea shown by the dashed-lines.
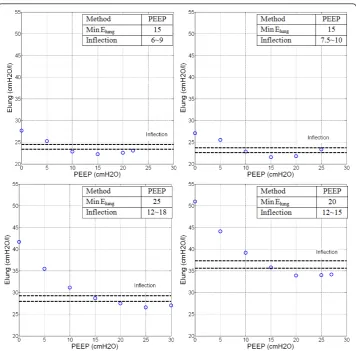
Figure 3 shows patient-specific constant lung elastance (Elung) with increasing PEEP
for Patients 2, 6, 8 and 10. Elung decreases with PEEP and the trend is similar to the
Edrs Area-PEEP plot of Figure 2, as expected from the high correlation. The optimal
PEEP using minimum Elungand InflectionElung(Dashed-lines) are also indicated.
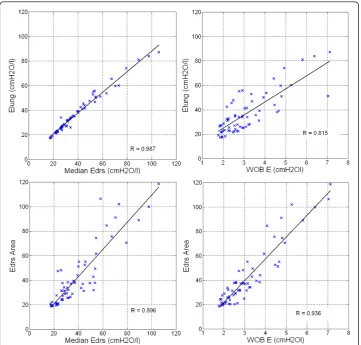
Across all 10 patients, patient-specific constant lung elastance (Elung) can be
repre-sented by the median of dynamic lung elastance (Edrs) with correlation R = 0.987.
Cor-relation of Elung andWOBEis R = 0.815. EdrsArea and medianEdrsare also closely
correlated with R = 0.896. Hence, Edrs can be represented with Edrs Area, whereEdrs
Area captures all Edrs values in a given breath and thus, is a more physiologically
representative metric. Finally, validating Equation (2), EdrsArea is correlated to the
work to overcome lung elastance, WOBE, as expected, with R = 0.936. The correlations
are shown in Figure 4.
Table 1 Patient demography.
Patients Sex Age (year) Clinical Diagnostic PF Ratio
1 F 61 Peritonitis, COPD 214
2 M 22 Trauma 180
3 M 55 Aspiration 222
4 M 88 Pneumonia, COPD 165
5 M 59 Pneumonia, COPD 285
6 M 69 Trauma 280
7 M 56 Legionnaires 265
8 F 54 Aspiration 302
9 M 37 H1N1, COPD* 182
10 M 56 Legionnaires, COPD 237
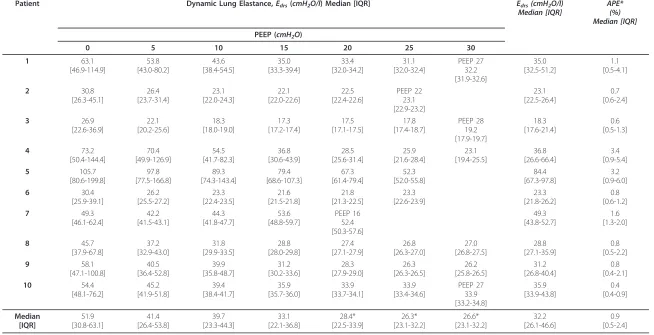
Table 2 Patient-specific dynamic lung elastance (Edrs) at each PEEP level.
Patient Dynamic Lung Elastance,Edrs(cmH2O/l) Median [IQR] Edrs(cmH2O/l) Median [IQR]
APE* (%) Median [IQR]
PEEP (cmH2O)
0 5 10 15 20 25 30
1 63.1 [46.9-114.9] 53.8 [43.0-80.2] 43.6 [38.4-54.5] 35.0 [33.3-39.4] 33.4 [32.0-34.2] 31.1 [32.0-32.4] PEEP 27 32.2 [31.9-32.6] 35.0 [32.5-51.2] 1.1 [0.5-4.1] 2 30.8 [26.3-45.1] 26.4 [23.7-31.4] 23.1 [22.0-24.3] 22.1 [22.0-22.6] 22.5 [22.4-22.6] PEEP 22 23.1 [22.9-23.2] 23.1 [22.5-26.4] 0.7 [0.6-2.4] 3 26.9 [22.6-36.9] 22.1 [20.2-25.6] 18.3 [18.0-19.0] 17.3 [17.2-17.4] 17.5 [17.1-17.5] 17.8 [17.4-18.7] PEEP 28 19.2 [17.9-19.7] 18.3 [17.6-21.4] 0.6 [0.5-1.3] 4 73.2 [50.4-144.4] 70.4 [49.9-126.9] 54.5 [41.7-82.3] 36.8 [30.6-43.9] 28.5 [25.6-31.4] 25.9 [21.6-28.4] 23.1 [19.4-25.5] 36.8 [26.6-66.4] 3.4 [0.9-5.4] 5 105.7 [80.6-199.8] 97.8 [77.5-166.8] 89.3 [74.3-143.4] 79.4 [68.6-107.3] 67.3 [61.4-79.4] 52.3 [52.0-55.8] 84.4 [67.3-97.8] 3.2 [0.9-6.0] 6 30.4 [25.9-39.1] 26.2 [25.5-27.2] 23.3 [22.4-23.5] 21.6 [21.5-21.8] 21.8 [21.3-22.5] 23.3 [22.6-23.9] 23.3 [21.8-26.2] 0.8 [0.6-1.2] 7 49.3 [46.1-62.4] 42.2 [41.5-43.1] 44.3 [41.8-47.7] 53.6 [48.8-59.7] PEEP 16 52.4 [50.3-57.6] 49.3 [43.8-52.7] 1.6 [1.3-2.0] 8 45.7 [37.9-67.8] 37.2 [32.9-43.0] 31.8 [29.9-33.5] 28.8 [28.0-29.8] 27.4 [27.1-27.9] 26.8 [26.3-27.0] 27.0 [26.8-27.5] 28.8 [27.1-35.9] 0.8 [0.5-2.2] 9 58.1 [47.1-100.8] 40.5 [36.4-52.8] 39.9 [35.8-48.7] 31.2 [30.2-33.6] 28.3 [27.9-29.0] 26.3 [26.3-26.5] 26.2 [25.8-26.5] 31.2 [26.8-40.4] 0.8 [0.4-2.1] 10 54.4 [48.1-76.2] 45.2 [41.9-51.8] 39.4 [38.4-41.7] 35.9 [35.7-36.0] 33.9 [33.7-34.1] 33.9 [33.4-34.6] PEEP 27 33.9 [33.2-34.8] 35.9 [33.9-43.8] 0.4 [0.4-0.9] Median [IQR] 51.9 [30.8-63.1] 41.4 [26.4-53.8] 39.7 [23.3-44.3] 33.1 [22.1-36.8] 28.4* [22.5-33.9] 26.3* [23.1-32.2] 26.6* [23.1-32.2] 32.2 [26.1-46.6] 0.9 [0.5-2.4]
*APE - Absolute Percentage Fitting Error (%) *Values presented include value from different PEEP.
Table 5 compares clinically selected PEEP during MV therapy with PEEP selected using Minimum Edrs, and MinimumEdrsArea and the Inflection method. The clinical
values are set over a much narrower range, both higher and lower than those selected usingEdrs. MinimumEdrsArea always selects a higher PEEP, by definition, than the
Inflection method. However, Minimum EdrsArea selects PEEP similar to or higher
than MinimumEdrs, where it also thus adds consideration of the reduction in overall
WOBEin selecting PEEP. PEEP derived from minimum Elung and InflectionElungare
also indicated.
4 Discussion
4.1 Model-based PEEP Selection
Median fitting error for time-variant Edrsin Table 2 is less than 1%, showing that a
sin-gle compartment lung model can be used for time-varying Edrs estimation. The wide
range of patient-specificEdrsacross all patients and PEEP shown in Table 2 reflects the
heterogeneity of ALI/ARDS patient condition and response to PEEP that makes stan-dardising and PEEP selection difficult [26]. Compared to the estimation of Elungin
Table 3, median fitting error is 5.6% and in specific cases, fitting error can be as high as 15.7-17.7% (Patients 4 and 5). This latter result indicates that a first order model can be used to estimate most patient-specific constant Elung, but, in several cases, the
model may not accurately represent patients’physiological condition. Time-varying
Table 3 Patient-specific constant lung elastance (Elung) at different PEEP.
Patient Constant Lung Elastance,Elung(cmH2O/l) Elung
(cmH2O/l)
Median [IQR] APE (%) Median [IQR]
PEEP (cmH2O)
0 5 10 15 20 25 30
1 53.8 47.0 41.2 32.8 32.8 32.1 PEEP 27
32.2
34.7 [32.4-45.5]
7.2 [1.7-19.0]
2 27.7 25.3 22.8 22.3 22.6 PEEP 22
23.1
23.0 [22.6-25.3]
2.5 [1.1-7.7]
3 24.0 21.6 18.3 17.3 17.4 18.1 PEEP 28
19.1
18.3 [17.6-20.9]
4.2 [1.6-6.6]
4 60.2 59.7 50.1 35.1 27.8 25.3 22.5 35.1
[25.9-57.3]
17.7 [15.4-32.1]
5 87.4 84.0 81.2 74.3 65.7 53.1 77.8
[65.7-84.0]
15.7 [9.2-19.8]
6 27.1 25.5 22.8 21.6 21.8 23.4 23.1
[21.8-25.5]
2.7 [2.2-4.2]
7 47.7 42.5 45.5 55.7 PEEP 16
55.3
47.7 [44.8-55.4]
6.2 [5.0-7.7]
8 41.7 35.5 31.2 28.7 27.5 26.6 27.0 28.7
[27.2-34.4]
2.9 [1.3-8.7]
9 51.3 39.1 38.2 31.1 28.2 26.2 26.1 29.7
[26.2-38.7]
3.1 [1.0-10.8]
10 51.0 44.1 39.2 35.8 33.9 34.0 PEEP 27
34.2 35.8 [34.1-42.9] 2.0 [1.0-5.6] Median [IQR] 49.4 [27.7-53.8] 40.8 [25.5-47.0] 38.7 [22.8-45.5] 31.9 [22.3-35.5] 28.0* [22.6-33.9] 26.2* [23.3-32.6] 26.6* [22.5-32.2] 32.2 [25.0-45.9] 5.6 [1.8-11.3]
Eg. PEEP 16 is included in PEEP 20 Median [IQR]
Edrs provides a better model fit across all patients and also provides a clearer insight
into the patient’s physiological condition, and is thus the better model-based metric. Figures 1 and Figure 2 showsEdrs-Pressure-PEEP curves and EdrsArea decrease with
increasing PEEP, lung pressure, and volume over each breath. In the beginning of the recruitment manoeuvre, at zero end-expiratory pressure (ZEEP), Edrs is relatively very
high for all patients with median 51.9cmH2O/l[IQR: 30.8-63.1]. In particular, chronic
obstructive pulmonary disease (COPD) patients or patients with similar clinical fea-tures [27] (Patients 1, 4, 5, 9 and 10) have initially the highest Edrsmedian, as expected,
from 63.1cmH2O/l[IQR: 57.2-81.3] versus 30.8cmH2O/l[IQR: 29.5-46.6] for the other
patients (p = 0.0079). As PEEP rises, it is observed that Edrscurves drop at
patient-spe-cific rates. High constant lung elastance, Elung at ZEEP and decreasing elastance as
PEEP increments are also observed in Figure 3 for Patient 10.
In all cases, patient-specific Edrs andElungdecrease to a patient-specific minimum
before increasing at higher PEEP. Minimum Edrsand Elungsuggest the point where the
lung is most compliant, if ventilated at that PEEP level. Further increases in PEEP and pressure thus lead to increased Elung or Edrs, and thus increase detrimental effects. In
particular, increases in Elung or Edrs can be associated with overstretching of the
patient’s lung [16,28]. However, the heterogeneity of ALI/ARDS means there is a possi-bility of overstretching of healthy lung units even at low PEEP and airway pressures [10]. Thus, Minimum or, perhaps preferably, Inflection Edrsand Elungcan provide a
potentially higher resolution metric.
Table 4 Patient-specificEdrsArea at different PEEP.
Patient EdrsArea(mH2Os/l) EdrsArea
(cmH2Os/l)
Median [IQR]
PEEP (cmH2O)
0 5 10 15 20 25 30
1 84.6 49.5 37.1 28.9 26.6 25.7 PEEP 27
25.7
28.9 [25.9-46.4]
2 34.0 24.8 21.0 20.2 20.3 PEEP 22
20.7
20.9 [20.3-24.8]
3 37.7 27.6 22.2 20.8 19.1 19.7 PEEP 28
18.9
20.8 [19.3-26.3]
4 102.2 91.2 61.7 37.9 31.7 48.1 47.5 48.1
[40.3-83.8]
5 118.7 99.9 89.1 70.6 75.7 42.9 82.4
[70.6-99.9]
6 29.4 23.8 20.8 21.6 19.5 20.8 21.2
[20.8-23.8]
7 37.6 33.8 31.3 37.9 PEEP 16
32.1
33.8 [31.9-37.7]
8 55.1 38.5 32.0 29.0 27.5 24.1 24.3 29.0
[25.1-36.9]
9 106.5 55.2 51.3 38.3 34.1 31.6 31.3 38.4
[32.2-54.2]
10 74.7 52.6 44.0 39.5 37.3 37.2 PEEP 27
37.3
39.5 [37.3-50.5]
Median [IQR]
64.9 [37.6-102.2]
44.0
[27.6-55.2]
34.6
[22.2-51.3]
33.5
[21.6-38.4]
29.6* [20.3-34.1]
25.7* [20.8-38.6]
28.5* [24.3-37.3]
34.0 [24.7-48.5]
*Values presented include value from different PEEP. Eg. PEEP 16 is included in PEEP 20 Median [IQR] Chiewet al.BioMedical Engineering OnLine2011,10:111
http://www.biomedical-engineering-online.com/content/10/1/111
Patients 2 and 6 (Figure 1, 2, 3: Top panels) are examples where patient-specificEdrs,
Edrs Area and Elung increase after descending to a minimum. Results suggest that
further increases of PEEP and inflation pressures will stretch lung units causing possi-ble damage, as seen by increasing Edrsat higher PEEP. The rise ofEdrs occurs at
rela-tively low PEEP and pressure 15-20cmH2Oin these two patients.
In contrast, Patients 8 and 10 (Figure 1, 2, 3: Bottom panels) never see Edrsor Elung
rising even at the maximum PEEP used in this study. However, theEdrsrange at higher
PEEP for Patients 8 and 10 (PEEP 15~30cmH2O) is relatively small with medianEdrs=
31.3cmH2O/l, [IQR = 27.2-33.9]. This outcome indicates that further increases of PEEP
from 15 to 30cmH2Ohas no added advantage in reducingEdrs, suggesting PEEP
selec-tion should be made at using the Inflecselec-tion method.
Table 2 shows median [IQR]Edrsfor every patient and PEEP. The IQR range drops
significantly for every patient as PEEP increases. This range also indicates lung status or condition with the influence of pressure. A small IQR range indicates that the lung is ventilated at a PEEP level where maximal lung recruitment occurs over a narrow
pressure range as tidal volume, Vtis fixed in the MV mode used. A high IQR range
Figure 1Dynamic lung elastance (Edrs)-Pressure-PEEP plot. Top Left Panel: Patient 2, Top Right Panel:
shows the opposite. Hence, the lengths along pressure in Figure 1 also indicate how readily the patient was recruited and that easiest recruitment occurs at minimum Edrs
[29].
Table 4 shows the patient-specific EdrsArea at each PEEP. It is found that EdrsArea
is closely related to median Edrs, as shown in Figure 4. Edrs Area at lower PEEP with
median 64.9 cmH2Os/l [IQR: 37.6-102.2] is observed and as PEEP increases, EdrsArea
decreases. Upon reaching minimum Edrs Area, patient-specificEdrs Area increase with
PEEP (Patients 2, 4, 6, 7 and 10). This trend is similar to the trend observed in patient-specific dynamic Edrs(Table 2) and constantElung(Table 3). Optimal PEEP
derived using minimum or inflection method in Edrs Area is similar to minimum
patient-specific Edrsbut different asEdrs Area considers the whole inspiration and the
effect of WOBE. It is also found that EdrsArea is closely correlated to work in
over-coming the lung elastic properties (WOBE). This means thatEdrs Area provides
com-bined information of patients-specific lung physiological conditions as well as work of breathing.
Figure 2EdrsArea-PEEP plot. Top Left Panel: Patient 2, Top Right Panel: Patient 6. Bottom Left Panel:
Patient 8, Bottom Right Panel: Patient 10. Severe COPD or patients with similar clinical features (e.g. Patient 10) showed significantly higherEdrsArea compared to other patients. PEEP selection is based on minimum
Edrs-Area and the inflection method with PEEP increase. Chiewet al.BioMedical Engineering OnLine2011,10:111
http://www.biomedical-engineering-online.com/content/10/1/111
Table 5 shows the model-based approaches to PEEP selection compared to clinically
selected PEEP. For 9 of 10 patients, the PEEP value selected using Minimum Edrs and
EdrsArea results in a value higher than the clinically selected PEEP. This latter result
suggests that these patients could be treated at PEEP levels higher than clinically
selected PEEP. When MinimumEdrsorEdrsArea metrics are compared with Minimum
Elung[16], they result in selecting similar PEEP. However, selecting PEEP is a trade off
in minimizing lung pressure and potential damage, versus maximizing recruitment. Hence, the Inflection method offers similar recruitment at a lower PEEP and may be a safer choice, although its selected values are still higher than clinically selected in 7 of 10 cases. Overall, these results reflect the heterogeneity of the ALI/ARDS lung and the need for patient-specific approaches to select PEEP.
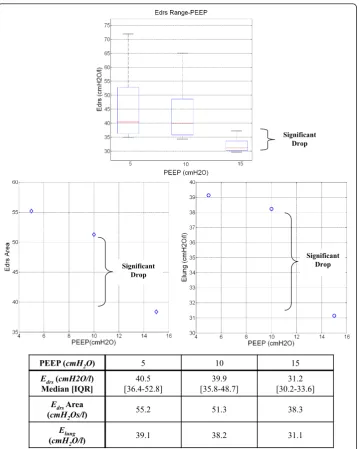
Patient 9 is an interesting case which illustrates the model’s potential to capture unique patient-specific lung recruitment and condition as it occurs in a clinically and physiologically relevant manner. When the patient is ventilated from PEEP of 5 to
10cmH2O, medianEdrsonly decreases by less than 1.0cmH2O/l. However, when PEEP
is increased to 15cmH2O, the medianEdrsdrops significantly, as shown in Figure 5.
This smallerEdrsdrop suggests that only minimal lung volume is recruited from PEEP Figure 3Elung-PEEP plot. Top Left Panel: Patient 2, Top Right Panel: Patient 6. Bottom Left Panel: Patient
of 5 to 10cmH2O. The significant drop inEdrsat PEEP 15cmH2Oindicates that PEEP
15 cmH2Ohas overcome recruitment resistance and additional new lung volume is
recruited. Patient 9 was diagnosed with H1N1 and high PEEP for lung recruitment has proven to be beneficial for these patients [30]. Similar trends can be observed in Figure 5 bottom panels with theEdrsArea-PEEP plot andElung-PEEP-plot.
Figure 4Pearson’s Correlation. Top Left Panel:Elung-MedianEdrs, R = 0.987. Top Right Panel:Elung-WOBE, R = 0.815. Bottom Left Panel:EdrsArea-MedianEdrs, R = 0.896. Bottom Right Panel:EdrsArea-WOBE, R = 0.936.
Table 5 PEEP (cmH2O) selection in clinical and model-based approach.
Patients
Selection Methods 1 2 3 4 5 6 7 8 9 10
Clinical 10 12 10 10 12 11 7.5 12 10 10
MinimumEdrs 20 15 15 25 25 15 5 20 15 20
MinimumEdrsArea 25 15 20 20 25 20 10 25 25 20
Inflection EdrsArea
14~16 6~9 15~17 16~18 22~24 7.5~12 5~7.5 21~23 20~23 12~16
MinimumElung 25 15 15 30 25 15 5 25 30 20
Inflection Elung
13~17 6~9 8~10 26~27 21~24 7.5~10 5 12~18 19~22 12 ~15
Chiewet al.BioMedical Engineering OnLine2011,10:111 http://www.biomedical-engineering-online.com/content/10/1/111
4.2 Limitations
In this research, the lung model used to identify patient-specificEdrscomprised a
sin-gle compartment lung model. It was initially proposed for simple computational analy-sis and neglects the effect of nonlinear flow [31]. However, this analyanaly-sis is based predominantly on trend comparisons, where the patient is their own reference. In addition, the model is simple and capable of capturing the fundamental lung mechanics, which varies intra- and inter- patients. Hence, this limitation should be minimal in this case, but should be confirmed with direct prospective clinical studies.
Significant Drop
PEEP (cmH2O) 5 10 15
Edrs (cmH2O/l) Median [IQR]
40.5 [36.4-52.8]
39.9 [35.8-48.7]
31.2 [30.2-33.6]
Edrs Area
(cmH2Os/l) 55.2 51.3 38.3
Elung
(cmH2O/l) 39.1 38.2 31.1
Significant Drop
Significant Drop
Figure 5Patient 9Edrs,EdrsArea andElungchange with PEEP. Top Panel: Box-and-whisker diagram for
During the clinical trials, the patients were sedated and paralyzed using muscle relax-ants. It is assumed that after sedation, the patient will be fully dependant on mechani-cal ventilation and not have spontaneous breathing effort. This assumption thus assumes the patient’s pleural pressure (Ppl) after sedation is zero and allows Ppl in
Equation (3) to be omitted, which may not be entirely valid [32]. However, this assumption is made for the first step study to prove the concept within a simpler situa-tion. Otherwise, the terms ElungandEdrswould represent a respiratory system elastance
[31] and time-variant dynamic respiratory system elastance. However, given the low fit-ting errors observed, this issue should have little impact in this research.
During the course of estimating patient-specific ElungorEdrs, respiratory system
resis-tance, R, is assumed overall constant within a physiological range [33] as PEEP
increases. This assumption may not be entirely valid in some cases [33,34]. However, continuous measurements of respiratory resistance are not typically available and the effect of this resistive term is limited mathematically in its impact. Equally, trend com-parison, as used here, across PEEP values will reduce the impact.
The identification of Elung,EdrsandEdrsArea during MV is presented as a method to
select PEEP, but there is currently no conclusive, optimum overall Edrsor EdrsArea in
patients.Edrs range varies depending on patient disease state and thus will also change
over time. However, this trial includes only 10 patients, and there is not yet enough clinical data to indicate an optimumElung,Edrsor EdrsArea value for a specific patient
or group. On-going, prospective trials with more specific patient groups should develop more conclusive outcomes, relating specific set values of Edrsmetrics to
effec-tive patient-specific treatments and clinical outcome.
In particular, the time-varyingEdrsvalue and its change over a given breathing cycle,
provides additional insight to guide ventilation that is not investigated here. For exam-ple, changes in ventilator pattern or mode to modify the Edrstrajectory could also be
used with this data to guide therapy choice. However, this study does not have the numbers or design to provide that advice, or specificEdrsvalues associated with
speci-fic decrease state or lung damage.
5 Conclusions
The model-based approach presented provides patient-specific, physiological insight not directly measurable without additional invasive, disruptive and clinically intensive test manoeuvres. This method can be directly implemented using modern ventilators with minimal, limited PEEP titrations, and thus without significant interruption to ongoing therapy. In particular, the full manoeuvres used here would not be required
for clinical use, and only modest PEEP changes (3-8cmH2O) would be required to
determine if Edrswas decreasing at a different PEEP. Edrsoffers higher resolution in
patients’response to change of pressure and PEEP, which is potentially, a better metric compared to existing constant lung elastance estimation. Thus, the overall method is readily generalisable and clinical practicable. It is able to capture patient-specific condi-tion and responsiveness to PEEP and recruitment accurately, and as clinically expected. Hence, the approach presented offers significant potential to improve clinical insight and delivery of mechanical ventilation, and should be prospectively tested.
Chiewet al.BioMedical Engineering OnLine2011,10:111 http://www.biomedical-engineering-online.com/content/10/1/111
6 List of Abbreviations
ALI: Acute lung injury; APE: Absolute percentage error; ARDS: Acute respiratory dis-tress syndrome; COPD: Chronic Obstructive Pulmonary Disease; Elung: Patient-specific
constant lung elastance; Edrs: Patient-specific dynamic lung elastance;FiO2: Fraction of
Inspired Oxygen; ICU: Intensive care unit; IQR: Interquartile Range; MV: Mechanical ventilation; PaO2: Partial pressure of oxygen in arterial blood;Paw: Airway pressure;
Ppl:Pleural pressure;Ptp: Transpulmonary pressure; PEEP: Positive end expiratory
pres-sure; PF Ratio: PaO2/FiO2;P0: Offset pressure; Q: Flow; RM: Recruitment manoeuvre;
Rlung: Resistance; SIMV: Synchronized intermittent mandatory ventilation;t: Time;V:
Volume; VILI: Ventilation induced lung injury; Vt: Tidal volume; WOB: Work of
Breathing; WOBE: Work to overcome respiratory system elastance;WOBR: Work to
overcome airway resistance; ZEEP: Zero PEEP
7 Competing Interests
The authors declare that they have no competing interests.
8 Authors Contribution
YSC, JGC, GMS created and defined the model. YSC, JGC and TD had input to analy-sis of results. GMS, AS implemented trials clinically with input from all others. All authors had input in writing and revising the manuscript. All authors have read and approved the final manuscript.
9 Consent
Written informed consent was obtained from the participant and or relative/friends/ family of this study. A copy of written consent is available for review by the Editor-in-Chief of this journal.
Author details
1Department of Mechanical Engineering, University of Canterbury, New Zealand.2Department of Intensive Care,
Christchurch Hospital, New Zealand.3Thermodynamics of Irreversible Processes, Institute of Physics, University of Liège, Belgium.
Received: 7 November 2011 Accepted: 23 December 2011 Published: 23 December 2011
References
1. Ashbaugh D, Boyd Bigelow D, Petty T, Levine B:ACUTE RESPIRATORY DISTRESS IN ADULTS.The Lancet1967, 290:319-323.
2. Bernard GR, Artigas A, Brigham KL, Carlet J, Falke K, Hudson L, Lamy M, LeGall JR, Morris A, Spragg R:Report of the American-European consensus conference on ARDS: Definitions, mechanisms, relevant outcomes and clinical trial coordination.Intensive Care Medicine1994,20:225-232.
3. Phua J, Badia JR, Adhikari NKJ, Friedrich JO, Fowler RA, Singh JM, Scales DC, Stather DR, Li A, Jones A,et al:Has Mortality from Acute Respiratory Distress Syndrome Decreased over Time?: A Systematic Review.Am J Respir Crit Care Med2009,179:220-227.
4. Dasta JF, McLaughlin TP, Mody SH, Piech CT:Daily cost of an intensive care unit day: The contribution of mechanical ventilation *.Critical Care Medicine2005,33:1266-1271, 1210.1097/1201.
CCM.0000164543.0000114619.0000164500.
5. Girard TD, Bernard GR:Mechanical Ventilation in ARDS.Chest2007,131:921-929.
6. Esteban A, Anzueto A, Frutos F, Alia I, Brochard L, Stewart T, Benito S, Epstein S, Apezteguia S, Nightingale P,et al: Characteristics and outcomes in adult patients receiving mechanical ventilation: a 28-day international study.
Jama2002,287:345-355.
7. Mireles-Cabodevila E, Diaz-Guzman E, Heresi GA, Chatburn RL:Alternative modes of mechanical ventilation: A review for the hospitalist.Cleveland Clinic Journal of Medicine2009,76:417-430.
8. Gattinoni L, Carlesso E, Brazzi L, Caironi P:Positive end-expiratory pressure.Current Opinion in Critical Care2010, 16:39-44.
11. Esteban A, Cook DJ, Anzueto A, Gattinoni L, Chiumello D, Vagginelli F:Management of Patients with Respiratory Failure: An Evidence-based Approach.InEvidence-Based Management of Patients with Respiratory Failure.Edited by: Vincent J-L. Springer Berlin Heidelberg; 2005:21-27, Update in Intensive Care Medicine.
12. Sundaresan A, Chase JG:Positive end expiratory pressure in patients with acute respiratory distress syndrome - The past, present and future.Biomedical Signal Processing and Control2011, Corrected Proof.
13. Chase JG, Le Compte A, Preiser J-C, Shaw G, Penning S, Desaive T:Physiological modeling, tight glycemic control, and the ICU clinician: what are models and how can they affect practice?Annals of Intensive Care2011,1:11. 14. MacIntyre NR:Is There a Best Way to Set Positive Expiratory-End Pressure for Mechanical Ventilatory Support in
Acute Lung Injury?Clinics in chest medicine2008,29:233-239.
15. Quaglini S, Barahona P, Andreassen S, Rees S, Allerød C, Kjærgaard S, Toft E, Thorgaard P:Diagnosing Patient State in Intensive Care Patients Using the Intelligent Ventilator (INVENT) System.InArtificial Intelligence in Medicine. Volume 2101.Springer Berlin/Heidelberg; 2001:131-135, Lecture Notes in Computer Science.
16. Carvalho A, Jandre F, Pino A, Bozza F, Salluh J, Rodrigues R, Ascoli F, Giannella-Neto A:Positive end-expiratory pressure at minimal respiratory elastance represents the best compromise between mechanical stress and lung aeration in oleic acid induced lung injury.Critical Care2007,11:R86.
17. Sundaresan A, Chase JG, Shaw G, Chiew Y-S, Desaive T:Model-Based Optimal PEEP in Mechanically Ventilated ARDS Patients in the Intensive Care Unit.BioMedical Engineering OnLine2011,10:64.
18. Suarez-Sipmann F, Bohm SH, Tusman G, Pesch T, Thamm O, Reissmann H, Reske A, Magnusson A, Hedenstierna G:Use of dynamic compliance for open lung positive end-expiratory pressure titration in an experimental study.Crit Care Med2006.
19. Gattinoni L, Caironi P, Cressoni M, Chiumello D, Ranieri VM, Quintel M, Russo S, Patroniti N, Cornejo R, Bugedo G:Lung Recruitment in Patients with the Acute Respiratory Distress Syndrome.N Engl J Med2006,354:1775-1786. 20. Sundaresan A, Yuta T, Hann CE, Geoffrey Chase J, Shaw GM:A minimal model of lung mechanics and model-based
markers for optimizing ventilator treatment in ARDS patients.Computer Methods and Programs in Biomedicine2009, 95:166-180.
21. Hann CE, Chase JG, Lin J, Lotz T, Doran CV, Shaw GM:Integral-based parameter identification for long-term dynamic verification of a glucose-insulin system model.Computer Methods and Programs in Biomedicine2005,77:259-270. 22. Vieira SR, Puybasset L, Richecoeur J, Lu Q, Cluzel P, Gusman PB, Coriat P, Rouby JJ:A lung computed tomographic
assessment of positive end-expiratory pressure-induced lung overdistension.Am J Respir Crit Care Med1998, 158:1571-1577.
23. Carvalho A, Spieth P, Pelosi P, Vidal Melo M, Koch T, Jandre F, Giannella-Neto A, de Abreu M:Ability of dynamic airway pressure curve profile and elastance for positive end-expiratory pressure titration.Intensive Care Medicine
2008,34:2291-2299.
24. Otis AB, Fenn WO, Rahn H:Mechanics of Breathing in Man.Journal of Applied Physiology1950,2:592-607.
25. Marini JJ, Capps JS, Culver BH:The inspiratory work of breathing during assisted mechanical ventilation.Chest1985, 87:612-618.
26. Mercat A, Richard J-CM, Vielle B, Jaber S, Osman D, Diehl J-L, Lefrant J-Y, Prat G, Richecoeur J, Nieszkowska A,et al: Positive End-Expiratory Pressure Setting in Adults With Acute Lung Injury and Acute Respiratory Distress Syndrome: A Randomized Controlled Trial.JAMA2008,299:646-655.
27. Hoare Z, Lim WS:Pneumonia: update on diagnosis and management.BMJ2006,332:1077-1079.
28. Carvalho A, Jandre F, Pino A, Bozza F, Salluh J, Rodrigues R, Soares J, Giannella-Neto A:Effects of descending positive end-expiratory pressure on lung mechanics and aeration in healthy anaesthetized piglets.Critical Care2006,10: R122.
29. Amato MBP, Barbas CSV, Medeiros DM, Magaldi RB, Schettino GP, Lorenzi-Filho G, Kairalla RA, Deheinzelin D, Munoz C, Oliveira R,et al:Effect of a Protective-Ventilation Strategy on Mortality in the Acute Respiratory Distress Syndrome.
N Engl J Med1998,338:347-354.
30. Ramsey CD, Funk D, Miller RRI, Kumar A:Ventilator management for hypoxemic respiratory failure attributable to H1N1 novel swine origin influenza virus.Critical Care Medicine2010,38:e58-e65.
31. Bates JHT:Lung Mechanics: An Inverse Modeling ApproachCambridge University Press; 2009.
32. Fernandes CR:A importância da pressão pleural na avaliação da mecânica respiratória.Revista Brasileira de Anestesiologia2006,56:287-303.
33. Mols G, Kessler V, Benzing A, Lichtwarck-Aschoff M, Geiger K, Guttmann J:Is pulmonary resistance constant, within the range of tidal volume ventilation, in patients with ARDS?British Journal of Anaesthesia2001,86:176-182. 34. Guérin C, Fournier G, Milic-Emili J:Effects of PEEP on inspiratory resistance in mechanically ventilated COPD
patients.European Respiratory Journal2001,18:491-498.
doi:10.1186/1475-925X-10-111
Cite this article as:Chiewet al.:Model-based PEEP optimisation in mechanical ventilation.BioMedical Engineering OnLine201110:111.
Chiewet al.BioMedical Engineering OnLine2011,10:111 http://www.biomedical-engineering-online.com/content/10/1/111