S
Spprriinngg22001199,,VVooll88,,NNoo22 D
DOOII::1100..2222008888//IIJJMMCCMM..BBUUMMSS..88..22..110033
Analysis of Differential Expression of microRNAs and Their
Target Genes in Prostate Cancer: A Bioinformatics Study on
Microarray Gene Expression Data
Maryam Khorasani1, Shirin Shahbazi2, Nazanin Hosseinkhan3, Reza Mahdian1
1. Molecular Medicine Department, Pasteur Institute of Iran, Tehran, Iran.
2. Department of Medical Genetics, Faculty of Medical Sciences, Tarbiat Modares University, Tehran, Iran.
3. Endocrine Research Center, Institute of Endocrinology and Metabolism, Iran University of Medical Sciences,
Tehran, Iran.
Early diagnosis of prostate cancer (PCa) as the second most common cancer in men is not associated with precise and specific results. Thus, alternate methods with high specificity and sensitivity are needed for accurate and timely detection of PCa. MicroRNAs regulate the molecular pathways involved in cancer by targeting multiple genes. The aberrant expression of the microRNAs has been reported in different cancer types including PCa. In this bioinformatics study, we studied differential expression profiles of microRNAs and their target genes in four PCa gene expression omnibus (GEO) databases. PCa diagnostic biomarker candidates were investigated using bioinformatics tools for analysis of gene expression data, microRNA target prediction, pathway and GO annotation, as well as ROC curves. The results of this study revealed significant changes in the expression of 14 microRNAs and 40 relevant target genes, which ultimately composed four combination panels (miR- 375+96+663/ miR- 133b+143- 3p + 205/ C2ORF72 + ENTPD5 + GLYAT11/LAMB3 + NTNG2+TSLP) as candidate biomarkers capable to distinguish between PCa tumor samples and normal prostate tissue samples. These biomarkers may be suggested for a more accurate early diagnosis of PCa patients along with current diagnostic tests.
Key words: Prostate cancer, differential expression, microRNA, gene, biomarker, bioinformatics
Corresponding author: Molecular Medicine Department, Pasteur Institute of Iran, Tehran, Iran E-mail: [email protected]
ancer is a complex disease with unknown precise cause, and is considered as a health problem worldwide (1, 2). Prostate cancer (PCa) or prostate adenocarcinoma (PRAD) is a common malignancy in men which displays clinical heterogeneous manifestations ranging from latent to aggressive form (3). Available screening tests for
PCa including prostate specific antigen (PSA) and digital rectal exam (DRE) have shown low specificity and sensitivity. Thus, alternative tests with higher accuracy are needed for timely diagnosis of PCa (4). Also, because end- stage PCa is resistant to available cancer treatments, novel small molecules either as diagnostic biomarkers or
C
Submmited 14 May 2019; Accepted 26 October 2019; Published 29 October 2019
therapeutic targets are widely desired (4, 5). PCa displays heterogeneous genetic variations and gene expression profiles. Several molecular signaling pathways including androgen receptor (AR), Wnt and PI3 kinase contribute to the pathogenesis of the disease (6, 7). Dysregulated expression of the key genes in these signaling pathways has been reported in PCa (8). MicroRNAs (miRNAs, miRs) comprise a group of endogenous small non-coding RNAs (ncRNAs) that play a regulatory role in the post-transcriptional level in multiple biological processes such as cell cycle, apoptosis, and angiogenesis (9). Moreover, their regulatory effects have been reported in the molecular signaling pathways involved in the pathogenesis of PCa (10, 11). Given the changes in the expression profile of microRNAs in the clinical samples of patients with cancer compared to normal individuals, it has been posited that the molecular signature of the expression profile of microRNAs can conduce to the diagnosis or determining the prognosis of cancer (12). A bunch of microRNAs (oncomiRs) with effects on tumor suppressor genes have been reported to be up regulated in cancer. Another microRNAs group known as tumor suppository with regulatory effects on oncogenes show decreased expression in cancerous tissues (13). By binding to the 3 UTR region of target mRNAs, microRNAs regulate the expression of their target genes through degrading or inhibiting the translation of the target mRNA (14). Since the discovery of microRNAs, there have been numerous on-line web resources that provide experimental data on microRNAs studies such as sequencing, expression variations in a variety of cancers and KEGG biological pathways. Computational study in addition to omics analysis can be useful for investigating novel diagnostic or prognostic biomarkers or drug targets. Extensive bioinformatics resources are also available for assessment of microRNAs and their target genes. These websites use computational methods and
multiple algorithms for the prediction of microRNAs effects on biological processes (15). Investigating microRNAs/mRNAs in cancers can help better fathom the factors and signaling pathways involved in the pathogenesis of cancers, and introduce new candidate molecules for therapeutic purposes (16). Recently, several studies have been carried out to examine the differential expression of protein coding genes and microRNAs using bioinformatics methods in various cancers (17-20). In a bioinformatics study, Cao et al. reported a five-gene panel as potential diagnostic biomarkers and therapeutic targets in gastric cancer (18). In another study, Hu et al. introduced miR-17 as a diagnostic biomarker in gastric cancer using open access databases and bioinformatics tools (21). Considering the need for accurate and timely diagnostic biomarkers for PCa as well as the possibility of merging the results of several bioinformatics studies, we investigated the differential expression profiles of microRNAs and their target genes through available microarray databases.
Material and methods
Microarray data collection
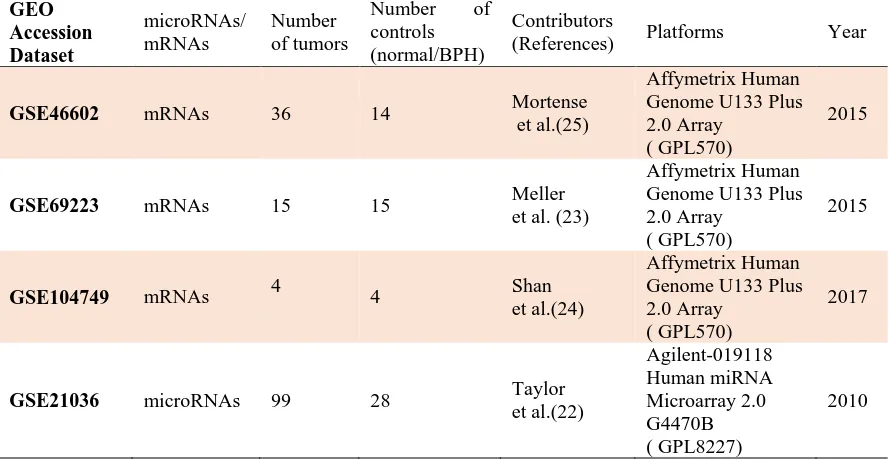
In this study, the microRNA expression dataset, GSE21036 (22) )99 primary tumors, 14 metastases, 28 normal tissues and 1 cancer cell line ( and three mRNA expression datasets GSE69223 (23) (30 match malignant and non- malignant prostate tissue), GSE104749 (24) (8 prostate tissue specimens) and GSE46602 (25) (50 prostate tissue samples) were used from the gene expression omnibus (GEO) database (https: //www. ncbi. nlm.nih. gov/gds/). Data for metastatic samples and cell line were excluded from GSE21036 so that only PCa patients’ samples and their relevant normal samples were used for further analysis. More details of the datasets used in the present study are shown in Table 1.
Microarray data pre-processing and evaluation
of differential expression microRNAs/ genes
Differential expression analysis of microRNA (DEM)/gene (DEG) on tumor and control samples was performed using Limma package in R 3.5.0 statistical program.
Since four different microarray datasets were used in this analysis, we employed the ComBat function in SVA (surrogate variable analysis) package to remove batch effects (early merging) (26). Statistically, significant expression changes were selected by applying adj p values (Benjamini – Hochberg method) (27) of less than 0.05, and |log2FC|≥1. The gene targets of deregulated
microRNAs were searched in the predicted target module-miRwalk 2.0 databases [24]. Intersection of miRWalk 2.0 candidate target genes and deregulated microRNAs were considered for further analysis. Visualization of DEM/DEG of the samples was performed with heat map plots based on average linkage clustering method and Euclidean distance method on heatmapper web server (http:// www.heatmapper.ca/) (28).
Annotation of the functional and pathway
analysis of microRNAs /mRNAs
DIANA TOOLS- miRpath v.3 (http://snf-515788.vm.okeanos.grnet.gr/) was used for Kyoto encyclopedia of genes and genomes (KEGG) molecular pathway and gene ontology (GO) analysis of deregulated microRNAs (29). For the functional classification of the gene targets of dysregulated microRNAs, we used PANTHER (protein analysis through evolutionary relationships) classification system tools /gene list analysis (http://www.pantherdb.org/) (30).
Receiver operating characteristic (ROC) curve
analysis
To assess the predictive value of the deregulated microRNAs and applicable target genes for distinguishing between tumor and non-tumor samples, expression fold-change data were utilized in receiver operating characteristic (ROC) curve analysis by MedCalc software (variant 12.1.4.0). A logistic regression model was specified for a combined evaluation of the microRNAs and their predicted target genes (31). For this purpose,
Table 1. Datasets used to investigating of differential expression genes and microRNAs.
GEO Accession Dataset microRNAs/ mRNAs Number of tumors
Number of controls (normal/BPH)
Contributors
(References) Platforms Year
GSE46602 mRNAs 36 14 Mortense et al.(25)
Affymetrix Human Genome U133 Plus 2.0 Array
( GPL570)
2015
GSE69223 mRNAs 15 15 Meller
et al. (23)
Affymetrix Human Genome U133 Plus 2.0 Array
( GPL570)
2015
GSE104749 mRNAs 4 4 Shan
et al.(24)
Affymetrix Human Genome U133 Plus 2.0 Array
( GPL570)
2017
GSE21036 microRNAs 99 28 Taylor
et al.(22) Agilent-019118 Human miRNA Microarray 2.0 G4470B ( GPL8227) 2010
modified variables were constructed via the coefficient of logistic model; these variables were finally conducted in the construction of ROC curves. Area under curve (AUC), sensitivity, and specificity parameters were used to compare the predictive values of microRNAs and their target genes.
Results
DEM and DEG determination
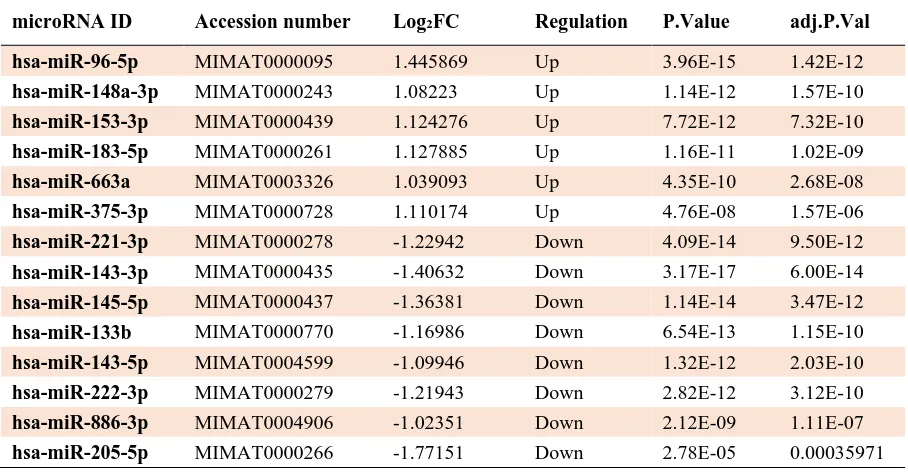
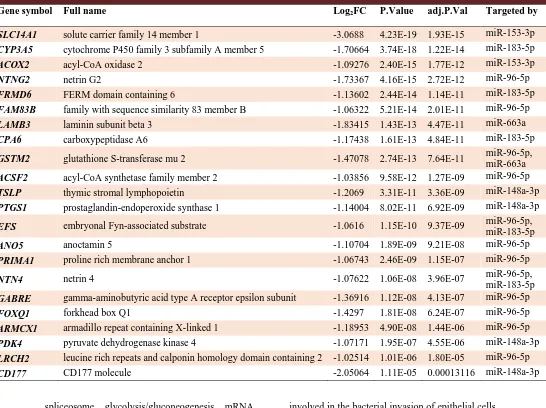
Overall, DEM analysis of 127 tumor samples compared to relevant normal groups by R program showed significantly deregulated expression of 14 microRNAs. Our results revealed increased expression levels for 96-5p, miR-148a-3p, miR-153-3p, miR-183-5p, hsa-miR-663a, hsa-miR-375-3p, and decreased expression levels for 221-3p, 143-3p, 145-5p, 133b, hsa-miR-143-5p, hsa-miR-222-3p, hsa- miR-886-3p, and hsa-miR-205-5p (Table 2). The miRWalk algorithm predicted 2957 putative target genes for the upregulated microRNAs, among them 22 genes were shared with the results of the R analysis
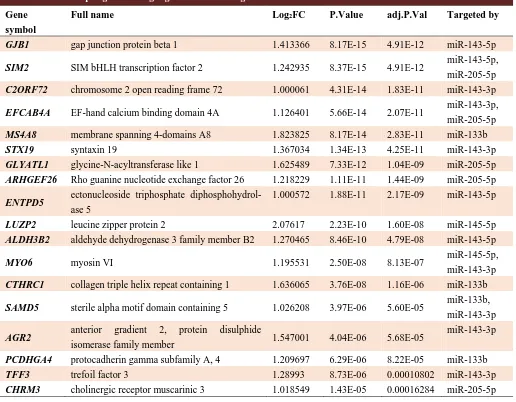
(Table 3). Also, for downregulated microRNAs, miRWalk algorithm determined 4241 putative target genes of which 18 genes were also shared with the R analysis results (Table 4). The results for clustering of the upregulated microRNAs identified two distinct groups. One cluster contained miR-148a and miR-375, which have a significant regulatory role in endocytosis and central carbon metabolism in cancer. Also, the other cluster contained 96, 663, 153, and miR-183 that regulate the pathways of the Hippo signaling, adherence junction, prostate cancer, transcriptional dysregulation in cancer, regulation of actin cytoskeleton, and ECM receptor interaction. The clustering of downregulated microRNAs showed three distinct groups; a cluster containing miR-145, which plays a role in the pathways of proteoglycans in cancer, adherence junction, focal adhesion, pathways in cancer, signaling pathways regulating pluripotency of stem cells, transcriptional dysregulation in cancer, and TGF-beta signaling pathway. The other cluster contained miR-222, miR-886, and miR-143-5p which regulate cell adhesion molecules (CAMs),
Table 2. Differential expression miRNAs from R analysis results for tumor samples compared with normal samples.
microRNA ID Accession number Log2FC Regulation P.Value adj.P.Val
hsa-miR-96-5p MIMAT0000095 1.445869 Up 3.96E-15 1.42E-12
hsa-miR-148a-3p MIMAT0000243 1.08223 Up 1.14E-12 1.57E-10
hsa-miR-153-3p MIMAT0000439 1.124276 Up 7.72E-12 7.32E-10
hsa-miR-183-5p MIMAT0000261 1.127885 Up 1.16E-11 1.02E-09
hsa-miR-663a MIMAT0003326 1.039093 Up 4.35E-10 2.68E-08
hsa-miR-375-3p MIMAT0000728 1.110174 Up 4.76E-08 1.57E-06
hsa-miR-221-3p MIMAT0000278 -1.22942 Down 4.09E-14 9.50E-12
hsa-miR-143-3p MIMAT0000435 -1.40632 Down 3.17E-17 6.00E-14
hsa-miR-145-5p MIMAT0000437 -1.36381 Down 1.14E-14 3.47E-12
hsa-miR-133b MIMAT0000770 -1.16986 Down 6.54E-13 1.15E-10
hsa-miR-143-5p MIMAT0004599 -1.09946 Down 1.32E-12 2.03E-10
hsa-miR-222-3p MIMAT0000279 -1.21943 Down 2.82E-12 3.12E-10
hsa-miR-886-3p MIMAT0004906 -1.02351 Down 2.12E-09 1.11E-07
hsa-miR-205-5p MIMAT0000266 -1.77151 Down 2.78E-05 0.00035971
Table 3. Selected down regulated target genes for up regulated miRs.
Gene symbol Full name Log2FC P.Value adj.P.Val Targeted by
SLC14A1 solute carrier family 14 member 1 -3.0688 4.23E-19 1.93E-15 miR-153-3p
CYP3A5 cytochrome P450 family 3 subfamily A member 5 -1.70664 3.74E-18 1.22E-14 miR-183-5p
ACOX2 acyl-CoA oxidase 2 -1.09276 2.40E-15 1.77E-12 miR-153-3p
NTNG2 netrin G2 -1.73367 4.16E-15 2.72E-12 miR-96-5p
FRMD6 FERM domain containing 6 -1.13602 2.44E-14 1.14E-11 miR-183-5p
FAM83B family with sequence similarity 83 member B -1.06322 5.21E-14 2.01E-11 miR-96-5p
LAMB3 laminin subunit beta 3 -1.83415 1.43E-13 4.47E-11 miR-663a
CPA6 carboxypeptidase A6 -1.17438 1.61E-13 4.84E-11 miR-183-5p
GSTM2 glutathione S-transferase mu 2 -1.47078 2.74E-13 7.64E-11 miR-96-5p,
miR-663a
ACSF2 acyl-CoA synthetase family member 2 -1.03856 9.58E-12 1.27E-09 miR-96-5p
TSLP thymic stromal lymphopoietin -1.2069 3.31E-11 3.36E-09 miR-148a-3p
PTGS1 prostaglandin-endoperoxide synthase 1 -1.14004 8.02E-11 6.92E-09 miR-148a-3p
EFS embryonal Fyn-associated substrate -1.0616 1.15E-10 9.37E-09 miR-96-5p,
miR-183-5p
ANO5 anoctamin 5 -1.10704 1.89E-09 9.21E-08 miR-96-5p
PRIMA1 proline rich membrane anchor 1 -1.06743 2.46E-09 1.15E-07 miR-96-5p
NTN4 netrin 4 -1.07622 1.06E-08 3.96E-07 miR-96-5p,
miR-183-5p
GABRE gamma-aminobutyric acid type A receptor epsilon subunit -1.36916 1.12E-08 4.13E-07 miR-96-5p
FOXQ1 forkhead box Q1 -1.4297 1.81E-08 6.24E-07 miR-96-5p
ARMCX1 armadillo repeat containing X-linked 1 -1.18953 4.90E-08 1.44E-06 miR-96-5p
PDK4 pyruvate dehydrogenase kinase 4 -1.07171 1.95E-07 4.55E-06 miR-148a-3p
LRCH2 leucine rich repeats and calponin homology domain containing 2 -1.02514 1.01E-06 1.80E-05 miR-96-5p
CD177 CD177 molecule -2.05064 1.11E-05 0.00013116 miR-148a-3p
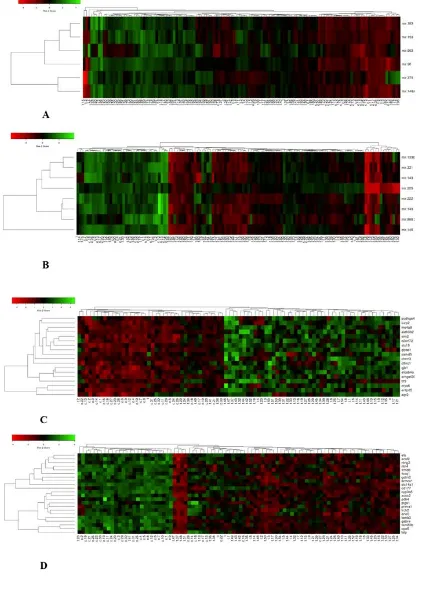
spliceosome, glycolysis/gluconeogenesis, mRNA surveillance pathway, ubiquitin mediated proteolysis, and cell cycle. Finally, another cluster which contained miR-133b, miR-221, miR-205, and miR-143-3p regulates the pathways of fatty acid biosynthesis/ metabolism / elongation, nucleotide excision repair, RNA transport, estrogen signaling pathway, viral carcinogenesis, and cell cycle (Fig. 1A, 1B). Similar pattern was also observed in the DEG clustering heatmap plot. The clustering results of upregulated genes showed three distinct groups; the cluster containing AGR2, ENTPD5, and MYO6 which regulates purine/
pyrimidine metabolism; the cluster containing GJB1, EFCAB4A, TFF3 and ARHGEF26 that is
involved in the bacterial invasion of epithelial cells, and the cluster which contained other remaining genes that contribute to the pathways of glycolysis/gluconeogenesis, the metabolic pathways of the chemical carcinogenesis, calcium signaling pathway, and drug metabolism - cytochrome. Also, the clustering results for downregulated genes showed two distinct groups; a group including FRMD6, GSTM2, NTN4, NTNG2, SLC14A1 which
are involved in the pathways of the Hippo signaling pathway, CAMs, and another group including the genes which play a role in the 0eroxisome proliferator-activated receptors (PPARs) signaling pathway, cytokine-cytokine receptor interaction, JA-STAT signaling pathway, ECM receptor
interaction, PI3K-Akt signaling pathway, focal adhesion, metabolic pathways, platelet activation, primary bile acid biosynthesis, and pathways in cancer (Fig. 1C, 1D).
KEGG pathway and GO annotation for DEM/
DEG
The results of the mirPath v.3 analysis on the upregulated microRNAs revealed that they are involved in steroid biosynthesis, viral carcino-genesis, proteoglycan in cancer, oocyte meiosis, p53 signaling, cell cycle, FoxO signaling, and hepatitis B KEGG molecular pathways. Two microRNAs are also involved in PCa by targeting 22 genes (P-value: 0.000887). The analysis of GO
on the upregulated microRNAs showed their contribution in some cellular compositions (CC) such as nucleoplasm, cytosol, organelle, protein complex, microtubule organizing center, focal adhesion, some molecular functions (MF) such as enzyme binding, ion binding, protein binding transcription factor activity and cytoskeletal protein binding, some biological processes (BP) like cell death, cell cycle, response to stress , immune system process, protein complex assembly, gene expression, epidermal growth factor receptor signaling pathway, and chromatin organization. The assessment of KEGG pathways for the down regulated microRNAs by the mirPath v.3 showed
Table 4. Selected up regulated target genes for down regulated miRs.
Gene symbol
Full name Log2FC P.Value adj.P.Val Targeted by
GJB1 gap junction protein beta 1 1.413366 8.17E-15 4.91E-12 miR-143-5p
SIM2 SIM bHLH transcription factor 2 1.242935 8.37E-15 4.91E-12 miR-143-5p,
miR-205-5p
C2ORF72 chromosome 2 open reading frame 72 1.000061 4.31E-14 1.83E-11 miR-143-3p
EFCAB4A EF-hand calcium binding domain 4A 1.126401 5.66E-14 2.07E-11 miR-143-3p,
miR-205-5p
MS4A8 membrane spanning 4-domains A8 1.823825 8.17E-14 2.83E-11 miR-133b
STX19 syntaxin 19 1.367034 1.34E-13 4.25E-11 miR-143-3p
GLYATL1 glycine-N-acyltransferase like 1 1.625489 7.33E-12 1.04E-09 miR-205-5p
ARHGEF26 Rho guanine nucleotide exchange factor 26 1.218229 1.11E-11 1.44E-09 miR-205-5p
ENTPD5 ectonucleoside triphosphate
diphosphohydrol-ase 5
1.000572 1.88E-11 2.17E-09 miR-143-5p
LUZP2 leucine zipper protein 2 2.07617 2.23E-10 1.60E-08 miR-145-5p
ALDH3B2 aldehyde dehydrogenase 3 family member B2 1.270465 8.46E-10 4.79E-08 miR-143-5p
MYO6 myosin VI 1.195531 2.50E-08 8.13E-07 miR-145-5p,
miR-143-3p
CTHRC1 collagen triple helix repeat containing 1 1.636065 3.76E-08 1.16E-06 miR-133b
SAMD5 sterile alpha motif domain containing 5 1.026208 3.97E-06 5.60E-05 miR-133b,
miR-143-3p
AGR2 anterior gradient 2, protein disulphide
isomerase family member 1.547001 4.04E-06 5.68E-05
miR-143-3p
PCDHGA4 protocadherin gamma subfamily A, 4 1.209697 6.29E-06 8.22E-05 miR-133b
TFF3 trefoil factor 3 1.28993 8.73E-06 0.00010802 miR-143-3p
CHRM3 cholinergic receptor muscarinic 3 1.018549 1.43E-05 0.00016284 miR-205-5p
Fig. 1. The heatmap plots of the deregulated microRNAs in GSE21036 dataset and deregulated genes for integrative analysis of GSE46602, GSE69223, and GSE104749 datasets. A: The heat map plot of the six up regulated microRNAs; B: The heat map of the eight down regulated microRNAs. Each row illustrates the desired microRNAs and each column shows samples; C: The heat map of the up regulated genes; D: The heat map of the down regulated genes. Each row illustrates the desired genes and each column shows samples.
.
that they are linked to some molecular pathways such as p53 signaling pathway, estrogen signaling pathway, viral carcinogenesis, Hippo signaling pathway, and lysine degradation. The pathways in cancer for microRNAs by targeting 36 genes was also reported (P-value: 0.0010524). In addition, GO analysis for evaluation of the downregulated microRNAs revealed that some of them are assigned in intersectional category for CC, MF and BP and are linked to cytosol, protein complex, organelle, enzyme binding, ion binding, biological process, gene expression, and response to stress. Ultimately, the pathway and GO-slim analysis for
either up or down regulated target genes was performed by using PANTHER software. The results of these assessments are shown in Figs. 2 and 3.
DEM and DEG discriminate PCa tumor samples
The expression ratios of significant DEM and DEG in the tumor samples were converted to ROC/AUC data, which determined the specificity and sensitivity of each microRNA/target gene assay for distinguishing tumor samples from control samples. While individual assays were capable of discrimination between tumor and non- tumor samples with acceptable accuracy, four
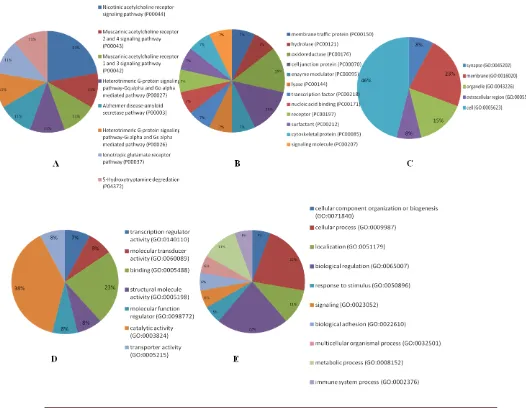
Fig. 2.Pie chart for functional classification of the up regulated genes by the panther. A: pathway analysis; B: protein class; C: cellular components; D: molecular function and E: biological processes based on GO-slim.
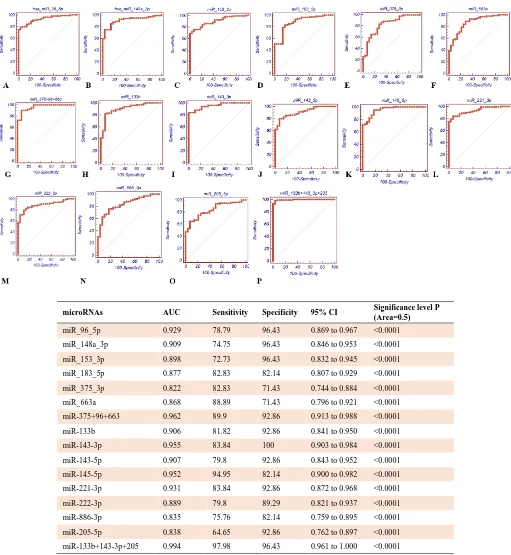
combination panels showed higher AUC, sensitivity and specificity (Figs. 4, 5, and 6). Regarding the upregulated microRNAs, a combination panel [miR-375 + miR-96 + miR-663] with AUC = 0.962, sensitivity = 89.9, specificity = 92.86, and 95% CI: 0.913 to 0.988 showed the best results. Out of the down regulated microRNAs, a combination panel consisted of 133b+ 143-3p+ miR-205 with AUC = 0.994, sensitivity = 97.98, specificity = 96.43, 95% CI: 0.961 to 1.000 had significantly superior accuracy. Also, among
the genes with upregulated expression, the combined expression panel of C2ORF72 + CTHRC1+ ENTPD5+ GLYATL1 with AUC =0.986,
sensitivity = 96.36, specificity = 93.94, and 95% CI: 0.933 to 0.999 displayed remarkable accuracy. Finally, the combination panel of LAMB3+ NTNG2 + TSLP with AUC = 0.986,
sensitivity = 98.18, specificity = 93.94, and CI %95 = 0.934 to 0.999 95% had better results than individual assay in the downregulated genes.
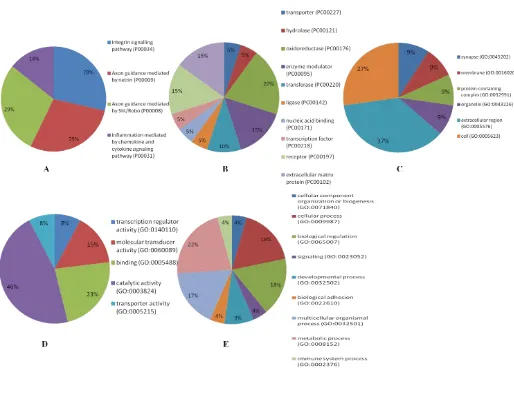
Fig. 3.Pie chart for functional classification of the down regulated genes by the panther. A: pathway analysis; B: protein class; C: cellular components; D: molecular function and E: biological processes based on GO-slim
microRNAs AUC Sensitivity Specificity 95% CI Significance level P (Area=0.5)
miR_96_5p 0.929 78.79 96.43 0.869 to 0.967 <0.0001
miR_148a_3p 0.909 74.75 96.43 0.846 to 0.953 <0.0001
miR_153_3p 0.898 72.73 96.43 0.832 to 0.945 <0.0001
miR_183_5p 0.877 82.83 82.14 0.807 to 0.929 <0.0001
miR_375_3p 0.822 82.83 71.43 0.744 to 0.884 <0.0001
miR_663a 0.868 88.89 71.43 0.796 to 0.921 <0.0001
miR-375+96+663 0.962 89.9 92.86 0.913 to 0.988 <0.0001
miR-133b 0.906 81.82 92.86 0.841 to 0.950 <0.0001
miR-143-3p 0.955 83.84 100 0.903 to 0.984 <0.0001
miR-143-5p 0.907 79.8 92.86 0.843 to 0.952 <0.0001
miR-145-5p 0.952 94.95 82.14 0.900 to 0.982 <0.0001
miR-221-3p 0.931 83.84 92.86 0.872 to 0.968 <0.0001
miR-222-3p 0.889 79.8 89.29 0.821 to 0.937 <0.0001
miR-886-3p 0.835 75.76 82.14 0.759 to 0.895 <0.0001
miR-205-5p 0.838 64.65 92.86 0.762 to 0.897 <0.0001
miR-133b+143-3p+205 0.994 97.98 96.43 0.961 to 1.000 <0.0001
Fig. 4.Receiver operating characteristic (ROC) curves of deregulated microRNAs expression profiles in tumor and control samples.
A-G show the ROC curves as well as sensitivity and specificity of up regulated microRNAs and microRNAs combination assays; H-P show the ROC curves as well as sensitivity and specificity of down regulated microRNAs and microRNAs combination assays.
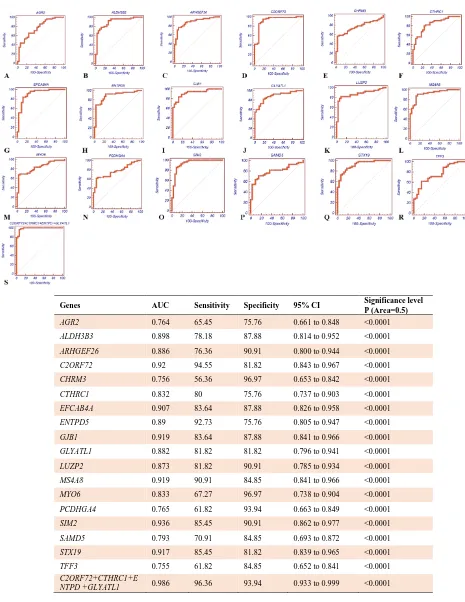
Genes AUC Sensitivity Specificity 95% CI Significance level P (Area=0.5)
AGR2 0.764 65.45 75.76 0.661 to 0.848 <0.0001
ALDH3B3 0.898 78.18 87.88 0.814 to 0.952 <0.0001
ARHGEF26 0.886 76.36 90.91 0.800 to 0.944 <0.0001
C2ORF72 0.92 94.55 81.82 0.843 to 0.967 <0.0001
CHRM3 0.756 56.36 96.97 0.653 to 0.842 <0.0001
CTHRC1 0.832 80 75.76 0.737 to 0.903 <0.0001
EFCAB4A 0.907 83.64 87.88 0.826 to 0.958 <0.0001
ENTPD5 0.89 92.73 75.76 0.805 to 0.947 <0.0001
GJB1 0.919 83.64 87.88 0.841 to 0.966 <0.0001
GLYATL1 0.882 81.82 81.82 0.796 to 0.941 <0.0001
LUZP2 0.873 81.82 90.91 0.785 to 0.934 <0.0001
MS4A8 0.919 90.91 84.85 0.841 to 0.966 <0.0001
MYO6 0.833 67.27 96.97 0.738 to 0.904 <0.0001
PCDHGA4 0.765 61.82 93.94 0.663 to 0.849 <0.0001
SIM2 0.936 85.45 90.91 0.862 to 0.977 <0.0001
SAMD5 0.793 70.91 84.85 0.693 to 0.872 <0.0001
STX19 0.917 85.45 81.82 0.839 to 0.965 <0.0001
TFF3 0.755 61.82 84.85 0.652 to 0.841 <0.0001
C2ORF72+CTHRC1+E
NTPD +GLYATL1 0.986 96.36 93.94 0.933 to 0.999 <0.0001
Fig. 5.Receiver operating characteristic (ROC) curves of up regulated genes expression profiles in tumor and control samples. A-S show the ROC curves as well as sensitivity and specificity of up regulated genes and genes combination assays.
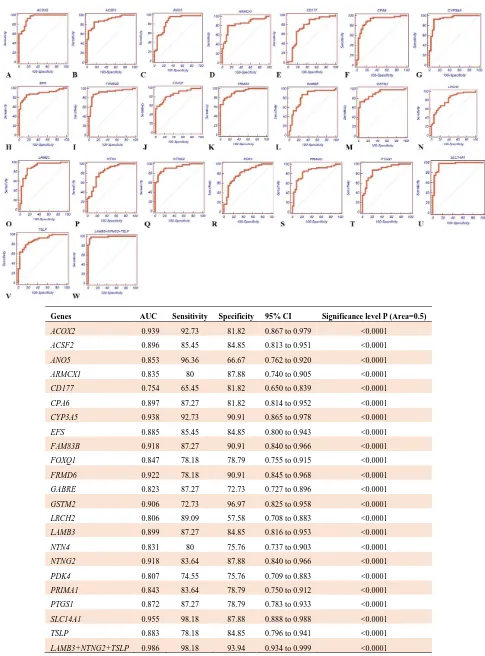
Genes AUC Sensitivity Specificity 95% CI Significance level P (Area=0.5)
ACOX2 0.939 92.73 81.82 0.867 to 0.979 <0.0001
ACSF2 0.896 85.45 84.85 0.813 to 0.951 <0.0001
ANO5 0.853 96.36 66.67 0.762 to 0.920 <0.0001
ARMCX1 0.835 80 87.88 0.740 to 0.905 <0.0001
CD177 0.754 65.45 81.82 0.650 to 0.839 <0.0001
CPA6 0.897 87.27 81.82 0.814 to 0.952 <0.0001
CYP3A5 0.938 92.73 90.91 0.865 to 0.978 <0.0001
EFS 0.885 85.45 84.85 0.800 to 0.943 <0.0001
FAM83B 0.918 87.27 90.91 0.840 to 0.966 <0.0001
FOXQ1 0.847 78.18 78.79 0.755 to 0.915 <0.0001
FRMD6 0.922 78.18 90.91 0.845 to 0.968 <0.0001
GABRE 0.823 87.27 72.73 0.727 to 0.896 <0.0001
GSTM2 0.906 72.73 96.97 0.825 to 0.958 <0.0001
LRCH2 0.806 89.09 57.58 0.708 to 0.883 <0.0001
LAMB3 0.899 87.27 84.85 0.816 to 0.953 <0.0001
NTN4 0.831 80 75.76 0.737 to 0.903 <0.0001
NTNG2 0.918 83.64 87.88 0.840 to 0.966 <0.0001
PDK4 0.807 74.55 75.76 0.709 to 0.883 <0.0001
PRIMA1 0.843 83.64 78.79 0.750 to 0.912 <0.0001
PTGS1 0.872 87.27 78.79 0.783 to 0.933 <0.0001
SLC14A1 0.955 98.18 87.88 0.888 to 0.988 <0.0001
TSLP 0.883 78.18 84.85 0.796 to 0.941 <0.0001
LAMB3+NTNG2+TSLP 0.986 98.18 93.94 0.934 to 0.999 <0.0001
Fig. 6.Receiver operating characteristic (ROC) curves of down regulated genes expression profiles in tumor and control samples.
A-W show the ROC curves as well as sensitivity and specificity of down regulated genes and genes combination assays.
Discussion
Deeper understanding of the molecular pathways involved in the pathogenesis of PCa may lead to new diagnostic biomarkers (32). MicroRNAs have a regulatory role in the biological processes as they silence their target genes at post-transcriptional or translational levels (33). MicroRNAs further regulate the molecular pathways involved in cancers, including PCa, by targeting multiple genes (34, 35). On the other hand, the aberrant expression of microRNAs in cancers has been widely reported. Therefore, the examination of microRNAs/their targets expression profiles can be conducive to identifying diagnostic cancer biomarkers (36). Bioinformatics tools, along with molecular biology techniques, are useful for comprehensive transcriptome studies and investigation of the molecular pathways involved in cancer (37). In this study, we used systems biology tools and high-throughput microarray datasets to investigate changes in the expression of microRNAs in 99 PCa tissue samples compared to normal prostate tissue samples. Further studied was the expression profile of the target genes through analyzing the integrative data obtained from three independent microarray experiments. Overall, our
study results showed significant changes in the expression of 14 microRNAs and 40 relevant target genes, which ultimately introduced four combination panels as candidate biomarkers that can distinguish PCa tumor samples against normal prostate tissue samples. Interestingly, the deregulation of the highlighted microRNAs (miR-96, miR-375, mir-663, miR-133b, miR-143, and miR-205) in PCa was reported in previous studies using qRT-PCR or northern blot assays (38-43). Mihelich et al. reported the upregulation of miR-96 expression (a member of the miR-183 family) in PCa tissue samples (43). In line with the results of the previous studies, our results showed that miR-96, targeting different genes such as FOXO1and NTNG2 in the FOXO signaling pathway, androgen
receptor signaling, apoptosis, and adhesion junction plays regulatory roles in the pathogenesis of PCa. Jiao et al., in a study on 127 PCa patients, indicated that miR-663 expression in tumor tissues was higher than normal samples, and associated with Gleason score and disease stage (38). MiR-663a, which was in the same cluster with miR-96 in our analysis, also has a pivotal role in targeting various genes such as LAMB3, involved in molecular PCa pathogenesis via the PI3K-Akt signaling pathway, ECM receptor interaction, and focal adhesion. In the same way, Szczyrba et al. conducted a 26-sample study using qRT-PCR technique, which showed an increase in the expression of miR-375 in 81% of tumor samples compared with normal specimens (39). The results of our study with regard to miR-375 were similar to those reported by Szczyrba et al. Although there were no changes in the expression of its target genes, the analysis of the miRpath3.0 showed that p53, FOXO, and Hippo signaling pathway are regulated by miR-375. Clape et al. reported the reduced expression of miR-143 in 25 PCa tissue samples, and suggested that it could be considered as a drug target (41). Verdoodt et al. studied 86 formalin fixed paraffin-embedded (FFPE) tissue samples obtained by primary PCa prostatectomy. Using qRT-PCR, they observed that the down- regulated expression of miR-205 was inversely related to tumor size in 76 samples (40). Our study results showed similar expression changes with regard to miR-143 and miR-205 in tumor samples compared to non- tumor counterparts. The results further revealed that miR-143-3p can be involved in the pathogenesis of PCa by targeting C2ORF72, MYO6, TFF3, AGR2, and STX19. Furthermore, miR-205 plays a similar role
in targeting genes such as GLYAT11, SIM2, CHRM3, EFCAB4A, and ARHGEF26. Few studies
on miR-133b as a member of the family of myomiRs (muscle specific microRNAs) in PCa tissues have been published so far. Using qRT-PCR method Guze et al. reported lower expressions of
miR-133b in 23 prostate tumor secretion samples compared with 25 BPH secretion samples (44, 45). As a result of our study, expression levels of miR-133b in tumor samples were reduced compared to non-tumor samples. Also, miR-133b contributes to the pathogenesis and progression of PCa by targeting the CTHRC1, SAMD5, and PCDHGA4 genes involved in biological processes such as biological adhesion and immune system process.
In conclusion, our bioinformatics study indicated four combination panels (i.e., miR- 375+ 96+ 663/ miR- 133b+ 143- 3p+ 205/ C2ORF72+ ENTPD5+ GLYAT11/ LAMB3+ NTNG2+ TSLP)
that can discriminate prostate tumor tissue samples from normal specimens. These biomarkers may help with early diagnosis of PCa along with currently available diagnostic tests. However, since the aim of our study was to investigate the data from high-throughput microarray data, the validation of the biomarker panels suggested by this study needs more investigation in future studies. Acknowledgements
This research did not receive any specific grant from funding agencies in the public, commercial, or not-for-profit sectors.
Conflict of interest
None declared.
References
1. Wishart DS. Is Cancer a Genetic Disease or a Metabolic
Disease? EBioMedicine 2015;2:478-9.
2. Global Burden of Disease Cancer C, Fitzmaurice C, Allen C,
et al. Global, Regional, and National Cancer Incidence,
Mortality, Years of Life Lost, Years Lived With Disability, and
Disability-Adjusted Life-years for 32 Cancer Groups, 1990 to
2015: A Systematic Analysis for the Global Burden of Disease
Study. JAMA Oncol 2017;3:524-48.
3. Helsmoortel H, Everaert C, Lumen N, et al. Detecting long
non-coding RNA biomarkers in prostate cancer liquid biopsies:
Hype or hope? Noncoding RNA Res 2018;3:64-74.
4. Alford AV, Brito JM, Yadav KK, et al. The Use of
Biomarkers in Prostate Cancer Screening and Treatment. Rev
Urol 2017;19:221-34.
5. Martin SK, Vaughan TB, Atkinson T, et al. Emerging
biomarkers of prostate cancer (Review). Oncol Rep
2012;28:409-17.
6. Fraser M, Berlin A, Bristow RG, et al. Genomic, pathological,
and clinical heterogeneity as drivers of personalized medicine in
prostate cancer. Urol Oncol 2015;33:85-94.
7. Shtivelman E, Beer TM, Evans CP. Molecular pathways and
targets in prostate cancer. Oncotarget 2014;5:7217-59.
8. Hornberg JJ, Bruggeman FJ, Westerhoff HV, et al. Cancer: a
Systems Biology disease. Biosystems 2006;83:81-90.
9. Macfarlane LA, Murphy PR. MicroRNA: Biogenesis,
Function and Role in Cancer. Curr Genomics 2010;11:537-61.
10. Takayama KI, Misawa A, Inoue S. Significance of
microRNAs in Androgen Signaling and Prostate Cancer
Progression. Cancers (Basel) 2017;9.
11. Jackson BL, Grabowska A, Ratan HL. MicroRNA in prostate
cancer: functional importance and potential as circulating
biomarkers. BMC Cancer 2014;14:930.
12. van't Veer LJ, Bernards R. Enabling personalized cancer
medicine through analysis of gene-expression patterns. Nature
2008;452:564-70.
13. Oliveto S, Mancino M, Manfrini N, et al. Role of
microRNAs in translation regulation and cancer. World J Biol
Chem 2017;8:45-56.
14. Mulrane L, McGee SF, Gallagher WM, et al. miRNA
dysregulation in breast cancer. Cancer Res 2013;73:6554-62.
15. Cesario A, Marcus F. Research and Clinical Applications.
Cancer Systems Biology, Bioinformatics and Medicine. 1 ed:
Springer Netherlands; 2011.
16. Li X, Gill R, Cooper NG, et al. Modeling microRNA-mRNA
interactions using PLS regression in human colon cancer. BMC
Med Genomics 2011;4:44.
17. Yang X, Zhu S, Li L, et al. Identification of differentially
expressed genes and signaling pathways in ovarian cancer by
integrated bioinformatics analysis. Onco Targets Ther
2018;11:1457-74.
18. Cao L, Chen Y, Zhang M, et al. Identification of hub genes
and potential molecular mechanisms in gastric cancer by
integrated bioinformatics analysis. PeerJ 2018;6:e5180.
19. Izadi F. Differential Connectivity in Colorectal Cancer Gene
Expression Network. Iran Biomed J 2019;23:34-46.
20. Guo K, Liang Z, Li F, et al. Comparison of miRNA and gene
expression profiles between metastatic and primary prostate
cancer. Oncol Lett 2017;14:6085-90.
21. Hu G, Lv Q, Yan J, et al. MicroRNA-17 as a promising
diagnostic biomarker of gastric cancer: An investigation
combining TCGA, GEO, meta-analysis, and bioinformatics.
FEBS Open Bio 2018;8:1508-23.
22. Taylor BS, Schultz N, Hieronymus H, et al. Integrative
genomic profiling of human prostate cancer. Cancer Cell
2010;18:11-22.
23. Meller S, Meyer HA, Bethan B, et al. Integration of tissue
metabolomics, transcriptomics and immunohistochemistry
reveals ERG- and gleason score-specific metabolomic alterations
in prostate cancer. Oncotarget 2016;7:1421-38.
24. Shan M, Xia Q, Yan D, et al. Molecular analyses of prostate
tumors for diagnosis of malignancy on fine-needle aspiration
biopsies. Oncotarget 2017;8:104761-71.
25. Mortensen MM, Hoyer S, Lynnerup AS, et al. Expression
profiling of prostate cancer tissue delineates genes associated
with recurrence after prostatectomy. Sci Rep 2015;5:16018.
26. Leek JT, Johnson WE, Parker HS, et al. The sva package for
removing batch effects and other unwanted variation in
high-throughput experiments. Bioinformatics 2012;28:882-3.
27. Benjamini Y, Hochberg Y. Controlling the false discovery
rate: a practical and powerful approach to multiple testing. J R
Stat Soc Ser B Methodol 1995;57:289-300.
28. Babicki S, Arndt D, Marcu A, et al. Heatmapper:
web-enabled heat mapping for all. Nucleic Acids Res
2016;44:W147-53.
29. Vlachos IS, Zagganas K, Paraskevopoulou MD, et al.
DIANA-miRPath v3.0: deciphering microRNA function with
experimental support. Nucleic Acids Res 2015;43:W460-6.
30. Mi H, Muruganujan A, Thomas PD. PANTHER in 2013:
modeling the evolution of gene function, and other gene
attributes, in the context of phylogenetic trees. Nucleic Acids
Res 2013;41:D377-86.
31. Carter JV, Pan J, Rai SN, et al. ROC-ing along: Evaluation
and interpretation of receiver operating characteristic curves.
Surgery 2016;159:1638-45.
32. Chang L, Ni J, Beretov J, et al. Identification of protein
biomarkers and signaling pathways associated with prostate
cancer radioresistance using label-free LC-MS/MS proteomic
approach. Sci Rep 2017;7:41834.
33. Kreth S, Hubner M, Hinske LC. MicroRNAs as Clinical
Biomarkers and Therapeutic Tools in Perioperative Medicine.
Anesth Analg 2018;126:670-81.
34. Kumar B, Lupold SE. MicroRNA expression and function in
prostate cancer: a review of current knowledge and opportunities
for discovery. Asian J Androl 2016;18:559-67.
35. Hayes J, Peruzzi PP, Lawler S. MicroRNAs in cancer:
biomarkers, functions and therapy. Trends Mol Med
2014;20:460-9.
36. Palmero EI, de Campos SG, Campos M, et al. Mechanisms
and role of microRNA deregulation in cancer onset and
progression. Genet Mol Biol 2011;34:363-70.
37. Likic VA, McConville MJ, Lithgow T, et al. Systems
biology: the next frontier for bioinformatics. Adv Bioinformatics
2010:268925.
38. Jiao L, Deng Z, Xu C, et al. miR-663 induces
castration-resistant prostate cancer transformation and predicts clinical
recurrence. J Cell Physiol 2014;229:834-44.
39. Szczyrba J, Loprich E, Wach S, et al. The microRNA profile
of prostate carcinoma obtained by deep sequencing. Mol Cancer
Res 2010;8:529-38.
40. Verdoodt B, Neid M, Vogt M, et al. MicroRNA-205, a novel
regulator of the anti-apoptotic protein Bcl2, is downregulated in
prostate cancer. Int J Oncol 2013;43:307-14.
41. Clape C, Fritz V, Henriquet C, et al. miR-143 interferes with
ERK5 signaling, and abrogates prostate cancer progression in
mice. PLoS One 2009;4:e7542.
42. Li X, Wan X, Chen H, et al. Identification of miR-133b and
RB1CC1 as independent predictors for biochemical recurrence
and potential therapeutic targets for prostate cancer. Clin Cancer
Res 2014;20:2312-25.
43. Mihelich BL, Khramtsova EA, Arva N, et al.
miR-183-96-182 cluster is overexpressed in prostate tissue and regulates zinc
homeostasis in prostate cells. J Biol Chem 2011;286:44503-11.
44. Li D, Xia L, Chen M, et al. miR-133b, a particular member
of myomiRs, coming into playing its unique pathological role in
human cancer. Oncotarget 2017;8:50193-208.
45. Guzel E, Karatas OF, Semercioz A, et al. Identification of
microRNAs differentially expressed in prostatic secretions of
patients with prostate cancer. Int J Cancer 2015;136:875-9.