R E S E A R C H A R T I C L E
Open Access
Low contrast visual acuity testing is associated
with cognitive performance in multiple sclerosis:
a cross-sectional pilot study
Laura Wieder
1, Gunnar Gäde
1, Luisa M Pech
1, Hanna Zimmermann
1, Klaus-Dieter Wernecke
2, Jan-Markus Dörr
1,3,
Judith Bellmann-Strobl
1,3, Friedemann Paul
1,2,4and Alexander U Brandt
1*Abstract
Background:Cognitive impairment and visual deterioration are two key clinical symptoms in MS and affect 50 to 80% of patients. Little is known about the influence of cognitive impairment on visual tests recommended for MS such as low contrast sensitivity testing. Our objective was to investigate whether low contrast sensitivity testing is influenced by cognitive impairment in multiple sclerosis (MS) patients.
Methods:Cross-sectional study including 89 patients with relapsing-remitting MS. All patients received cognitive evaluation using Rao’s Brief Repeatable Battery of Neuropsychological Testing (BRB-N). Visual assessments included low contrast sensitivity (CS) by functional acuity contrast testing and high contrast visual acuity (VA) using ETDRS charts. Retinal morphology as visual impairment correlate was measured using retinal nerve fiber layer (RNFL) thickness by optical coherence tomography.
Results:In combined analyses using generalized estimating equation models, Paced Auditory Serial Addition Test (PASAT) and RNFL as well as and the Symbol Digit Modalities Test (SDMT) and RNFL predicted CS. To further control for a potential influence of the anterior visual system we performed partial correlation analyses between visual function and cognitive function test results but controlling for RNFL. Even when controlling for RNFL, CS was associated with PASAT performance and SDMT performance.
Conclusion:Our data show that: a) cognitive impairment and performance in visual function tests such as low contrast sensitivity testing are associated; b) the main cognitive domains correlating with visual test performance are information processing speed and, to a lesser degree, memory; This preliminary data needs to be substantiated in further studies investigating patients with a higher cognitive burden, healthy controls and in longitudinal settings.
Keywords:Multiple sclerosis, Cognition, Vision, Vision tests, Contrast sensitivity, Neuropsychological tests, Optical coherence tomography, Retinal nerve fiber layer
Background
Multiple sclerosis (MS) is the most prevalent auto-immune disorder of the central nervous system and pre-sents with a variety of neurologic symptoms [1]. About 80% of patients experience visual dysfunction which is the presenting symptom in every second patient [2]. Even in visually asymptomatic patients, subclinical visual
system deficits can be detected using high-sensitivity methods like high-pass resolution perimetry [3] or high resolution optical coherence tomography (OCT) [4,5].
Due to the frequency of visual deficits in MS, assess-ment of visual function plays an important role in clin-ical trials and clinclin-ical practice [6]. Visual symptoms are usually assessed during neurological examination with a combination of history taking, finger-perimetric visual field assessment and visual acuity testing using Snellen charts [7]. However, previous studies have shown that detection and quantification of visual dysfunction with
* Correspondence:[email protected]
1
NeuroCure Clinical Research Center, Charité–Universitätsmedizin Berlin, Berlin, Germany
Full list of author information is available at the end of the article
high contrast visual acuity testing is insufficient. Particu-larly, mild changes are easily overlooked [8]. Hence, sev-eral recent studies have investigated higher sensitivity tools based on low contrast sensitivity testing for detect-ing damage to the visual pathway. Here, the Sloan low contrast visual acuity charts [6,9-11] and the Pelli-Robson contrast sensitivity charts [10,12] have been demonstrated as superior to high contrast visual acuity testing in MS. Both visual outcome measures have also been shown to correlate strongly with retinal nerve fibre layer (RNFL) thickness [13], which is an important OCT marker for assessing the structural integrity of retinal axons [14,15]. Likewise, functional acuity contrast test-ing (FACT), as an alternative method for assesstest-ing low contrast sensitivity, was shown to correlate well with ret-inal axon damage in MS [16]. Consequently, clinician-researchers have suggested including low contrast visual acuity testing in the Multiple Sclerosis Functional Com-posite (MSFC), the most widely used quantitative clinical assessment tool in MS [9,17,18].
In order to better understand both the benefits and the limitations of low contrast visual function testing, further studies are needed to define their place in the often complicated array of neurological symptoms in MS patients. Sophisticated visual function tests have become increasingly challenging and demanding for the patient. For example, the identification of letters (e.g. Sloan and Pelli-Robson charts) or the direction of grated lines (FACT) most likely requires higher cognitive functions. We therefore hypothesised that test performance is likely not only influenced by visual impairment (in terms of actual morphological damage to the anterior visual sys-tem) but also by higher cognitive and executive functions.
Cognitive impairment (CI) is also a common symptom in MS with a prevalence of about 50% [19] and mild cognitive decline can even begin in early MS [20]. Pro-cessing speed, working memory and executive function are the cognitive domains mainly affected [19].
In light of this, our study sought to determine how cognitive impairment influences low contrast sensitivity testing. Here we report cross-sectional data from a large prospective cohort of relapsing-remitting MS patients. To assess morphological visual impairment we deter-mined RNFL thickness [14]. Cognitive function was assessed using Rao’s Brief Repeatable Battery of Neuro-psychological Testing (BRB-N) [21].
Methods
Patients and study design
For this cross-section pilot study, eighty-nine patients with RRMS according to the 2005 panel criteria [22] were recruited from the outpatient clinic of the Clinical and Experimental Multiple Sclerosis Research Center at the Charité – Universitätsmedizin Berlin. Inclusion
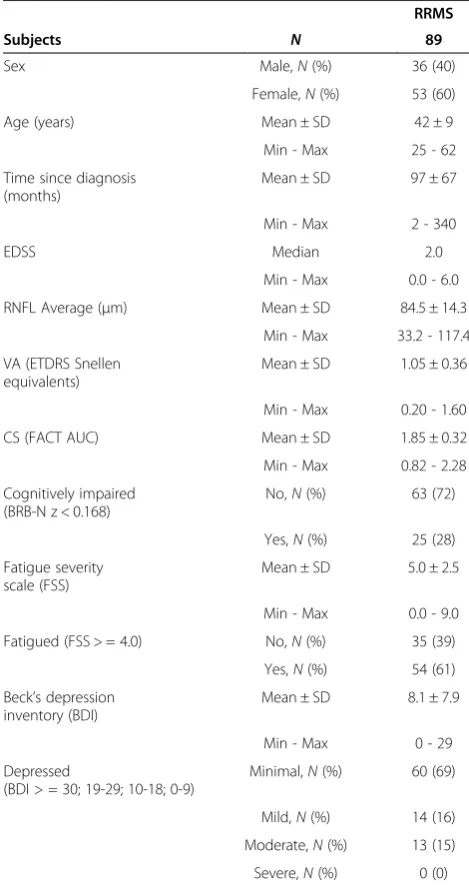
criteria were: definite RRMS, Expanded Disability Status Scale (EDSS) between 0.0 and 6.0, stable immune-modulatory therapy for at least 6 months. Exclusion criteria were: acute relapses and/or steroid treatment three months prior to inclusion, any other ocular diseases with known retinal pathology (i.e. glaucoma), refractive error > ±5 dpt. There were no specific inclusion or exclusion criteria in re-gard to cognitive or psychiatric status. Patients underwent clinical assessment, neuropsychological testing and visual examination within a three-month period. An overview of the cohort’s demographic details is given in Table 1.
Table 1 Overview of cohort’s clinical and visual data RRMS
Subjects N 89
Sex Male,N(%) 36 (40)
Female,N(%) 53 (60)
Age (years) Mean ± SD 42 ± 9
Min - Max 25 - 62
Time since diagnosis (months)
Mean ± SD 97 ± 67
Min - Max 2 - 340
EDSS Median 2.0
Min - Max 0.0 - 6.0
RNFL Average (μm) Mean ± SD 84.5 ± 14.3
Min - Max 33.2 - 117.4
VA (ETDRS Snellen equivalents)
Mean ± SD 1.05 ± 0.36
Min - Max 0.20 - 1.60
CS (FACT AUC) Mean ± SD 1.85 ± 0.32
Min - Max 0.82 - 2.28
Cognitively impaired (BRB-N z < 0.168)
No,N(%) 63 (72)
Yes,N(%) 25 (28)
Fatigue severity scale (FSS)
Mean ± SD 5.0 ± 2.5
Min - Max 0.0 - 9.0
Fatigued (FSS > = 4.0) No,N(%) 35 (39)
Yes,N(%) 54 (61)
Beck’s depression inventory (BDI)
Mean ± SD 8.1 ± 7.9
Min - Max 0 - 29
Depressed
(BDI > = 30; 19-29; 10-18; 0-9)
Minimal,N(%) 60 (69)
Mild,N(%) 14 (16)
Moderate,N(%) 13 (15)
Severe,N(%) 0 (0)
The study was approved by the local ethics committee of the Charité – Universitätsmedizin Berlin and was con-ducted in accordance with the Declaration of Helsinki in its current version. All patients gave written informed consent.
Clinical examination and neuropsychological testing
All participants underwent clinical neurological examin-ation, including the EDSS, under the supervision of a board-certified neurologist [7]. Fatigue was assessed using the Fatigue Severity Scale (FSS) [23]. Patient with a mean FSS score > = 4 were classified as fatigued. Depression was assessed using Beck’s Depression inven-tory (BDI) [24]. Patients’ depression was classified using the following cutoff-values: Minimal: 0–9; Mild: 10–18; Moderate: 19–29; Severe: > = 30. The BDI was not avail-able for two patients. Patients performed all subtests of the German BRB-N version A under supervision of trained examiners and with best available optic correction [21,25]. Tests were performed as previously described in detail [26]. Briefly, the BRB-N consists of the following subtests: 1) Selective Reminding Testing (SRT)[27], which measures verbal learning and memory in terms of imme-diate recall (SRT-LTS and SRT-CLTR) and delayed recall (SRT-D); 2) 10/36-Spatial Recall Testing [28], which mea-sures the visio-spatial memory in terms of immediate re-call (SPART) and delayed rere-call (SPART-D); 3) Symbol Digit Modalities Testing (SDMT) [29], which tests infor-mation processing speed and concentration; 4) Paced Auditory Serial Addition Testing [30], including the three-second version (PASAT3) and the two-three-second version (PASAT2), which measures information-processing speed and working memory; 5) Word List Generation (WLG) [31], which tests semantic verbal fluency, verbal produc-tion and executive funcproduc-tion. BRB-N z-scores were calcu-lated as previously described against normative data for German MS patients using the original script kindly pro-vided by Dr. Scherer [25]. Patients were classified as cog-nitively impaired when z-score < 1.68 [25].
Visual acuity and contrast sensitivity
Visual acuity (VA) and contrast sensitivity (CS) were analysed using the “Optec 6500 P vision testing system” (Stereo Optical, Chicago, Illinois). A trained operator performed all examinations in a darkened room. VA was assessed in decimal fractions using Early Treatment Dia-betic Retinopathy Study (ETDRS) charts. These results were then summarised by translation into Snellen equiv-alents. CS was measured using Functional Acuity Con-trast Testing (FACT) and was performed monocularly for both eyes with test scores as the last correct grating determined under photopic conditions without glare. Pho-topic conditions were simulated with 85 cd/m2at target image. FACT evaluation was performed by calculating the Area Under the Log Contrast Sensitivity Function (AUC)
as previously described in detail [16]. Briefly, the five con-trast sensitivity values at five different spatial frequencies for each measurement were transformed into logarithmic expression and a curve combining all values using a poly-nomial fit function was calculated. The AUC was then cal-culated as the area between the lowest and highest spatial frequency under this curve.
Optical coherence tomography
Optical coherence tomography was performed on both eyes of each patient using a spectral domain OCT (SD-OCT) device (Heidelberg Spectralis, Heidelberg Engineering, Heidelberg, Germany) by experienced operators. Retinal nerve fibre layer thickness (RNFL) was measured using standard protocol with three 3.4 mm circular scans. All scans were reviewed for scan quality according to [32]. The scan with the highest quality or, if equal quality was achieved, an arbitrarily selected one, was included in the analysis.
Statistical analysis
The correlation between visual and cognitive tests was analysed using generalized estimating equations models (GEE) to account for within-patient inter-eye effects. Combined models using both RNFL and PASAT or RNFL and SDMT as multiple independent variables and CS as dependent variable were analysed using GEE. An estimation of the partial correlation between cognitive tests and visual tests controlled for RNFL was calculated using the following approach: First, GEE analyses were performed, with each parameter as dependent variable and RNFL as independent variable in a normalized fash-ion. The residuals from these models were then fed into a Spearman’s Rho correlation analysis, producing results comparable to those of a regular partial correlation ana-lysis, but which also take into account within-subject inter-eye effects. Local regression analysis (LOESS) was used to visually estimate influence of cognitive impair-ment on visual function testing [33]. All statistical ana-lyses were performed using SPSS Statistics 20 (SPSS Statistics Version 20, IBM, Armonk, NY, USA). A type I error level of α = 0.05 was taken to indicate statistical significance. All test results should be considered ex-ploratory data analysis as no previous sample size calcu-lation or adjustment for multiple testing was applied.
Results
Correlation between RNFL and visual and cognitive performance
GEE models. As expected, RNFL thickness predicted high contrast VA (B = 0.011, SE = 0.002, p < 0.001) and CS (B = 0.011, SE = 0.002, p < 0.001). In contrast, there was no correlation between RNFL thickness and any of the BRB-N tests (p≥0.223).
Subsequently, we investigated whether visual function testing correlated with cognitive test performance. Here,
CS correlated significantly with BRB-N z-scores and most subtests, except SRT-CLTR and SPART-D (Table 2).
Correlation between contrast sensitivity and cognition when controlling for RNFL
To determine whether the anterior visual system (i.e. ret-inal damage) influences the correlations discussed above, Table 2 Data from cognitive testing and correlation with visual test performance
GEE vs. CS Part. Corr. vs. VA Part. Corr. vs. CS
Mean SD Min Max B SE P Coefficient P Coefficient P
SRT-LTS 60 11 24 72 0.008 0.003 0.007 0.079 0.333 0.154 0.093
SRT-CLTR 55 15 4 72 0.004 0.003 0.103 0.081 0.319 0.160 0.080
SRT-D 11 2 2 12 0.057 0.021 0.008 0.188 0.021 0.336 <0.001
SPART 23 5 10 30 0.019 0.007 0.012 0.240 0.003 0.215 0.018
SPART-D 9 2 3 10 0.025 0.025 0.321 0.154 0.058 0.055 0.548
SDMT 56 12 32 85 0.010 0.002 <0.001 0.338 <0.001 0.343 <0.001
PASAT3 50 9 24 60 0.014 0.003 <0.001 0.171 0.035 0.286 <0.001
PASAT2 40 9 19 59 0.009 0.004 0.013 0.157 0.082 0.240 0.019
WLG 28 7 14 42 0.014 0.005 0.008 −0.056 0.496 0.221 0.016
BRB-N z 0.685 1.270 −4.084 2.715 0.083 0.029 0.004 0.142 0.083 0.249 0.006
Abbreviations:SRT-LTSselective reminding test long term storage,SRT-CLTRselective reminding test consistant long term retrieval, SRT-Dselective reminding test delayed recall,SPARTspatial recall test,SPART-Dspatial recall test delayed recall,PASATpaced auditory serial addition test,WLGword list generation,BRB-Nbrief repeatable battery of neuropsychological tests,VAhigh contrast visual acuity,CSlow contrast sensitivity.
Significant P values are printed in bold.
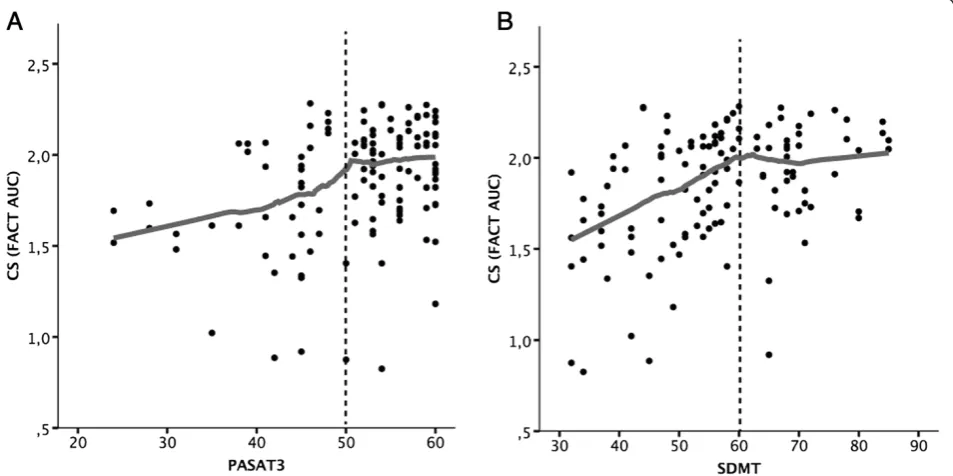
we performed partial correlation analyses between visual function and cognitive function tests but controlling for RNFL. This way, an influence of actual retinal damage to the performance on visual tests should be eliminated. When controlling for RNFL, a clear correlation was deter-mined between VA and SRT-D, SPART, SDMT and PASAT3. Likewise, CS correlated with the latter cognitive tests, as well as with PASAT2 and WLG (Table 2). In the involved domains, coefficients were moderate and roughly twice as high for cognitive influence on CS as for cognitive influence on VA with the exception of SDMT, a visually dependent cognitive test. SDMT correlation with visual function testing was highest among all tests with r = 0.34 both in CS and VA testing (Figure 1).
Cognitive function and RNFL together predict contrast sensitivity
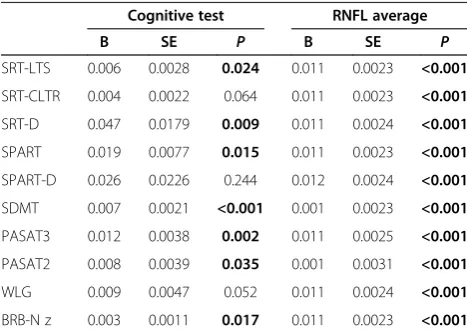
To determine whether retinal morphology and cognitive function have an additive effect, we assessed the combined effect of cognitive test performance and RNFL on visual function testing. Detailed results are given in Table 3. In summary, in a multiple GEE both PASAT and RNFL pre-dicted CS. Similarly, both SDMT and RNFL correlated with CS. BRB-N and all subtests except SRT-CLTR, SPAT-D and WLG were also significantly predictive of CS.
Discussion
Our cross-sectional pilot study investigated the influence of cognitive impairment on visual function testing in MS patients. Our data show that a) cognitive impairment correlates with performance in visual function tests such as low contrast sensitivity testing; b) the main cognitive
domains correlating with visual test performance are information processing speed and, to a lesser degree, memory.
When quantifying clinical symptoms in MS patients, the examiner has to carefully consider bias from other functional domains. For example, in cognitive testing, motor impairment can impede the provision of a signal by pressing a button, while visual impairment can ham-per the recognition of figures or shapes. Overall, little attention has been paid to the interplay between cogni-tive and visual function and its potential influence on clinical testing. Two previous investigations studying the converse of our study focus were able to demonstrate the validity of their hypothesis, namely, that visual acuity indeed influences performance in visually dependent cognitive tests like SDMT [34,35]. The authors’ conc-lusion was that visual dysfunction potentially impairs test performance in visually dependent cognitive tests. Changes in cognitive function might therefore be over-or underestimated when switching from non-visually dependent tests like PASAT to visually dependent tests like SDMT. Consequently, visual pre-screening is cur-rently recommended when applying and interpreting visually dependent cognitive test results [36].
But can on the other hand cognitive impairment influ-ence visual function test results? A recent study investi-gating auditory-based cognitive tests (i.e. PASAT) in combination with low contrast visual acuity showed that the latter correlates strongly with visually dependent but also non-visually dependent cognitive test results [37]. However, crucially, the authors did not compare their findings to actual damage to the visual pathway [13]. By not factoring in morphological assessment such as by RFNL thickness, the correlation between cognitive im-pairment and visual function could simply have been a correlate of overall disease progression with visual and cognitive performance declining in parallel, yet inde-pendently. This reservation is underlined by the results of a study by Toledo and colleagues, which has shown strong correlation between RNFL thickness and cogni-tive impairment [38]. Our assessment of the relationship between cognitive and visual test performance excised the influence of optical morphological damage by including RNFL thickness measurements in our analysis. As the cor-relation between non-visually dependent cognitive test re-sults and visual function tests remained intact, our rere-sults provide evidence to support the hypothesis that cognitive impairment influences visual test scores. Particularly our investigation of the correlation between SDMT and VA in-dicates that more demanding visual tests are affected by cognitive impairment.
The main cognitive domain correlating with visual test performance was speed of information processing, which is a key domain keenly affected in MS [19]. Reduced Table 3 Results from combined GEE predicting low
contrast sensitivity test performance
Cognitive test RNFL average
B SE P B SE P
SRT-LTS 0.006 0.0028 0.024 0.011 0.0023 <0.001
SRT-CLTR 0.004 0.0022 0.064 0.011 0.0023 <0.001
SRT-D 0.047 0.0179 0.009 0.011 0.0024 <0.001
SPART 0.019 0.0077 0.015 0.011 0.0023 <0.001
SPART-D 0.026 0.0226 0.244 0.012 0.0024 <0.001
SDMT 0.007 0.0021 <0.001 0.001 0.0023 <0.001
PASAT3 0.012 0.0038 0.002 0.011 0.0025 <0.001
PASAT2 0.008 0.0039 0.035 0.001 0.0031 <0.001
WLG 0.009 0.0047 0.052 0.011 0.0024 <0.001
BRB-N z 0.003 0.0011 0.017 0.011 0.0023 <0.001
Abbreviations:SRT-LTSselective reminding test long term storage,SRT-CLTR selective reminding test consistant long term retrieval,SRT-Dselective reminding test delayed recall,SPARTspatial recall test,SPART-Dspatial recall test delayed recall,PASATpaced auditory serial addition test,WLGword list generation,BRB-Nbrief repeatable battery of neuropsychological tests,RNFL retinal nerve fiber layer thickness.
speed of information processing has been since long rec-ognized as one of the hallmark cognitive domains im-paired in MS and is the basis for PASAT and SDMT being used as screening tests for cognitive impairment in MS, since both tests mainly assess this domain [36]. Studies have suggested that reduced processing speed might be the result of alterations in participating neural networks due to damaged white and grey matter [39]. Put simply, compared to health controls, MS patients take more time to complete tasks in cognitive testing, because they require greater neural recruitment [40]. Our results might be explained by the influence of simi-lar neural network disruptions in cognitive domains when processing visual tests, suggesting that investiga-tion of neural recruitment also in higher cognitive do-mains during low contrast visual acuity testing may well prove a valuable avenue of further investigation.
Other studies have shown that changes in the atten-tion network might also contribute to this reducatten-tion in processing speed [41]. For example, Motoyoshi showed in a recent study that diminishment of attention by in-clusion of a concurrent task reduces CS for grating with low temporal frequencies, and concluded that CS might well be generally modulated by attention [42]. However, this finding could be specific to the grating charts used in our and also Motoyoshi’s study and might not apply to letter-based low contrast acuity testing like that of the Sloan test.
Caveats of our study include the lack of a healthy con-trol group. As a result, our study cannot determine whether the observed influence is disease specific (as the focus on processing speed suggests) or performance spe-cific (meaning that also healthy individuals with low cog-nitive performance might show similar associations). Additionally, our study included mostly patients with mild or no cognitive impairment. A study investigating patients with an on average higher cognitive and clinical burden would allow more meaningful assessment of the dimension of cognitive influence on visual test results within a range of higher cognitive impairment. In this regard it would be of interest, how our results relate to general disease activity markers i.e. from magnetic resonance imaging. Unfortunately these were not avail-able for this cohort, which is another weakness of this study. As a result, this study cannot answer the question, how much of the reported effects might be based on overall disease progression (i.e. both the visual and cognitive systems progress in parallel but independently of each other).
Furthermore, RNFL only represents a limited portion of the visual pathway and results might not include changes in areas such as the posterior visual pathway [43] between the lateral geniculate corpora and the oc-cipital cortex, caused not by optic neuritis (ON) [44],
but by incidental lesions [45]. Thus, our correction for RNFL may not have included the entirety of mor-phological damage to the visual system in our study participants. This could be addressed in a subsequent study by employing e.g. visually evoked potentials (VEP) to accurately define the influence of the visual pathway on visual test performance using an alterna-tive method [46].
Of note, some discrepancies exist between our study and the study by Toledo et al. [38]. Although sample size, disease severity and applied methods were compar-able, Toledo and colleagues found a moderate correl-ation between RNFL and cognitive impairment in several cognitive domains, whereas our data did not show this correlation. This is most likely explained by the heterogeneity of the disease but should serve as a reminder that our results should be confirmed in a dif-ferent cohort.
Our findings are relevant both for clinical trials and clinical practitioners. Visual and cognitive impairment are key determinants of disease burden in MS, and ascertaining the impairment of both is important in the assessing of any new immunomodulatory or symp-tomatic therapy [47]. Although the correlation between cognitive and visual function in our study was only mod-erate (less than 6% of CS test variance could be ex-plained by cognitive dysfunction based on BRB-N, 12% based on SDMT), the effect might prove highly relevant in longitudinal observations, when changes in cognitive function might manifest as changes in visual test perfor-mances. For example, a reduction in cognitive perform-ance could present as a change in visual function. Vice versa, an improvement in cognitive function after an acute relapse could also translate into improved visual function test results [48]. When applying low contrast sensitivity testing as outcome measure in clinical trials [49], careful investigation of possible confounders from cognitive impairment is therefore warranted. Of note, the shown correlation between cognitive performance and visual test results does not prove a causal relation-ship. This cross-sectional pilot data has therefore only a limited explanatory power. A longitudinal study is there-fore currently underway.
Conclusion
Competing interests
The authors declare that they have no competing interests.
Authors’contributions
LW performed and analyzed cognitive assessments, participated in the statistical analysis and wrote the manuscript. GG and LMP performed cognitive assessments and visual function tests. HZ performed OCT and visual function tests. KDW planned the statistical analysis. JMD and JBS were responsible for patient recruitment and clinical assessment. FP planned the study and revised the manuscript. AUB planned the study, planned and performed the statistical analysis and wrote the manuscript. All authors provided important intellectual content during the study and revising the manuscript. All authors read and approved the final manuscript.
Acknowledgements
This work was supported by DFG grant Exc. 257 from the German Research Foundation and a limited research grant from Novartis Germany, which had no active roles in the study. We thank Cynthia Kraut for excellent technical support. We would also like to thank James Ari Liebkowsky for linguistic revision and proofreading of the manuscript.
Author details
1NeuroCure Clinical Research Center, Charité–Universitätsmedizin Berlin,
Berlin, Germany.2SOSTANA GmbH and Prof. em. Institute of Medical Biometrics and Clinical Epidemiology, Charité–Universitätsmedizin Berlin, Berlin, Germany.3Clinical and Experimental Multiple Sclerosis Research Center, Charité–Universitätsmedizin Berlin, Berlin, Germany.4Department of
Neurology, Charité–Universitätsmedizin Berlin, Berlin, Germany.
Received: 7 May 2013 Accepted: 28 October 2013 Published: 8 November 2013
References
1. Compston A, Coles A:Multiple sclerosis.Lancet 25,372:1502–1517. 2. Balcer LJ, Baier ML, Kunkle AM, Rudick RA, Weinstock-Guttman B, Simonian N,
Galetta SL, Cutter GR, Maguire MG:Self-reported visual dysfunction in multiple sclerosis: results from the 25-Item National Eye Institute Visual Function Questionnaire (VFQ-25).Mult Scler2000,6:382–385.
3. Lycke J, Tollesson PO, Frisén L:Asymptomatic visual loss in multiple sclerosis.J Neurol2001,248:1079–1086.
4. Oberwahrenbrock T, Ringelstein M, Jentschke S, Deuschle K, Klumbies K, Bellmann-Strobl J, Harmel J, Ruprecht K, Schippling S, Hartung H-P, Aktas O, Brandt AU, Paul F:Retinal ganglion cell and inner plexiform layer thinning in clinically isolated syndrome.Mult Scler2013. PMID 23702433. [Epub ahead of print]
5. Zimmermann H, Freing A, Kaufhold F, Gaede G, Bohn E, Bock M, Oberwahrenbrock T, Young K-L, Dörr J, Wuerfel JT, Schippling S, Paul F, Brandt AU:Optic neuritis interferes with optical coherence tomography and magnetic resonance imaging correlations.Mult Scler2012,19:443–50. 6. Baier ML, Cutter GR, Rudick RA, Miller D, Cohen JA, Weinstock-Guttman B,
Mass M, Balcer LJ:Low-contrast letter acuity testing captures visual dysfunction in patients with multiple sclerosis.Neurology2005,64:992–995. 7. Kurtzke JF:Rating neurologic impairment in multiple sclerosis: an
expanded disability status scale (EDSS).Neurology1983,33:1444–1452. 8. Balcer LJ, Baier ML, Pelak VS, Fox RJ, Shuwairi S, Galetta SL, Cutter GR,
Maguire MG:New low-contrast vision charts: reliability and test charac-teristics in patients with multiple sclerosis.Mult Scler2000,6:163–171. 9. Balcer LJ, Baier ML, Cohen JA, Kooijmans MF, Sandrock AW, Nano-Schiavi ML,
Pfohl DC, Mills M, Bowen J, Ford C, Heidenreich FR, Jacobs DA, Markowitz CE, Stuart WH, Ying G-S, Galetta SL, Maguire MG, Cutter GR:Contrast letter acuity as a visual component for the Multiple Sclerosis Functional Composite.
Neurology2003,61:1367–1373.
10. Merle H, Olindo S, Donnio A, Beral L, Richer R, Smadja D, Cabre P:Retinal nerve fiber layer thickness and spatial and temporal contrast sensitivity in multiple sclerosis.Eur J Ophthalmol2010,20:158–166.
11. Mowry EM, Loguidice MJ, Daniels AB, Jacobs DA, Markowitz CE, Galetta SL, Nano-Schiavi ML, Cutter GR, Maguire MG, Balcer LJ:Vision related quality of life in multiple sclerosis: correlation with new measures of low and high contrast letter acuity.J Neurol Neurosurg Psychiatr2009,80:767–772. 12. Trobe JD, Beck RW, Moke PS, Cleary PA:Contrast sensitivity and other vision tests in the optic neuritis treatment trial.Am J Ophthalmol1996,121:547–553.
13. Fisher JB, Jacobs DA, Markowitz CE, Galetta SL, Volpe NJ, Nano-Schiavi ML, Baier ML, Frohman EM, Winslow H, Frohman TC, Calabresi PA, Maguire MG, Cutter GR, Balcer LJ:Relation of visual function to retinal nerve fiber layer thickness in multiple sclerosis.Ophthalmol2006,113:324–332.
14. Oberwahrenbrock T, Schippling S, Ringelstein M, Kaufhold F, Zimmermann H, Keser N, Young KL, Harmel J, Hartung H-P, Martin R, Paul F, Aktas O, Brandt AU: Retinal damage in multiple sclerosis disease subtypes measured by high-resolution optical coherence tomography.Mult Scler Int2012,2012. 15. Bock M, Brandt AU, Dörr J, Pfueller CF, Ohlraun S, Zipp F, Paul F:Time
domain and spectral domain optical coherence tomography in multiple sclerosis: a comparative cross-sectional study.Mult Scler2010,16:893–896. 16. Bock M, Brandt AU, Kuchenbecker J, Dörr J, Pfueller CF, Weinges-Evers N,
Gaede G, Zimmermann H, Bellmann-Strobl J, Ohlraun S, Zipp F, Paul F: Impairment of contrast visual acuity as a functional correlate of retinal nerve fibre layer thinning and total macular volume reduction in multiple sclerosis.Brit J Ophthalmol2012,96:62–67.
17. Ontaneda D, LaRocca N, Coetzee T, Rudick R, NMSS MSFC Task Force: Revisiting the multiple sclerosis functional composite: proceedings from the National Multiple Sclerosis Society (NMSS) Task Force on Clinical Disability Measures.Mult Scler2012,18:1074–1080.
18. Cohen JA, Reingold SC, Polman CH, Wolinsky JS:Disability outcome measures in multiple sclerosis clinical trials: current status and future prospects.Lancet Neurol2012,11:467–476.
19. Chiaravalloti ND, DeLuca J:Cognitive impairment in multiple sclerosis.
Lancet Neurol2008,7:1139–1151.
20. Potagas C, Giogkaraki E, Koutsis G, Mandellos D, Tsirempolou E, Sfagos C, Vassilopoulos D:Cognitive impairment in different MS subtypes and clinically isolated syndromes.J Neurol Sci2008,267:100–106. 21. Rao SM:Neuropsychology of multiple sclerosis.Curr Opin Neurol1995,
8:216–220.
22. Polman CH, Reingold SC, Edan G, Filippi M, Hartung H-P, Kappos L, Lublin FD, Metz LM, McFarland HF, O’Connor PW, Sandberg-Wollheim M, Thompson AJ, Weinshenker BG, Wolinsky JS:Diagnostic criteria for multiple sclerosis: 2005 revisions to the“McDonald Criteria.Ann Neurol2005,58:840–846. 23. Krupp LB, LaRocca NG, Muir-Nash J, Steinberg AD:The fatigue severity
scale. Application to patients with multiple sclerosis and systemic lupus erythematosus.Arch Neurol1989,46:1121–1123.
24. Beck AT, Steer RA, Carbin MG:Psychometric properties of the Beck Depression Inventory: Twenty-five years of evaluation.Clin Psychol Rev
1988,8:77–100.
25. Scherer P, Baum K, Bauer H, Göhler H, Miltenburger C:Normalization of the Brief Repeatable Battery of Neuropsychological tests (BRB-N) for
German-speaking regions. Application in relapsing-remitting and secondary progressive multiple sclerosis patients.Nervenarzt2004,75:984–990. 26. Weinges-Evers N, Brandt AU, Bock M, Pfueller CF, Dörr J, Bellmann-Strobl J,
Scherer P, Urbanek C, Boers C, Ohlraun S, Zipp F, Paul F:Correlation of self-assessed fatigue and alertness in multiple sclerosis.Mult Scler2010, 16:1134–1140.
27. Buschke H, Fuld PA:Evaluating storage, retention, and retrieval in disordered memory and learning.Neurology1974,24:1019–1025. 28. Barbizet J, Cany E:Clinical and psychometrical study of a patient with
memory disturbances.Int J Neurol1968,7:44–54. 29. Smith A:Symbol digit modalities test.1991.
30. Gronwall DM:Paced auditory serial-addition task: a measure of recovery from concussion.Percept Mot Skills1977,44:367–373.
31. Rao SM, Cognitive Function Study Group, NMSS:A Manual for the Brief Repeatable Battery of Neuropsychological Tests in Multiple Sclerosis National Multiple Sclerosis Society: New York..
32. Tewarie P, Balk L, Costello F, Green A, Martin R, Schippling S, Petzold A:The OSCAR-IB consensus criteria for retinal OCT quality assessment.PLoS ONE
2012,7:e34823.
33. Cleveland WS:Robust locally weighted regression and smoothing scatterplots.J Am Stat Assoc1979,74:829–836.
34. Bruce JM, Bruce AS, Arnett PA:Mild visual acuity disturbances are associated with performance on tests of complex visual attention in MS.
J Int Neuropsychol Soc2007,13:544–548.
35. Davis AS, Hertza J, Williams RN, Gupta AS, Ohly JG:The influence of corrected visual acuity on visual attention and incidental learning in patients with multiple sclerosis.Appl Neuropsychol2009,16:165–168. 36. Benedict RHB, Fischer JS, Archibald CJ, Arnett PA, Beatty WW, Bobholz J,
Weinstein A, DeLuca J, Rao SM, Munschauer F:Minimal
neuropsychological assessment of MS patients: a consensus approach.
Clin Neuropsychol2002,16:381–397.
37. Feaster HT, Bruce JM:Visual acuity is associated with performance on visual and non-visual neuropsychological tests in multiple sclerosis.Clin Neuropsychol2011,25:640–651.
38. Toledo J, Sepulcre J, Salinas-Alaman A, García-Layana A, Murie-Fernandez M, Bejarano B, Villoslada P:Retinal nerve fiber layer atrophy is associated with physical and cognitive disability in multiple sclerosis.Mult Scler
2008,14:906–912.
39. Genova HM, Hillary FG, Wylie G, Rypma B, Deluca J:Examination of processing speed deficits in multiple sclerosis using functional magnetic resonance imaging.J Int Neuropsychol Soc2009,15:383–393.
40. Leavitt VM, Wylie G, Genova HM, Chiaravalloti ND, DeLuca J:Altered effective connectivity during performance of an information processing speed task in multiple sclerosis.Mult Scler2012,18:409–417.
41. Urbanek C, Weinges-Evers N, Bellmann-Strobl J, Bock M, Dörr J, Hahn E, Neuhaus AH, Opgen-Rhein C, Ta TMT, Herges K, Pfueller CF, Radbruch H, Wernecke KD, Ohlraun S, Zipp F, Dettling M, Paul F:Attention Network Test reveals alerting network dysfunction in multiple sclerosis.Mult Scler2010, 16:93–99.
42. Motoyoshi I:Attentional modulation of temporal contrast sensitivity in human vision.PLoS ONE2011,6:e19303.
43. Pfueller CF, Brandt AU, Schubert F, Bock M, Walaszek B, Waiczies H, Schwenteck T, Dörr J, Bellmann-Strobl J, Mohr C, Weinges-Evers N, Ittermann B, Wuerfel JT, Paul F:Metabolic changes in the visual cortex are linked to retinal nerve fiber layer thinning in multiple sclerosis.PLoS ONE2011,6:e18019.
44. Reich DSSS:Damage to the optic radiation in multiple sclerosis is associated with retinal injury and visual disability.Arch Neurol2009, 66:998–1006.
45. Hornabrook RS, Miller DH, Newton MR, MacManus DG, du Boulay GH, Halliday AM, McDonald WI:Frequent involvement of the optic radiation in patients with acute isolated optic neuritis.Neurology1992,42:77–79. 46. Parisi V, Manni G, Spadaro M, Colacino G, Restuccia R, Marchi S, Bucci MG,
Pierelli F:Correlation between morphological and functional retinal impairment in multiple sclerosis patients.IOVS1999,40:2520–2527. 47. Heesen C, Böhm J, Reich C, Kasper J, Goebel M, Gold SM:Patient
perception of bodily functions in multiple sclerosis: gait and visual function are the most valuable.Mult Scler2008,14:988–991.
48. Flachenecker P, Meissner H:Fatigue in multiple sclerosis presenting as acute relapse: subjective and objective assessment.Mult Scler2008,14:274–277. 49. Balcer LJ, Galetta SL, Calabresi PA, Confavreux C, Giovannoni G, Havrdova E,
Hutchinson M, Kappos L, Lublin FD, Miller DH, O’Connor PW, Phillips JT, Polman CH, Radue E-W, Rudick RA, Stuart WH, Wajgt A, Weinstock-Guttman B, Wynn DR, Lynn F, Panzara MA:Natalizumab reduces visual loss in patients with relapsing multiple sclerosis.Neurology2007,68:1299–1304.
doi:10.1186/1471-2377-13-167
Cite this article as:Wiederet al.:Low contrast visual acuity testing is associated with cognitive performance in multiple sclerosis: a cross-sectional pilot study.BMC Neurology201313:167.
Submit your next manuscript to BioMed Central and take full advantage of:
• Convenient online submission
• Thorough peer review
• No space constraints or color figure charges
• Immediate publication on acceptance
• Inclusion in PubMed, CAS, Scopus and Google Scholar
• Research which is freely available for redistribution