The health of Hunter Valley communities
in proximity to coal mining and power generation,
general practice data, 1998
–
2010
Tony D. Merritt
A,D, Michelle A. Cretikos
B,
Wayne Smith
Cand David N. Durrheim
A AHunter New England Population Health B
Centre for Epidemiology and Evidence, NSW Ministry of Health C
Environmental Health Branch, Health Protection NSW D
Corresponding author. Email: [email protected]. gov.au
Abstract: Aim:An analysis of general practice data for rural communities in close proximity to coal mining and coal-fired power generation in the Hunter Valley region of NSW was conducted to
identify unusual patterns of illness.Methods:
Bet-tering the Evaluation and Care of Health general practice consultation data from the Hunter Valley region for 1998–2010 were compared with data
from all other rural NSW residents.Results:There
were no significantly higher rates of problems managed or medications prescribed for Hunter Valley region residents compared with the rest of rural NSW. Rates of respiratory problem manage-ment in the Hunter Valley region did not change significantly over time, while for all other rural NSW areas these rates significantly decreased. Conclusion:There was no evidence of significantly elevated health issues for residents in the Hunter Valley region of NSW. The diverging trend for respiratory problem management over time is wor-thy of further exploration.
Coal mining has the potential to impact on the health of nearby residents but there are limited Australian data
avail-able.1,2The rural communities of Singleton, Muswellbrook
and Denman are situated in close proximity to extensive and expanding coal mining and coal-fired power generation activities in the Hunter Valley region of New South Wales (NSW). Raw coal production from open cut coal mines in NSW increased by 81% over the period 1999–2011, with the Hunter Valley region accounting for 76% of all open-cut coal production in NSW in 2011 (unpublished data, Coal Services Pty Ltd, 2012).
In response to health concerns raised by the community, NSW Health reviewed existing health data for the region. Patterns of NSW emergency department presentations and hospital admissions, as well as mortality, cancer incidence and self-reported health survey data for these areas were compared with other parts of NSW and an analysis
published in May 2010.3 Some regions with exposure to
open-cut coal mining and power generation were shown to have higher rates of emergency department attendance for asthma and respiratory disease, and higher rates of hospital admission for asthma, respiratory conditions and cardio-vascular disease. There was ongoing community concern that hospital data only represented severe disease.
A complementary analysis of general practice data was conducted to determine whether there were any indications of excessive or unusual patterns of illness in these communi-ties which may not have been detected by the May 2010 study.
Methods
Data were obtained from the Bettering the Evaluation and
Care of Health (BEACH) program.4The BEACH program
collects data from approximately 1000 general practitioners
Vol. 24(2) 2013
ISSN 1034 7674
NSW PUBLIC HEALTH
BULLETIN
(GPs) randomly selected from across Australia each year. Each GP contributes details of 100 consecutive patient encounters, including the problems managed and treat-ment provided. Additional health data are collected on sub-samples of these encounters.
Problems managed are classified using the International
Classification of Primary Care, version 2 (ICPC-2).5This
classification system groups health problems into problem chapters and components, and medications into groups and sub-groups.
BEACH GP consultation data for residents of Singleton, Muswellbrook and Denman were compared with data for all other rural (non-metropolitan) NSW residents for three time periods: 1998–2004 and 2005–2010 inclusive, and for both time periods combined. Additionally, data for residents of Singleton, Muswellbrook and Denman for the period 2005– 2010 were compared with data from the 1998–2004 period. This represented all available BEACH data for this region.
Patient postcode of residence was used to define their location. The communities of Singleton (postcode 2330), Muswellbrook (postcode 2333) and Denman (postcode 2328) were combined as the communities of interest in the Hunter Valley region for the purposes of this paper. Rural NSW was defined using the Australian Standard
Geographic Classification (ARIAþ) system of the
Austra-lian Bureau of Statistics.6
For each of the three time periods, the analyses included a crude analysis, with adjustment for clustering at GP level, and weighted analysis, which included individual-level adjustment for:
• patient sex and age group (0–14, 15–64, and 65 years and over)
• patient’s Health Care Card status
• season of encounter date, using four season categories.
Health Care Card status was used as a proxy for socio-economic status but Veterans’ Card status was not avail-able. The weighting procedure used all other rural NSW postcodes, excluding Singleton, Muswellbrook and Denman, as the reference population.
All direct encounters with a GP for both new and existing problems managed were included. The analysis examined the problems managed as recorded by the GP, presented as a rate per 100 encounters, with 95% confidence intervals (CI), for all conditions and diagnostic chapter headings. The analysis also examined the medications prescribed or supplied by the GP per 100 problems managed, with 95% CIs, presented by medication group and sub-group. The medication analysis used problems managed for the denominator because more than one problem could be managed per encounter and the number of problems managed per encounter increased over time. All CI calcu-lations accounted for the clustered sample design.
All available BEACH data were considered. Respiratory and cardiovascular disease, malignancy and mental health issues were of particular interest on the basis of known potential impacts from particulate pollution and local community concerns.
Differences between the Hunter Valley region and rural NSW (excluding the Hunter Valley region) were consid-ered significant when there was no overlap of the 95% CIs between the regions. The clustered sample design and nature of the data prevented further significance testing.
Spearman’s rank correlation test was used to detect differences in the ranking of rates of problems managed and medications prescribed between the weighted Hunter Valley region data and the comparison rural NSW data.
Ap,0.05 was used to reject the null hypothesis (that the
rank orders were independent) and indicated that there was no significant difference in the ranking of problems managed or medications prescribed between the two groups.
Individual-level smoking status was not available for all GP encounters, and therefore could not be used to adjust results at individual level. Instead, the sub-sample of BEACH encounters with smoking status information (approximately 33% of encounters) was used to estimate the prevalence of current, previous and never smoked status for residents in the Hunter Valley region and in the rest of rural NSW for the time periods of interest.
The number of different GPs and general practices in the Hunter Valley region that contributed BEACH data during 1998–2010 was examined, as was the proportion of encounters provided by each participating GP.
Ethics approval was not required for this review. The BEACH program provided aggregate de-identified data.
Results
Patient characteristics
During the period April 1998–July 2010, the BEACH survey program included records of 2286 encounters and 3448 problems managed for Hunter Valley region resi-dents. No BEACH data were available for this region prior to 1998. The unweighted Hunter Valley region sample had more patients in the 0–15 and 15–64-year age groups, and fewer Health Care Card holders than the comparison rural
NSW sample (Table 1).
Eighteen different GPs from seven general practices con-tributed data in the Hunter Valley region. The median proportion of encounters with Hunter Valley region resi-dents provided by each GP was 3.9% (range: 1.3–11.4%). Ninety-one percent of consultations for Hunter Valley region residents occurred in the Hunter region.
There were 89 614 encounters and 140 645 problems managed for residents in the remainder of rural NSW during this period.
Problems managed
When grouped by ICPC-2 chapter, no problem groups were managed at significantly higher rates in the Hunter
Valley region (Table 2). Social chapter problems were
managed at a significantly lower rate.
There was no significant difference in the ranking of
problem chapters (Spearman’s rho¼0.998,p,0.0001).
When the most frequently managed problems were com-pared, none were managed at significantly higher rates in the
Hunter Valley region (Table 3). The rate for general
check-ups was significantly lower in the Hunter Valley region.
There were no significant differences in management rates of asthma, acute or chronic respiratory tract conditions, depression or anxiety.
There were no significant differences in the ranking of all tabulated problems or for the top 10 problems managed
(Spearman’s rho¼0.86 (p,0.0001) and 0.71 (p,0.02)
respectively) (Table 3).
Medications prescribed or supplied
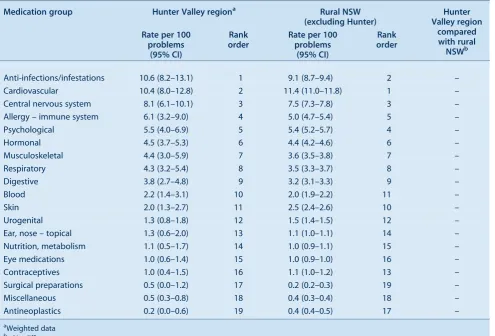
No medication groups were prescribed or supplied at significantly higher or lower rates in the Hunter Valley
region (Table 4).
The rank order was very similar for the two groups
(Spearman’s rho¼0.98,p,0.0001,Table 4).
Similarly, no medication subgroups were prescribed or supplied at significantly higher or lower rates in the Hunter Valley region (e.g. bronchodilators, asthma preventives, anti-anxiety and antidepressant medicines). The rank order
was similar for the two groups (Spearman’s rho¼0.95,
p,0.0001) (Table 5).
Smoking
In the sub-sample (n¼743) with smoking data recorded, a
significantly higher proportion of people had never smoked and a significantly lower proportion of people were previous smokers in the Hunter Valley region than in
rural NSW (n¼30 171). The prevalence of current
smok-ing was not significantly different (Table 6).
Additional analysis by time period
In addition to the analysis of aggregated data for the period 1998–2010, data were considered separately for the time periods April 1998–March 2004 and April 2004–June 2010. Comparison of Hunter Valley region weighted data with rural NSW for each period separately did not identify any information that differed substantially from the analy-sis presented for the combined period.
When weighted Hunter Valley region data for the two periods were compared, the only significant increase over time was in the rate of management of benign/uncertain
Table 1. Patient characteristics and season of encounter, Hunter Valley region and rural NSW, 1998]2010
Patient variable Hunter Valley
region % of encounters
Rural NSW (excluding Hunter)
% of encounters
Sex Female 63.2 58.4
Male 36.4 41.1
Missing 0.4 0.6
Age group (years) 0–15 14.5 11.3
15–64 61.6 57.1
65þ 23.3 30.9
Missing 0.6 0.8
HCC HCC holder 35.4 48.7
Non-HCC holder 53.8 44.7
Missing 10.8 6.7
Season Jan–Mar 25.6 24.3
Apr–Jun 29.6 27.8
Jul–Sep 15.9 26.0
Oct–Dec 28.8 21.9
HCC: Health Care Card
Source: Bettering the Evaluation and Care of Health program.
neoplasms and malignant neoplasms, an increase that was also seen over this time period in the remainder of rural NSW.
The rate of management of respiratory chapter problems in the Hunter Valley region did not change significantly over time. By comparison, the rate for the respiratory chapter problem group was significantly lower during the later
period in the remainder of rural NSW (Table 7).
Discussion
Community members in the Hunter Valley region have expressed a broad range of health concerns, particularly in relation to perceived negative impacts of industrial activity, coal mining and power generation on respiratory and mental health.
Our analysis of general practice data found no evidence of significantly higher rates of any particular problems man-aged or medications prescribed or supplied for Hunter Valley region residents compared with the rest of rural NSW during the period 1998–2010.
Consistent with this, when rates of problems and medica-tions were ranked, all rank tests were highly correlated
(rho.0.85) except for the top 10 problems managed,
which were moderately correlated (rho¼0.71). All tests
of independence of ranking between the weighted Hunter
Valley region and rural NSW data were rejected, indicating no significant difference in ranking between these regions.
If the Hunter Valley region sample had been larger it is possible that significant differences in rates of management between the two regions may have been identified. However, the analysis included 12 years of data from the BEACH program, which were all the data available at the time of the analysis, and represents the only source of data for general practice activity in NSW available for this purpose.
The nature of the BEACH data constrains the statistical options available for further comparison of these groups. Identification of differences relied on the comparison of confidence intervals that take account of the clustering inherent in the data sample and the nature of the underlying
data. The rates presented inTables 2–5 and 7, for example,
cannot be considered as proportions, as one encounter or problem can contribute multiple counts within the specific rate under consideration.
It is of interest that comparison of the management rates of respiratory problems (as a group) during the period 2005–2010 with those for 1998–2004 demonstrated no significant change in the Hunter Valley region despite a significant decrease for the remainder of rural NSW over this period. Again, if the Hunter Valley region sample were larger, a significant difference may have been identified.
Table 2. Rate of problems managed by ICPC-2 chapter and rank order, Hunter Valley region and rural NSW patients, 1998]2010
Problem managed Hunter Valley regiona Rural NSW
(excluding Hunter)
Hunter Valley region compared with rural
NSWb Rate per 100
encounters (95% CI)
Rank order
Rate per 100 encounters
(95% CI)
Rank order
Musculoskeletal 21.3 (18.7–23.9) 1 19.2 (18.7–19.6) 2 –
Circulatory 19.2 (16.6–21.7) 2 20.0 (19.3–20.6) 1 –
Respiratory 17.8 (14.7–20.9) 3 19.2 (18.6–19.7) 3 –
Skin 15.1 (12.8–17.5) 4 17.9 (17.4–18.5) 4 –
General and unspecified 13.6 (9.9–17.3) 5 16.1 (15.5–16.6) 5 –
Endocrine and metabolic 12.6 (9.0–16.2) 6 12.3 (11.9–12.7) 6 –
Psychological 11.7 (9.3–14.1) 7 12.0 (11.5–12.5) 7 –
Digestive 10.7 (8.7–12.7) 8 10.6 (10.3–10.9) 8 –
Female genital system 7.8 (5.0–10.6) 9 6.7 (6.3–7.1) 9 –
Pregnancy and family planning 6.7 (4.1–9.2) 10 5.0 (4.6–5.3) 10 –
Neurological 4.8 (3.0–6.6) 11 4.0 (3.9–4.2) 11 –
Ear 3.7 (2.7–4.6) 12 3.9 (3.8–4.1) 12 –
Urological 2.8 (2.0–3.7) 13 3.3 (3.1–3.4) 13 –
Blood 2.2 (1.1–3.3) 14 2.4 (2.3–2.5) 14 –
Eye 1.9 (1.3–2.4) 15 1.8 (1.7–1.9) 15 –
Male genital system 1.5 (0.8–2.1) 16 1.8 (1.7–1.9) 16 –
Social 0.4 (0.1–0.6) 17 0.8 (0.8–0.9) 17 k
aWeighted data b
kSignificantly lower; – No difference
Source: Bettering the Evaluation and Care of Health program.
Table 3. Rate of problems managed by component and rank order, Hunter Valley region and rural NSW patients, 1998]2010
Problem managed Hunter Valley regiona Rural NSW
(excluding Hunter)
Hunter Valley region compared
with rural NSWb Rate per 100
encounters (95% CI)
Rank order
Rate per 100 encounters
(95% CI)
Rank order
Hypertensionc 8.8 (7.1–10.5) 1 10.4 (10.0–10.8) 1 –
Arthritis – allc 6.4 (4.7–8.2) 2 4.6 (4.3–4.8) 2 –
Osteoarthritisc 5.0 (3.3–6.8) 3 3.1 (2.9–3.3) 7 –
Depressionc 4.3 (3.2–5.3) 4 4.3 (4.1–4.5) 3 –
Asthma 3.3 (2.3–4.3) 5 2.6 (2.4–2.7) 10 –
Diabetes – non-gestationalc 3.2 (2.1–4.2) 6 3.7 (3.5–3.8) 4 –
Lipid disordersc 3.2 (1.8–4.5) 7 3.2 (3.0–3.4) 6 –
Oesophageal disease 3.2 (1.8–4.5) 8 2.5 (2.4–2.7) 13 –
Preventive immunisation/medication – NOS 3.0 (1.3–4.7) 9 2.9 (2.5–3.3) 9 –
Back complaintc 2.8 (1.8–3.7) 10 3.1 (3.0–3.3) 8 –
Upper respiratory infection – acute 2.7 (1.9–3.5) 11 3.7 (3.5–4.0) 5 –
Acute bronchitis/bronchiolitis 2.3 (1.2–3.4) 12 2.6 (2.4–2.8) 11 –
Female genital check-upc 2.2 (1.2–3.3) 13 2.2 (2.0–2.4) 14 –
Sinusitis – acute/chronic 2.1 (0.8–3.4) 14 1.3 (1.2–1.4) 25 –
Pregnancyc 2.0 (0.7–3.2) 15 1.4 (1.2–1.5) 23 –
Menopausal symptom/complaint 1.9 (1.0–2.8) 16 1.2 (1.1–1.3) 27 –
Pre/postnatal check-upc 1.9 (0.6–3.1) 17 1.2 (1.0–1.4) 28 –
Solar keratosis/sunburn 1.8 (0.9–2.8) 18 1.9 (1.6–2.2) 16 –
Anxietyc 1.7 (1.0–2.5) 19 1.6 (1.4–1.7) 17 –
Cardiac check-upc 1.6 (0.0–3.4) 20 1.2 (1.1–1.3) 29 –
Tonsillitisc 1.6 (0.5–2.7) 21 0.9 (0.8–1.0) 40 –
General check-upc 1.6 (0.9–2.4) 22 2.6 (2.5–2.8) 12 k
Sprain/strainc 1.5 (0.6–2.4) 23 1.3 (1.2–1.4) 26 –
Preventive immunisation/medication – respiratory 1.5 (0.3–2.7) 24 2.1 (1.9–2.2) 15 –
Hypothyroidism/myxoedema 1.5 (0.3–2.8) 25 0.7 (0.6–0.8) 48 –
Acute otitis media/myringitis 1.4 (0.8–1.9) 26 1.1 (1.1–1.2) 32 –
Ischaemic heart diseasec 1.3 (0.7–1.9) 27 1.6 (1.5–1.7) 18 –
Malignant neoplasm of skin 1.3 (0.4–2.2) 28 1.6 (1.4–1.7) 19 –
Dermatitis – contact/allergic 1.3 (0.8–1.7) 29 1.5 (1.4–1.6) 21 –
Sleep disturbance 1.3 (0.4–2.2) 30 1.5 (1.4–1.6) 22 –
Injury – musculoskeletal NOS 1.1 (0.2–2.0) 31 1.0 (0.9–1.0) 34 –
Chronic obstructive pulmonary disease 1.1 (0.5–1.7) 32 1.1 (1.0–1.1) 33 –
Anaemiac 1.1 (0.1–2.0) 33 0.7 (0.7–0.8) 49 –
Elevated blood pressure 1.0 (0.0–2.0) 34 0.2 (0.2–0.3) 56 –
Arthritisc 1.0 (0.3–1.7) 35 0.8 (0.7–0.9) 42 –
Fracturec 1.0 (0.5–1.5) 36 1.2 (1.1–1.2) 30 –
Osteoporosis 1.0 (0.5–1.5) 37 0.9 (0.8–0.9) 41 –
Abnormal result – investigation NOS 1.0 (0.1–1.8) 38 0.8 (0.7–0.8) 43 –
Oral contraceptionc 1.0 (0.5–1.5) 39 1.0 (0.9–1.0) 35 –
Urinary tract infectionc 1.0 (0.5–1.5) 40 1.6 (1.5–1.7) 20 –
Heart failure 0.9 (0.4–1.4) 41 1.0 (0.9–1.1) 36 –
Chronic ulcer – skin 0.9 (0.3–1.5) 42 0.7 (0.6–0.7) 50 –
Atrial fibrillation/flutter 0.8 (0.3–1.3) 43 1.2 (1.0–1.3) 31 –
Laceration/cut 0.8 (0.3–1.2) 44 0.8 (0.7–0.8) 44 –
Dermatophytosis 0.8 (0.3–1.3) 45 0.5 (0.5–0.6) 53 –
Skin check-upc 0.8 (0.2–1.5) 46 0.5 (0.4–0.6) 54 –
A recent review of emergency department data found higher rates for asthma and respiratory disease presenta-tions in this region when compared with Sydney residents, however higher rates were also noted for a number of rural communities with no potential mining or power generation
exposures.3 A number of these communities have been
affected by drought and the contribution of agricultural activity, meteorological conditions and wood-smoke have
all been implicated.7
There were no significant differences in management rates of mental health conditions in the Hunter Valley region
Table 4. Rate of medication group prescription or supply and rank order, Hunter Valley region and rural NSW patients, 1998]2010
Medication group Hunter Valley regiona Rural NSW
(excluding Hunter)
Hunter Valley region
compared with rural NSWb Rate per 100
problems (95% CI)
Rank order
Rate per 100 problems
(95% CI)
Rank order
Anti-infections/infestations 10.6 (8.2–13.1) 1 9.1 (8.7–9.4) 2 –
Cardiovascular 10.4 (8.0–12.8) 2 11.4 (11.0–11.8) 1 –
Central nervous system 8.1 (6.1–10.1) 3 7.5 (7.3–7.8) 3 –
Allergy – immune system 6.1 (3.2–9.0) 4 5.0 (4.7–5.4) 5 –
Psychological 5.5 (4.0–6.9) 5 5.4 (5.2–5.7) 4 –
Hormonal 4.5 (3.7–5.3) 6 4.4 (4.2–4.6) 6 –
Musculoskeletal 4.4 (3.0–5.9) 7 3.6 (3.5–3.8) 7 –
Respiratory 4.3 (3.2–5.4) 8 3.5 (3.3–3.7) 8 –
Digestive 3.8 (2.7–4.8) 9 3.2 (3.1–3.3) 9 –
Blood 2.2 (1.4–3.1) 10 2.0 (1.9–2.2) 11 –
Skin 2.0 (1.3–2.7) 11 2.5 (2.4–2.6) 10 –
Urogenital 1.3 (0.8–1.8) 12 1.5 (1.4–1.5) 12 –
Ear, nose – topical 1.3 (0.6–2.0) 13 1.1 (1.0–1.1) 14 –
Nutrition, metabolism 1.1 (0.5–1.7) 14 1.0 (0.9–1.1) 15 –
Eye medications 1.0 (0.6–1.4) 15 1.0 (0.9–1.0) 16 –
Contraceptives 1.0 (0.4–1.5) 16 1.1 (1.0–1.2) 13 –
Surgical preparations 0.5 (0.0–1.2) 17 0.2 (0.2–0.3) 19 –
Miscellaneous 0.5 (0.3–0.8) 18 0.4 (0.3–0.4) 18 –
Antineoplastics 0.2 (0.0–0.6) 19 0.4 (0.4–0.5) 17 –
a
Weighted data
b
– No difference
Source: Bettering the Evaluation and Care of Health program.
Table 3. (Continued)
Problem managed Hunter Valley regiona Rural NSW
(excluding Hunter)
Hunter Valley region compared
with rural NSWb Rate per 100
encounters (95% CI)
Rank order
Rate per 100 encounters
(95% CI)
Rank order
Viral disease – other/NOS 0.8 (0.3–1.4) 47 0.8 (0.7–0.9) 45 –
Vitamin/nutritional deficiency 0.8 (0.3–1.3) 48 0.6 (0.5–0.7) 52 –
Gastroenteritisc 0.8 (0.4–1.2) 49 1.0 (0.9–1.1) 37 –
Constipation 0.8 (0.4–1.2) 50 0.5 (0.4–0.5) 55 –
Otitis externa 0.8 (0.2–1.4) 51 0.7 (0.6–0.7) 51 –
Bursitis/tendonitis/synovitis NOS 0.7 (0.3–1.1) 52 1.0 (0.9–1.1) 38 –
Obesity (BMI.30) 0.7 (0.0–1.5) 53 0.8 (0.7–0.9) 46 –
NOS: not otherwise specified
aWeighted data b
kSignificantly lower; – No difference
cIncludes multiple ICPC-2 codes
Source: Bettering the Evaluation and Care of Health program.
compared with the rest of rural NSW. Management rates of depression and anxiety were not higher, nor were prescrip-tion rates of antidepressants.
It was not possible to adjust for the influence of smoking at individual level during the analysis as this information was only available for 33% of patients. However, smoking prevalence is unlikely to explain any relative increase in the rate of respiratory disease managed in the Hunter Valley region as there was a significantly higher preva-lence of adults who had never smoked and significantly fewer adults who were previous smokers compared with the rest of rural NSW.
We note a number of limitations of the data used for this analysis. The Hunter Valley region sample had a higher proportion of younger patients and fewer Health Care Card holders than the comparison group. These differences were accounted for in the weighting applied to the Hunter Valley region data used in the analysis. The lower rate of general check-ups for Hunter Valley region patients potentially reflects differences in health care utilisation. We are not aware of any other likely systematic differences between these groups.
The BEACH data used in this analysis necessarily rely on a sample of patient encounters from a sample of randomly
Table 5. Rate of medication subgroup prescription or supply and rank order, Hunter Valley region and rural NSW patients, 1998]2010
Medication subgroup Hunter Valley regiona Rural NSW (excluding Hunter)
Hunter Valley region
compared with rural
NSWb
Rate per 100 problems
(95% CI)
Rank order
Rate per 100 problems
(95% CI)
Rank order
Immunisation 6.0 (3.1–8.8) 1 4.7 (4.3–5.0) 2 –
Antihypertensives 5.8 (4.4–7.3) 2 6.4 (6.1–6.6) 1 –
NSAIDs 3.9 (2.5–5.4) 3 2.9 (2.8–3.1) 4 –
Penicillins/cephalosporins 3.9 (2.6–5.2) 4 2.8 (2.7–2.9) 5 –
Broad spectrum penicillins 3.1 (2.0–4.2) 5 2.9 (2.8–3.1) 3 –
Antiulcerants 2.8 (1.8–3.8) 6 2.2 (2.1–2.3) 7 –
Other antibiotics 2.5 (1.6–3.5) 7 1.9 (1.8–2.0) 11 –
Antidepressants 2.5 (2.0–3.1) 8 2.5 (2.4–2.6) 6 –
Simple analgesics 2.4 (1.6–3.2) 9 2.1 (2.0–2.2) 9 –
Compound analgesics 2.3 (1.6–3.0) 10 1.8 (1.7–1.9) 12 –
Narcotic analgesics 2.3 (1.2–3.3) 11 2.1 (2.0–2.2) 10 –
Bronchodilators/spasm relaxants 2.1 (1.3–2.8) 12 1.8 (1.7–1.9) 13 –
Other cardiovascular system 2.0 (1.3–2.8) 13 2.2 (2.1–2.3) 8 –
Asthma preventives 1.9 (1.4–2.5) 14 1.4 (1.3–1.5) 16 –
Sex/anabolic hormones 1.6 (0.9–2.3) 15 1.2 (1.1–1.2) 21 –
Anti-anxiety 1.6 (0.9–2.2) 16 1.3 (1.2–1.4) 19 –
Other blood drugs 1.5 (0.7–2.3) 17 1.4 (1.3–1.5) 18 –
Corticosteroids 1.3 (0.9–1.7) 18 1.2 (1.1–1.2) 20 –
Beta-blockers 1.2 (0.8–1.7) 19 1.4 (1.3–1.5) 17 –
Topical steroids 1.2 (0.7–1.7) 20 1.5 (1.4–1.6) 15 –
Hypoglycaemics 1.1 (0.6–1.6) 21 1.6 (1.4–1.7) 14 –
Sedatives/hypnotics 1.0 (0.4–1.6) 22 1.1 (1.0–1.2) 22 –
Diuretics 0.9 (0.5–1.4) 23 0.9 (0.9–1.0) 24 –
Contraceptives oral/systemic 0.9 (0.4–1.4) 24 1.1 (1.0–1.1) 23 –
Antiemetics/antinauseants 0.9 (0.5–1.3) 25 0.9 (0.8–0.9) 25 –
Anti-infectives – eye 0.8 (0.5–1.0) 26 0.6 (0.5–0.6) 29 –
Topical otic 0.7 (0.4–1.1) 27 0.5 (0.5–0.6) 30 –
Antiangina 0.7 (0.3–1.1) 28 0.8 (0.7–0.8) 26 –
Haemopoietics 0.7 (0.4–1.0) 29 0.6 (0.6–0.7) 27 –
Tetracyclines 0.6 (0.4–0.9) 30 0.6 (0.5–0.6) 28 –
NSAIDs: non-steroidal anti-inflammatory drugs
a
Weighted data
b
– No difference
Source: Bettering the Evaluation and Care of Health program.
selected GPs. However, the inclusion of data from 18 GPs representing seven practices suggests the Hunter Valley region data should not be unduly influenced by different diagnostic and prescribing practices of individual partici-pating GPs.
Conclusion
There was no evidence of a significant difference in problems managed or medications prescribed by GPs for residents of communities potentially affected by heavy industrial activity (coal mining and power generation) in the Hunter Valley region of NSW compared with residents in the remainder of rural NSW during the period 1998– 2010. The diverging trend for respiratory problem man-agement over time is worthy of further exploration.
Acknowledgments
We thank Helena Britt for her assistance in obtaining the BEACH data used in this analysis and for reviewing the draft manuscript. The BEACH program is conducted by and the data were analysed by the Family Medicine Research Centre, The University of Sydney.
During the data years reported in this paper, the BEACH program was funded by financial contributions from: The Australian Government Department of Health and Ageing; AstraZeneca Pty Ltd (Australia); Janssen-Cilag Pty Ltd; Merck, Sharp and Dohme (Australia) Pty Ltd; Pfizer Australia; Abbott Australasia Pty Ltd; Sanofi-Aventis Australia Pty Ltd; Wyeth Australia Pty Ltd (2008–2010); Novartis Pharmaceu-ticals Australia Pty Ltd; GlaxoSmithKline Australia Pty Ltd; National Prescribing Service Ltd; Roche Products Pty Ltd; Aventis Pharma Pty Ltd; Australian Government Department of Veterans’ Affairs;
National Occupational Health and Safety Commission; The Office of the Australian Safety and Compensation Council; and the Department of Employment and Workplace Relations.
References
1. Castledon WM, Shearman D, Crisp G, Finch P. The mining and
burning of coal: effects on health and environment.MJA2011;
195: 333–5.
2. Higginbotham N, Freeman S, Connor L, Albrecht G. Environ-mental injustice and air pollution in coal affected communities,
Hunter Valley, Australia.Health Place2010; 16(2): 259–66.
doi:10.1016/j.healthplace.2009.10.007
3. NSW Department of Health. Respiratory and cardiovascular diseases and cancer among residents in the Hunter New England Area Health Service. Available at: http://www.health.nsw.gov. au/pubs/2010/hne_respi_cardio.html (Cited 5 September 2012).
4. Britt H, Miller GC, Charles J, Henderson J, Bayram C, Pan Y et al. General practice activity in Australia 2009–10. General practice series no 27. Cat. No. GEP 27. Canberra: Australian Institute of Health and Welfare; 2010.
5. Classification Committee of the World Organisation of Family Doctors. ICPC-2. International Classification of Primary Care. 2nd ed. Oxford: Oxford University Press; 1998.
6. Australian Bureau of Statistics. Census Paper 03/01. ASGC Remoteness Classification: Purpose and Use. Available at: http://www.abs.gov.au/websitedbs/d3110122.nsf/0/ f9c96fb635cce780ca256d420005dc02/$FILE/Remoteness_ Paper_text_final.pdf (Cited 5 September 2012).
7. Centre for Inland Health. Particulate matter and air pollution in a NSW regional centre: A review of the literature and opportu-nities for action. Wagga Wagga: Charles Sturt University; 2011.
Table 7. Rate of respiratory chapter problems managed by time period, Hunter Valley and rural NSW patients, 1998]2010
Location April 1998]March 2004 April 2004]June 2010 Change over timeb Rate per 100 encounters
(95% CI)
Rate per 100 encounters (95% CI)
Hunter Valley regiona 15.9 (12.2–19.5) 20.9 (16.1–25.8) –
Rural NSW (excluding Hunter) 20.2 (19.4–21.1) 18.1 (17.3–18.9) k
a
Weighted data
b
kSignificantly lower; – No difference
Source: Bettering the Evaluation and Care of Health program.
Table 6. Smoking status for sub-sample of adults (aged 18 years and over), Hunter Valley region and rural NSW patients, 1998]2010
Smoking status Hunter Valley regiona (n5743)
Percent (95% CI)
Rural NSW (excluding Hunter)
(n530 717) Percent (95% CI)
Hunter Valley region compared
with rural NSWb
Never smoked 58.3 (52.5–64.1) 47.2 (46.4–48.1) m
Previous smoker 24 (19.6–28.5) 31 (30.2–31.7) k
Current smoker 17.7 (13.8–21.5) 21.8 (21.0–22.5) –
a
Weighted data
b
mSignificantly higher;kSignificantly lower; – No difference Source: Bettering the Evaluation and Care of Health program.
Are pregnancy outcomes associated
with risk factor reporting in routinely
collected perinatal data?
Amanda J. Ampt
A,C, Jane B. Ford
A,
Lee K. Taylor
Band Christine L. Roberts
A AKolling Institute of Medical Research, The University of Sydney
BCentre for Epidemiology and Evidence, NSW Ministry of Health
C
Corresponding author. Email: [email protected]
Abstract: Aim:To assess reporting characteris-tics of commonly dichotomised pregnancy
out-comes (e.g. preterm/term birth); and to
investigate whether behaviours (e.g. smoking), medical conditions (e.g. diabetes) or interven-tions (e.g. induction) were reported differently
by pregnancy outcomes. Methods: Further
analysis of a previous validation study was undertaken, in which 1680 perinatal records were compared with data extracted from medical records. Continuous and polytomous variables were dichotomised, and risk factor reporting was assessed within the dichotomised outcome groups. Agreement, kappa, sensitivity and posi-tive predicposi-tive value calculations were
under-taken. Results: Gestational age, birthweight,
Apgar scores, perineal trauma, regional anal-gesia and baby discharge status (live birth/ stillbirth) were reported with high accuracy and reliability when dichotomised (kappa values 0.95–1.00, sensitivities 94.7–100.0%). Although not statistically significant, there were trends for hypertension, infant resuscitation and instru-mental birth to be more accurately reported among births with adverse outcomes. In contrast, smoking ascertainment tended to be poorer among preterm births and when babies were
,2500 g. Conclusion:Dichotomising variables
collected as continuous or polytomous variables in birth data results in accurate and well ascer-tained data items. There is no evidence of sys-tematic differential reporting of risk factors.
Population level data are well suited to studies evaluating health care. With the risk of sampling bias removed, estimation of incidence and prevalence rates can be made, allowing for description of the total burden of a particular disease or outcome, analysis of risk factors and trends, as well as identification of health inequalities and estimation
of health costs.1,2Accurate conclusions from such analyses
rely on high quality data that truly represent the population experience. Assessment of data quality (completeness and accuracy) is typically undertaken by a validation study, in which data from a sample of records from the population dataset are compared to a highly reliable and accurate source of data (‘the gold standard’) for the corresponding records. The accuracy and reliability of individual data
items are typically reported.3,4
The variables in perinatal population data can be continu-ous (e.g. gestational age), nominal (e.g. mode of delivery) and ordinal (e.g. first, second, third or fourth degree perineal tears), with validation of such variables typically reporting percent agreement and kappa statistics. These types of variables are frequently dichotomised in analyses (e.g. preterm birth, caesarean section, or third–fourth
degree tears),5,6but little assessment has been undertaken
into the accuracy and reliability of their dichotomised form.
Differential reporting in population health data occurs when a variable is reported with different accuracy and reliability amongst different strata of another variable. This can introduce systematic bias, leading to under or
over-estimation of risk factor effects.7 For example, if
smoking is more likely to be reported when an infant is growth restricted, this could result in the effect of smoking on growth restriction being over-estimated. Different accuracy and reliability statistics have been demonstrated for reporting of both pregnancy hypertension and
induc-tion depending on the mode of delivery,2,8and for
hyper-tension depending on the gestation.9However, we are only
aware of one other study that has investigated whether the occurrence of adverse infant or maternal outcomes might result in increased reporting of established risk factors for
these outcomes.9
investigate whether behaviours (e.g. smoking), medical conditions (e.g. diabetes) or interventions (e.g. induction) were reported differently by outcomes.
Methods
This study involved further analysis of data from a previ-ous validation study of the 1998 New South Wales (NSW) Perinatal Data Collection (PDC). The PDC (formerly known as the NSW Midwives Data Collection) is a population-based statutory surveillance system and serves as a primary source of information about pregnancy and
birth outcomes in NSW for all births$20 weeks gestation
or$400 g birthweight. The original study is described in
detail elsewhere.3 Briefly, randomly selected records
from the PDC (referred to as the ‘PDC sample’) were compared with ‘gold standard’ data extracted from the corresponding patient’s medical records (referred to as the ‘validation data’). The PDC sample comprised 1680 records representing 2% of the state’s births from 98 hospitals around NSW. Information from the medical records of the selected sample of women was extracted by experienced health managers without reference to informa-tion contained in the PDC sample. The data item with highest frequency of missing values was Apgar5, which was missing from six records in the PDC sample (0.36%), and from nine records in the validation data (0.54%).
We first assessed the accuracy and reliability of continuous and polytomous data items when examined as dichoto-mous outcomes. We chose data items that are commonly
dichotomised including: gestational age (,37 weeks
gestation, $37 weeks gestation); birthweight (,2500 g,
$2500 g; ,4000 g, $4000 g); Apgar score at 1 minute
(Apgar1,4, Apgar1 $4) and Apgar score at 5 minutes
(Apgar5,7, Apgar5 $7); epidural, caudal, pudendal or
spinal analgesia (regional analgesia yes/no); second, third or fourth degree tears and/or episiotomy (perineal trauma yes/no); and baby discharge status (stillbirth/live birth).
Next we examined potential differential reporting of risk factors by determining the accuracy and reliability of risk factor reporting in the PDC sample for different pregnancy outcomes. Specifically, we hypothesised that the following established risk factors may be more likely to be reported in the presence of an associated outcome:
• smoking when infants were small or preterm10
• maternal hypertension among preterm births11
• maternal diabetes when infants were large12
• instrumental birth (forceps or vacuum) among women
who experienced perineal trauma13
• induction among women who required regional
analgesia14
• infant resuscitation (intermittent positive pressure respiration, bag and mask or intubation, or external
cardiac massage and ventilation) when Apgar5,7.
Analysis
Using the validation data as the ‘gold standard’, the reliabil-ity and accuracy of PDC reporting was determined by calculating the sensitivity, specificity, positive predictive value (PPV), negative predictive value, percent agreement and Cohen’s kappa statistic. These reporting characteristics were determined first for the commonly dichotomised variables and then for risk factors in the hypothesised outcome strata. When a record was missing a data item, it was excluded from the relevant analysis. We assessed the homogeneity of risk factor reporting across the dichoto-mised outcome strata by the Breslow-Day test, with Zelan adjustment where cell counts were less than five.
All analyses included the associated 95% exact binomial confidence intervals. These are not presented in the tables, but are available from the authors on request. All analyses were undertaken using SAS (version 9.2, SAS Institute, Cary, NC, USA).
Results
Of the 1680 records in the original validation study, 1678 were available for analysis. Characteristics of the PDC
sample were representative of all births in NSW (Table 1).
Commonly dichotomised pregnancy outcomes (preterm birth, low and high birthweight, Apgar scores, perineal trauma, regional analgesia and stillbirth) as reported in the PDC had excellent levels of agreement, and high
levels of ascertainment (sensitivities.94%) and accuracy
(PPVs.96%) (Table 2).
The results of the investigation into differential reporting
are presented inTable 3. PPVs were high, with 11 of 14
individual analyses $90%, but with inconsistencies in
direction among outcome groups for each risk factor. There was more variability in the sensitivities, ranging from 66% for reporting of infant resuscitation amongst the
group whose Apgar5 was $7, to 99% for reporting of
inductions with no regional analgesia. In total, six out
of the 14 sensitivity measures were$90%. There was no
overall pattern suggestive of better reporting in the pres-ence of an adverse outcome. Although there was a trend to higher ascertainment of infant resuscitation among infants with low Apgar5 (sensitivities of 86% vs 66%), of instru-mental birth among women with perineal trauma (97% vs 88%), and of hypertension among preterm birth (77% vs 67%), the reverse was true for ascertainment of smoking both among preterm birth (82% vs 90%) and among small
infants,2500 g (83% vs 90%). There were no statistically
significant differences in reporting across strata, with
Breslow-Daypvalues all.0.05.
Discussion
This study demonstrated that dichotomising perinatal outcome data into categories that are typically reported
in population health research5,6resulted in high levels of ascertainment and accuracy. With all sensitivities
$94.7% and all PPVs$96.1%, reassurance is provided
for the use of these data items in their dichotomised form where necessary for comparison to other findings or due to sample size constraints. There was no evidence of overall systematic bias in risk factor reporting across one strata of outcome (the adverse group) compared to the other. This study adds new information on dichotomised reporting characteristics and differential reporting. Strengths of this study include the highly representative nature of the PDC sample, the use of six measures of accuracy and reliability, and the small percentage of missing data. Limitations included small numbers in some outcome strata. Lack of statistical significance may thus have been a result of under-powering for some categories.
Most risk factors were fairly well ascertained regardless of outcome strata, with the exception of hypertension and infant resuscitation among the groups that did not have an adverse outcome. Reliability, as measured by PPV, was lowest amongst diabetes reporting for the adverse group, but numbers were small. There was a non-significant trend towards higher ascertainment of hypertension, instrumental birth and infant resuscitation in the adverse groups. It is recognised that these trends could become significant with larger sample sizes, and may intro-duce biases in research.
The non-significant trends in differential reporting were not always in the hypothesised direction. Ascertainment for behaviour (smoking) was lower amongst the adverse outcome group, while ascertainment for some interventions (instrumental birth and infant resuscita-tion) and for hypertension was higher in the adverse outcome groups. This latter finding is consistent with another study that identified a trend towards increased ascertainment of hypertension among women who
delivered prematurely or suffered a morbidity.9 While
it might be expected that some risk factors which may be reported earlier in pregnancy (e.g. smoking, hyper-tension) may not have the same impact on reporting as risks occurring closer to delivery (e.g. induction, infant resuscitation), there were no differences in ascertain-ment or accuracy for these factors. Overall our findings demonstrate the randomness of reporting errors and no evidence of systematic bias due to differential reporting by outcome.
This study used data collected in 1998 as this was the last time the PDC was validated against medical records. Some changes to the recording of information are likely to have occurred with the advent of electronic systems, but the majority of PDC recording still occurs at the time of the birth admission, and hence accuracy of variables once dichotomised and of maternal or infant outcome risk factor reporting are unlikely to have been affected.
Table 1. Comparison of Perinatal Data Collection (PDC) sample with all NSW births, 1998
Characteristics Sample of PDC dataa
n (%)
NSW birthsb,c
n (%)
Labour onset
Spontaneous 1067 (63.6) 56 283 (65.2)
Induced 446 (26.6) 20 898 (24.2)
No labour 164 (9.8) 9103 (10.6)
Mode of delivery
Normal vaginal delivery 1174 (70.0) 59 398 (68.8)
Forceps 91 (5.4) 4545 (5.3)
Vacuum 81 (4.8) 4526 (5.2)
Vaginal breech 18 (1.1) 1050 (1.2)
Caesarean section – planned (no labour)
164 (9.8) 9103 (10.6)
Caesarean section – intra-partum
149 (8.9) 7654 (8.9)
Any smoking during pregnancy 333 (19.9) 17 066 (19.8)
Maternal medical conditions
Gestational diabetes or diabetes mellitus
67 (4.0) 3451 (4.0)
Any hypertension 119 (7.1) 6202 (7.2)
Gestational age
,37 completed weeks
102 (6.1) 5953 (6.9)
Infants with Apgar1,4 55 (3.3) 2878 (3.3)
Infants with Apgar5,7 37 (2.2) 2191 (2.6)
Infant birthweight,2500 g 90 (5.4) 5299 (6.1)
$4000 g 201 (12.0) 10 404 (12.1)
Perineal status
Intact 732 (43.6) 38 581 (44.7)
1st degree tear or graze 335 (20.0) 16 300 (18.9)
2nd degree tear 294 (17.5) 14 926 (17.3)
3rd degree tear 10 (0.6) 608 (0.7)
4th degree tear 1 (,0.1) 48 (,0.1)
Episiotomy 247 (14.7) 12 633 (14.6)
Both tear and episiotomy 24 (1.4) 1249 (1.5)
Regional analgesia 554 (33.0) 27 623 (32.0)
Induction 446 (26.6) 20 898 (24.2)
Infant resuscitation 127 (7.6) 6565 (7.6)
Baby discharge status
Discharged 1558 (92.3) 80 517 (93.3)
Stillbirth 11 (0.7) 595 (0.7)
Neonatal death 2 (0.1) 200 (0.2)
Transferred 106 (6.3) 4859 (5.6)
Transferred and died 0 (0.0) 16 (,0.1)
aSample size¼1678. bSample size¼86 305. c
Source: 1998 Perinatal Data Collection.
Conclusion
Our findings demonstrate that dichotomised perinatal variables have high levels of accuracy and reliability when compared with medical records. In addition, ascertainment
of risk factors show some non-significant differences within different pregnancy outcome groups; however reporting errors are random in their direction, revealing that there is no evidence of systematic bias.
Table 3. Agreement, ascertainment and accuracy of dichotomised pregnancy risk factors reported in the Perinatal Data Collection (PDC) and grouped by pregnancy outcomes compared with validated data, NSW, 1998
Risk Outcome
n5number in outcome identified by PDC sample
Risk identified by PDC sample
Risk identified by validation data
Agreement %
Kappa Sensitivity %
PPV %
Smoking ,37 weeks gestation
(n¼100)a
27 33 94.0 0.86 81.8 100.0
$37 weeks gestation
(n¼1542)
304 322 97.1 0.91 90.4 95.7
,2500 g (n¼87)a 29 35 93.1 0.85 82.9 100.0
$2500 g (n¼1555) 302 320 97.2 0.91 90.3 95.7
Hypertension ,37 weeks gestation
(n¼102)a
20 26 94.1 0.83 76.9 100.0
$37 weeks gestation
(n¼1576)
99 132 96.5 0.74 66.7 88.9
Diabetes $4000 g (n¼201)a 11 10 98.5 0.85 90.0 81.8
,4000 g (n¼1473) 56 59 99.1 0.88 86.4 91.1
Instrumental birth
Perineal trauma
(n¼575)a
144 146 98.6 0.96 96.6 97.9
No perineal trauma (n¼1011) 28 32 99.6 0.93 87.5 100.0
Induction Regional analgesia
(n¼553)a
170 173 97.3 0.94 94.8 96.5
No regional analgesia
(n¼1123)
275 267 98.6 0.96 98.5 95.6
Infant
resuscitation
Apgar5,7 (n¼37)a 20 21 86.5 0.73 85.7 90.0
Apgar5¼7–10
(n¼1628)
106 139 96.3 0.73 66.2 86.8
Records with missing data were excluded. PPV: positive predictive value.
a
Outcome known to be associated with risk factor (adverse outcome).
Table 2. Agreement, ascertainment and accuracy of dichotomised pregnancy outcome variables reported in the Perinatal Data Collection (PDC) compared with validated data, NSW, 1998
Outcome Cases in PDC
sample
Cases in validation data
Agreement %
Kappa Sensitivity %
Specificity %
PPV %
,37 weeks gestation 102 103 99.5 0.95 95.1 99.7 96.1
,2500 g birthweight 90 90 99.9 0.99 98.9 99.9 98.9
$4000 g birthweight 201 202 99.9 0.99 99.5 100.0 100.0
Apgar1,4 55 54 99.9 0.99 100.0 99.9 98.2
Apgar5,7 37 38 99.8 0.96 94.7 99.9 97.3
Perineal trauma 576 575 97.8 0.95 96.9 98.3 96.7
Regional analgesia 554 561 98.2 0.96 96.6 98.9 97.8
Stillbirth 11 11 100.0 1.00 100.0 100.0 100.0
Records with missing data were excluded. PPV: positive predictive value.
References
1. Benchimol EI, Manuel DG, To T, Griffiths AM, Rabeneck L, Guttmann A. Development and use of reporting guidelines for assessing the quality of validation studies of health
administra-tive data. J Clin Epidemiol2011; 64(8): 821–9. doi:10.1016/
j.jclinepi.2010.10.006
2. Roberts CL, Bell JC, Ford JB, Morris JM. Monitoring the quality of maternity care: How well are labour and delivery events
reported in population health data?Paediatr Perinat Epidemiol
2009; 23(2): 144–52. doi:10.1111/j.1365-3016.2008.00980.x
3. Taylor L, Pym M, Bajuk B, Sutton L, Travis S, Banks C.
Validation study: NSW Midwives Data Collection 1998.N S W
Public Health Bull Supplementary Series2000; 9(1): 97–9.
doi:10.1071/NB00045
4. Lain SJ, Hadfield RM, Raynes-Greenow CH, Ford JB, Mealing NM, Algert CS et al. Quality of data in perinatal
population health databases: a systematic review.Med Care
2012; 50(4): e7–20. doi:10.1097/MLR.0b013e31821d2b1d
5. Ford JB, Roberts CL, Simpson JM, Vaughan J, Cameron CA.
Increased postpartum hemorrhage rates in Australia.Int J
Gynaecol Obstet2007; 98(3): 237–43. doi:10.1016/
j.ijgo.2007.03.011
6. Roberts CL, Algert CS, Morris JM, Ford JB, Henderson-Smart DJ. Hypertensive disorders in pregnancy: A population-based
study.Med J Aust2005; 182(7): 332–5.
7. Schoendorf KC, Branum AM. The use of United States vital
statistics in perinatal and obstetric research.Am J Obstet Gynecol
2006; 194(4): 911–5. doi:10.1016/j.ajog.2005.11.020
8. Roberts C, Lain S, Hadfield R. Quality of population health data
reporting by mode of delivery.Birth2007; 34(3): 274–5.
doi:10.1111/j.1523-536X.2007.00184_2.x
9. Roberts CL, Bell JC, Ford JB, Hadfield RM, Algert CS, Morris JM. The accuracy of reporting of the hypertensive
disorders of pregnancy in population health data.Hypertens
Pregnancy2008; 27(3): 285–97. doi:10.1080/
10641950701826695
10. Cnattingius S. The epidemiology of smoking during pregnancy: smoking prevalence, maternal characteristics, and pregnancy
outcomes.Nicotine Tob Res2004; 6(Suppl 2): S125–40.
doi:10.1080/14622200410001669187
11. Rosenberg TJ, Garbers S, Lipkind H, Chiasson MA. Maternal obesity and diabetes as risk factors for adverse pregnancy
out-comes: differences among 4 racial/ethnic groups.Am J Public
Health2005; 95(9): 1545–51. doi:10.2105/AJPH.2005.065680
12. Makgoba M, Savvidou MD, Steer PJ. The effect of maternal
characteristics and gestational diabetes on birthweight.BJOG
2012; 119(9): 1091–7. doi:10.1111/j.1471-0528.2012.03388.x
13. Mikolajczyk RT, Zhang J, Troendle J, Chan L. Risk factors for
birth canal lacerations in primiparous women.Am J Perinatol
2008; 25(5): 259–64. doi:10.1055/s-2008-1075040
14. Maslow AS, Sweeny AL. Elective induction of labor as a risk factor for cesarean delivery among low-risk women at term.
Obstet Gynecol2000; 95(6 Pt I): 917–22. doi:
10.1016/S0029-7844(00)00794-8
How does tele-learning compare with other
forms of education delivery? A systematic
review of tele-learning educational
outcomes for health professionals
Jo Tomlinson
A,E, Tim Shaw
A, Ana Munro
A,
Ros Johnson
B, D. Lynne Madden
C,
Rosemary Phillips
Dand Deborah McGregor
A AFaculty of Medicine, The University of Sydney B
NSW Kids and Families, NSW Ministry of Health C
School of Medicine, Sydney, The University of Notre Dame (formerly Public Health Training and Workforce, NSW Ministry of Health)
D
Statewide and Rural Health Service and Capital Planning, NSW Ministry of Health
E
Corresponding author. Email: [email protected]
Abstract: Telecommuniciation technologies, including audio and videoconferencing facilities, afford geographically dispersed health profes-sionals the opportunity to connect and
collabo-rate with others. Recognised for enabling
tele-consultations and tele-collaborations between teams of health care professionals and their patients, these technologies are also well suited to the delivery of distance learning programs,
known as tele-learning. Aim: To determine
whether tele-learning delivery methods achieve equivalent learning outcomes when compared with traditional face-to-face education delivery
methods. Methods: A systematic literature
review was commissioned by the NSW Ministry of Health to identify results relevant to programs applying tele-learning delivery methods in the provision of education to health professionals. Results: The review found few studies that rigorously compared tele-learning with traditional formats. There was some evidence, however, to support the premise that tele-learning models
achieve comparable learning outcomes and
that participants are generally satisfied with and
accepting of this delivery method.Conclusion:The
review illustrated that tele-learning technologies
not only enable distance learning opportunities, but achieve comparable learning outcomes to traditional face-to-face models. More rigorous evidence is required to strengthen these findings and should be the focus of future tele-learning research.
Telecommunications are increasingly being used by the health professions to deliver health care services and to exchange health information across distances. Telehealth, tele-collaborations and tele-consultations are contributing to improvements in the quality, availability and efficiency
of health care services to distance locations.1Telehealth,
for example, enables existing forms of interactions between health care providers and recipients to occur at a
distance, through the use of telecommunications.2
Simi-larly, distance learning methods utilising telecommunica-tion technologies are helping to overcome the challenges of engaging in traditional forms of education across dis-tances. Referred to as ‘tele-learning’, it involves making connections among people and resources, and transferring images and voice data via communication technologies,
for learning-related purposes.3,4
Like telehealth, tele-learning utilises telecommunications to connect participants, helping to alleviate barriers to accessing learning opportunities and enriching distance learning experiences. The relative ease of use and avail-ability of telecommunication technologies means that audioconferencing (teleconferencing) and videoconfer-encing are well established and frequently used
communi-cation mechanisms for staff in the health sector.5For the
purpose of this review, the term ‘tele-learning’ describes the use of video and/or audio-based technologies for distance learning purposes.
Enabling collaborations between geographically distri-buted health workers makes the use of telecommunica-tions especially relevant to professionals working in rural
and remote areas.6 NSW Health has made substantial
investments in telecommunication infrastructure, making
tele-learning more readily accessible within education and
clinical facilities,7 although it should be noted that the
financial implications of tele-learning were outside the scope of this review.
This review sought to establish whether education using tele-learning methods results in equivalent learning out-comes when compared to traditional face-to-face methods. The review was commissioned by NSW Health to ascertain whether there was an evidence base to support the use of videoconferencing to develop and deliver educational programs to health professionals (videoconferencing being one way of enabling clinicians working in rural and remote areas to have access to continual professional development and educational programs).
Methods
A systematic review was conducted to identify literature relevant to the use of tele-learning technologies in deliver-ing education and traindeliver-ing materials/programs to health professionals. A review of abstracts refined the results to literature reporting on learning outcomes achieved from tele-learning interventions. Researchers and review stake-holders from the public health sector collaborated in the formulation and refinement of the specific review ques-tions and search parameters.
Review questions translated into the following search terms; videoconference/ing, tele-learning, tele-education, telehealth, telemedicine, teleconference/ing, audio confer-ence/ing, videostreaming, education, learning outcomes, multidiscipline/ary, face-to-face, professional develop-ment, continuing medical education, distance education, distance learning, podcast/ing and vodcast/ing.
Information sources
The following medical and educational databases were the basis for the search: MEDLINE, Cochrane Database of Systematic Reviews, American College of Physicians Journal Club, Database of Abstracts of Reviews of Effects (DARE), Cochrane Central Register of Controlled Trials (CENTRAL), Embase, Cumulative Index to Nursing and Allied Health Literature (CINAHL), PubMed, University of Sydney catalogue search (Summon search), PsycINFO, Educational Resources Information Center (ERIC), British Education Index (BEI), and Google Scholar.
Reference lists from original articles were utilised to identify relevant literature and two frequently cited
jour-nals were searched by hand:Journal of Telemedicine and
Telecare and Telemedicine and e-Health. An internet search for relevant literature, including grey literature sources, was conducted using the Google search engine and other government and education databases.
Inclusion and exclusion criteria
The search focused primarily on the education of health professionals, but also included tertiary students.
The review included both synchronous (content delivered simultaneously to face-to-face and tele-learning cohorts) and asynchronous delivery models (content delivered to the cohorts at different times). Studies utilising desktop computers and the internet were included where the technologies were used for televised conferencing, includ-ing synchronous and asynchronous streamed lectures. The review excluded facilitated e-learning and online educa-tion models such as the use of social networking, blogs,
wikis and BlackboardTM learning management system
software.
Results published prior to 2000 were excluded from the review as it was considered they would not incorporate the technologies currently available. Other exclusions includ-ed: papers discussing education and training interventions at lower than bachelor levels; health care delivery via telemedicine; and papers primarily focused on the
tech-nical specifications/IT equipment requirements for
videoconferencing. Due to the relatively low number of randomised controlled trials and other rigorous methodo-logical studies, searches were not limited, in the first instance, by study type. The search included qualitative, comparative, observational and evaluation studies, rando-mised controlled trials and systematic reviews.
Results
The search retrieved 47 records. Of these, four randomised
controlled studies8–11 and nine comparative studies12–20
were identified as measuring learning outcomes of tele-learning versus traditional face-to-face education. The remaining 34 papers were either descriptive observational studies or did not measure tele-learning versus face-to-face education and so were excluded from the review. While the
13 included studies (summarised in Table 1) reported
comparable learning outcomes achieved by the delivery methods, the scientific rigour of these studies was not strong; this needs to be considered when drawing conclu-sions from the literature. Many of these studies noted a failure to control for variables such as participant prior knowledge and ability, instructor experience and methods, and instructor and participant familiarity with technology. Limitations also included small sample sizes and non-random selection of participants. As mentioned, studies focused on health professionals and tertiary students.
Two of the randomised controlled studies8,9 compared
Table 1. Randomised controlled trials (RCT) and comparative studies of learning outcomes ] tele-learning vs face-to-face education, 2000 ] 2012 Study Study design Intervention (sample size) Study population Outcome measure Controlled for potential confounders Results Stain et al. 8 RCT Videoconference plus PowerPoint materials delivered via the internet ( n ¼ 12) Face-to-face lecture ( n ¼ 98) Medical students Mean exam results (mark out of 100) taken from 4 exams administered weekly across 4 weeks Yes (participants’ prior knowledge and ability) Mean scores Videoconference ¼ 70.5% Face-to-face ¼ 71.4% No significant difference (p ¼ 0.65) van Boxel et al. 9 RCT 15 participants randomly allocated to attend 4 alternating workshops (2 via video-conference and 2 face-to-face) Nurses Qualitative evaluation and learning effectiveness (pre-and post-test) No Mean percentage increase in learning effectiveness Videoconference ¼ 17% Face-to-face ¼ 18% No significant difference (p . 0.5) Spickard et al. 10 RCT Online lecture ( n ¼ 48) Face-to-face lecture ( n ¼ 47) Medical students Knowledge (mark out of 16), time, and student satisfaction Yes (pre-test knowledge) Summary post-test knowledge scores Online ¼ 10.8 Face-to-face ¼ 10.7 No significant difference (p ¼ 0.91) Solomon et al. 11 RCT Two courses delivered across two platforms Digital lecture ( n ¼ 17) Face-to-face lecture ( n ¼ 12) Medical students Exam (5–6 questions) for each course No Mean exam results Course 1 Digital ¼ 4.88 Face-to-face ¼ 4.42 No significant difference (p ¼ 0.22) Course 2 Digital ¼ 9.00 Face-to-face ¼ 9.25 No significant difference (p ¼ 0.41) Latour et al. 12 Comparative Undergraduate course Videoconference ( n ¼ 145) Face-to-face ( n ¼ 24) Graduate course Videoconference ( n ¼ 5) Face-to-face ( n ¼ 17) Animal science students Exam results (out of a possible 100) No Mean results Undergraduate course Videoconference ¼ 78.9 Face-to-face ¼ 81.0 Graduate course Videoconference ¼ 86.1 Face-to-face ¼ 83.6 Loewen et al. 13 Comparative Videoconference ( n ¼ 26) Face-to-face ( n ¼ 30) Health care professionals Post-test (mark out of 62) No Mean post-test scores Videoconference ¼ 57.0 Face-to-face ¼ 54.7 Significant increase in knowledge for both groups (p , 0.001) Markova et al. 14 Comparative Up to 36 participants split between videoconference and face-to-face on 17 occasions Resident physicians Pre-and post-test marks in percentages No Percentage difference between pre-test and post-test Videoconference ¼ 14.9% Face-to-face ¼ 15.2% No significant difference (p ¼ 0.922) Kidd et al. 15 Comparative Videoconference ( n ¼ 75) Face-to-face ( n ¼ 38) Undergraduate pharmacy students Course grade (out of 100) No Mean course grade Videoconference ¼ 87.8% Face-to-face ¼ 90.7% Significant difference (p ¼ 0.024)
Bertsch et al. 16 Comparative 52 participants attended 6 series of 8 lectures in 2-month blocks: 4 face-to-face and 4 via videoconference Third year medical students Exam at end of each 2-month block (out of 100) No Mean score across 12 months Videoconference ¼ 78% Face-to-face ¼ 76% No significant difference (p ¼ 0.66) Kerns et al. 17 Comparative Combination of face-to-face and video-conference ( n ¼ 10) Face-to-face ( n ¼ 26) Nurse anaesthesia students Exam (out of 600) No Mean scores Combination ¼ 401 Face-to-face ¼ 392 No significant difference (p ¼ 0.52) Chen et al. 18 Comparative 59 participants took part in up to 4 different modalities of 2 courses: live, videocast, audiocast, and prerecorded computer-based format Health professionals Pre-and post-test knowledge tests (identical) for each modality in each course No Mean score gains Course 1 Live ¼ 1.44 Video ¼ 1.00 Audio ¼ 0.64 Computer ¼ 0.20 Significant increases in live (p ¼ 0.050) and video (p ¼ 0.046) modes Course 2 Live ¼ 0.67 Video ¼ 1.43 Audio ¼ 1.60 Computer ¼ 1.17 Significant increases in video (p ¼ 0.000), audio (p ¼ 0.000) and computer (p ¼ 0.003) modes Haythornthwaite 19 Comparative 32 participants undertook training program delivered via videoconference with 20 completing assessment Face-to-face ( n ¼ 11) Rural youth workers Comparison of videoconference participants’ pre-and post-scores on 2 knowledge modules (both out of 10) and satisfaction levels with outcomes previously achieved by face-to-face participants of same program. Only those results with significant differences were reported No Mean improvement between pre-and post-scores Module 1 knowledge Videoconference ¼ 1.05 Face-to-face ¼ 0.50 Significant improvement in videoconference group (p , 0.02) Umble et al. 20 Comparative Videoconference ( n ¼ 116) Face-to-face ( n ¼ 196) Health professionals Comparison of 5 outcome indicators including knowledge (5 multiple choice questions with maximum score of 5) administered pre, immediately post, and at 3-month follow up No Mean knowledge results Face-to-face ¼ 3.82, 4.48, 4.52 Videoconference ¼ 2.68, 4.19, 4.24 Significant increases across all results (p , 0.001)
studies8delivered PowerPoint materials to remote
partici-pants via the internet. The first study8 involved 110
surgical clerkship students, however only 12 of these students participated in the videoconferencing
interven-tion. The second study9 involved 15 community nurses,
with the low sample sizes attributed to recruitment and facility capacity limitations.
One study compared the learning outcomes of 95 medical students allocated to either attend live lectures or use the internet to access and view the streamed lecture on a
desktop computer.10 The streamed lecture consisted of
a PowerPoint presentation with optional audio accompani-ment. The delivery mode was asynchronous, meaning that students could view the material at any time and there was no interaction between the lecturer and student. Summary post-test scores were almost identical (10.8 vs 10.7 out of a possible 16 for online and face-to-face modes, respec-tively); no statistically significant difference was found between the two modes of delivery.
The fourth controlled trial11 compared face-to-face
lec-tures with a digital lecture format, similar to streaming (but using the previous year’s lectures sent to students in CD-ROM format), to compare performances of 29 third year medical students across two courses. Again, mean exam results for both courses were very similar between those who attended the face-to-face lectures (achieving 4.42 and 9.25 respectively) and those who utilised the distance learning format of the lectures (achieving 4.88 and 9.0 respectively).
The nine comparative studies12–20 further reinforced
comparable learning outcomes for face-to-face and tele-learning delivery formats. Of note, videoconferencing was the prominent tele-learning method utilised by the majority of the comparative studies. Studies involving participants
from multidisciplinary neonatal care teams,13
pharmacol-ogy,15medicine,14,16and nursing17all demonstrated that
there was little or no difference in learning outcomes when comparing traditional classroom instruction with distance learning via interactive videoconference. While a study on
mental health training for workers19based in rural centres
found significant improvement in knowledge for the videoconference participants, similar learning outcomes were achieved across both groups.
One comparative study18assessed multiple tele-learning
methods, including simultaneous videocast of the live lecture, simultaneous audiocast of the live lecture, and a pre-recorded computer-based format, with the live lecture format. Significant increases in knowledge gain were demonstrated across multiple delivery modes with evalua-tion of user feedback showing similar levels of interest and acceptability.
Another comparative study20of a large national
immuni-sation continuing education course for the public health
workforce in the United States demonstrated comparable outcomes for classroom and distance (satellite broadcasted) trained participants. The study concluded that classroom and distance delivery methods have comparable outcomes in continuing education and can foster the implementation of practice guidelines and recommendations.
Most of the included studies reported qualitative partici-pant satisfaction results. In terms of satisfaction with tele-learning versus traditional face-to-face education models, participants routinely reported a high level of acceptability
and satisfaction with tele-learning delivery models11,13–15
but a preference for traditional face-to-face models.10,12
Discussion
The literature indicates that tele-learning can provide an effective means of delivering educational outcomes for health professionals.
The majority of the available literature on tele-learning is descriptive or observational. This review focused on ran-domised controlled trials and comparative studies. Caution must be taken when interpreting the results of these studies as they often lacked an established evaluation framework, and failed to control for independent variables such as participants’ prior knowledge and ability, instructor expe-rience and methods, and instructor and participant famil-iarity with technology. Limitations also included small sample sizes and non-random selection of participants.
Despite limited rigorous evidence, the available literature supports the notion that tele-learning methods achieve comparable learning outcomes when compared with tradi-tional face-to-face learning methods.
Two studies indicated participant preference for more traditional face-to-face education delivery methods over tele-learning methods. However, the literature also indi-cated a high level of participant satisfaction with tele-learning methods, with many participants indicating that they would partake in future tele-learning opportunities or recommend these opportunities to others. Two studies reported a perception that tele-learning should only be used when face-to-face is not feasible and should complement
rather than replace traditional teaching.5,21Therefore, like
Birden and Page,22we could surmise that tele-learning is a
useful adjunct to traditional learning methods.
Conclusion
The literature supports tele-learning as an effective means of delivering education that can achieve learning outcomes that are comparable to traditional face-to-face learning methods. The utility of tele-learning infrastructure for enabling distance learning opportunities should be consid-ered. However, the limited availability of rigorous evi-dence highlights the need for further research to reinforce the equivalency of tele-learning delivery methods.
Acknowledgments
The systematic review which underpins this paper was funded by the Telehealth Unit, Statewide and Rural Health Service and Capital Planning Branch, NSW Ministry of Health, and brokered by The Sax Institute for NSW Health. The research was completed by the Workforce Education Development Group which is part of Sydney Medical School, The University of Sydney.
References
1. Maeder A. Telehealth Standards Directions Supporting Better Patient Care. HIC 2008 Conference: Australia’s Health Infor-matics Conference. Melbourne, Vic. Health InforInfor-matics Society of Australia.
2. Currell R, Urquhart C, Wainwright P, Lewis R. Telemedicine versus face to face patient care: effects on professional practice
and health care outcomes.Cochrane Database Syst Rev2000;
(2): CD002098.
3. Moonen J. The efficiency of telelearning.J Asynchronous Learn
Netw1997; 1(2): 68–77.
4. Taylor JC. Distance education technologies: The fourth
gener-ation.Australian Journal of Education Technology1995; 11(2):
1–7.
5. Naylor C, Madden DL, Neville L, Oong DJ. Pilot study of using a web and teleconference for the delivery of an Epi Info training
session to public health units in NSW, 2005.N S W Public Health
Bull Supplementary Series2009; 20(2): 22–37.
6. Newman C, Martin E, McGarry DE, Cashin A. Survey of a videoconference community of professional development for
rural and urban nurses.Rural Remote Health2009; 9(2): 1134.
7. Sackett KM, Campbell-Heider N, Blyth JB. The evolution and evaluation of videoconferencing technology for graduate
nurs-ing education.Comput Inform Nurs2004; 22: 101–6.
doi:10.1097/00024665-200403000-00012
8. Stain SC, Mitchell M, Belue R, Mosely V, Wherry S, Adams CZ et al. Objective assessment of videoconferenced lectures in a
surgical clerkship.Am J Surg2005; 189(1): 81–4. doi:10.1016/
j.amjsurg.2004.04.012
9. van Boxel P, Anderson K, Regnard C. The effectiveness of palliative care education delivered by videoconferencing
com-pared with face-to-face delivery.Palliat Med2003; 17(4):
344–58. doi:10.1191/0269216303pm753oa
10. Spickard A, Alrajeh N, Cordray D, Gigante J. Learning about
screening using an online or live lecture: does it matter?J Gen
Intern Med2002; 17(7): 540–5. doi:
10.1046/j.1525-1497.2002.10731.x
11. Solomon DJ, Ferenchick GS, Laird-Fick HS, Kavanagh K. A randomised trial comparing
![Table 1.Patient characteristics and season of encounter, Hunter Valley region and ruralNSW, 1998]2010](https://thumb-us.123doks.com/thumbv2/123dok_us/57274.2007336/3.595.129.482.111.371/table-patient-characteristics-season-encounter-hunter-valley-ruralnsw.webp)
![Table 2.Rate of problems managed by ICPC-2 chapter and rank order, Hunter Valley region and rural NSW patients, 1998]2010](https://thumb-us.123doks.com/thumbv2/123dok_us/57274.2007336/4.595.45.545.99.409/table-problems-managed-chapter-hunter-valley-region-patients.webp)
![Table 3.Rate of problems managed by component and rank order, Hunter Valley region and rural NSW patients, 1998]2010](https://thumb-us.123doks.com/thumbv2/123dok_us/57274.2007336/5.595.62.554.94.776/table-problems-managed-component-hunter-valley-region-patients.webp)
![Table 5.Rate of medication subgroup prescription or supply and rank order, Hunter Valley region and rural NSW patients,1998]2010](https://thumb-us.123doks.com/thumbv2/123dok_us/57274.2007336/7.595.59.557.108.578/table-medication-subgroup-prescription-supply-hunter-valley-patients.webp)
![Table 7.Rate of respiratory chapter problems managed by time period, Hunter Valley and rural NSW patients, 1998]2010](https://thumb-us.123doks.com/thumbv2/123dok_us/57274.2007336/8.595.43.549.110.223/table-respiratory-chapter-problems-managed-hunter-valley-patients.webp)


