Influence of System Behavior on Success of Public Infrastructural Megaprojects in Kenya
Author’s Details:(1)
Austin Baraza Omonyo (2)Prof. Roselyn Gakure (3)Prof. Romanus Odhiambo Abstract
The main objective of this study was to investigate the influence of system behavior on the success of public infrastructural megaprojects in Kenya. The need for this study arose from the thesis that complexity is the main cause of waste and failure that results in infrastructural megaprojects being delivered over budget, behind schedule, with benefit shortfalls, over and over again; and that system behavior is a key cause of this complexity. The study was designed as quantitative research, based on virtual constructionist ontology. A cross-sectional census survey of completed public infrastructural megaprojects was conducted using two interlinked questionnaires. Data analysis was conducted using both descriptive and inferential statistics. The results showed that system behavior had a significant negative influence on the success of public infrastructural megaprojects. System dynamics arising from the interaction of connectedness and dependency influenced success in such a way that the relative variability in cost and schedule performance was lower in cases where project components were pre-fabricated, pre-assembled and tested offsite; and projects in which materials were only brought on site when the site was ready to receive them recorded superior performance in both cost and schedule. As such, this study recommends that the design of these projects should provide for a delivery model in which project components are pre-fabricated, pre-assembled and tested offsite before their actual use on the project. It is also recommended that procurement practices for these projects be streamlined to allow for Just-In-Time (JIT) procurement Keywords: System behavior, megaproject, complexity, project success
1. Introduction
Public infrastructural megaprojects are large-scale, complex ventures that cost billions of money, take many years to develop and build, involving multiple public and private stakeholders, are transformational, and impact millions of people (Flyvbjerg, 2014). These projects are generally “greenfield” in nature as they often create new assets and utilize a variety of delivery models depending on their inherent complexity. These projects are often trait making since they are designed to change the structure of society. This is in contrast with smaller and more conventional projects that are trait taking since they fit into pre-existing structures without modification (Hirschman, l995). Brady and Davies (2014) note that megaprojects are among the most complex category of project.
In Kenya, the growth in the use of infrastructural megaprojects to deliver goods and services has been phenomenal over the past few years, and there appears to be no end in sight for their use. This is despite the fact that megaprojects are always delivered over budget, with schedule delays, with benefit shortfalls, over and over again (Flyvbjerg, 2014). The complexity inherent in the megaproject environment is often cited as the main cause of this poor performance (Cooke-Davies, Crawford & Stephens, 2011). Without a coherent research agenda to understand both its causes and navigation strategies, complexity continues to result in problems, waste and socio-economic failure (Remington & Zolin, 2011). As a step in taking this agenda forward, and building on the work of earlier researchers such as Maylor, Vidgen, and Carver (2008), the Project Management Institute (PMI) published a Practice Guide on Navigating Complexity in 2014. This Guide describes the causes of complexity in three categories namely; human behavior, ambiguity, and system behavior.
Whereas a number of studies exist that explain the relationship between human behavior and project success (Collyer, 2016; Olaniran, Love, Edwards, Olatunji & Mathews, 2015; Meyer, 2014; Shore, 2008; Flyvbjerg, Holm & Buhl, 2004; Lovallo & Kahneman, 2003; Bruzelius, Flyvbjerg & Rothengatter, 2002; Mackie & Preston, 1998; Kahneman & Tversky, 1979), and the relationship between ambiguity and project success (Brady & Davis, 2014; Hargen & Park, 2013; Liu & Leitner, 2012; Ghosh, Williams, Askew & Mulgund, 2012; Swartz 2008; Duimering, Ran, Derbentseva & Poile, 2006; Birkinshaw, 2004), virtually no study explores the influence of system behavior on success of projects. This is despite the existence of studies that show that poor understanding and treatment of project complexity and systemic is the most common shortcoming of cost overrun research undertaken thus far (Ahiaga-Dagbui, Love, Smith & Ackermann, 2017).
result of these connections and disconnects, changes at the component level may create unintended consequences throughout the program or project thus affecting project success. Interdependence among the component tasks and stakeholder relationships (Loch, De Meyer & Pich, 2006, p.52) is also a key aspect of systemic and a factor explaining project complexity and success. Where studies on infrastructure overrun have been done utilizing systems thinking, the overrun problem has been framed in a manner that ignores the typological context of the projects. Thus, singular and independent causes of overruns that are identified through techniques such as multiple regression and correlation do not reflect the becoming nature of the infrastructural megaproject environment. Megaprojects are implemented in an unstable and unorderly postmodern social world of emergence and rapid change, where the sum of the parts of a system are less than the whole (PMI, 2014); and project management is neither a practice nor a tool but a rallying rhetoric in the context of power play, domination, and control (Gauthier & Ika, 2012). Consequently, for these projects, both cost and schedule overruns are best understood through an understanding of the entire system (Ahiaga-Dagbui et al., 2017).
Through this quantitative research based on virtual constructionist ontology, managers, team members, sponsors and key stakeholders of completed public sector infrastructural megaprojects were surveyed to investigate the influence of system behavior on the success of public infrastructural megaprojects. System behavior is operationalized through its components namely; connectedness, dependency and system dynamics (PMI, 2014). The remainder of this article is organized as follows: the relevant theoretical and empirical literature are reviewed leading to the formulation of the study hypothesis and a presentation of the conceptual framework. The next section describes the methodology followed by the study and this is followed by a section on results of the study and a discussion of those results. The last section presents the conclusions and references.
2. Theoretical and Conceptual Framework 2.1Theoretical Framework
This study was operationalized through two theories namely; Complex Adaptive Systems and Project Success theories. Each of these theories is briefly discussed below:
2.1.1 Complex Adaptive Systems Theory
Complex Adaptive Systems (CAS) theory also referred to as Complexity theory, states that critically interacting components self-organize to form potentially evolving structures exhibiting a hierarchy of emergent system properties (Lucas, 2009). The rise of CAS as a school of thought is usually attributed to the mid-1980’s formation of the Santa Fe Institute, a New Mexico think tank formed in part by the former members of the nearby Los Alamos National Laboratory. The scientists here claimed that through the study of complexity theory, one can see both laws of chaos and that of order; through which an explanation for how any collection of components will organize itself can be generated (Waldrop, 1992).
Complexity theory is concerned with the study of how order, structure, pattern, and novelty arise from extremely complicated, apparently chaotic systems and conversely, how complex behavior and structure emerges from simple underlying rules. The theory attempts to discover how the many disparate elements of a system work with each other to shape the system and its outcomes, as well as how each component changes over time (PMI, 2014). Insights from the study of complexity in the life sciences suggest that there is a natural tendency for all organisms (including humankind and social organisms such as project teams) to evolve complex responses to challenges that they encounter in their environment.
package or one task package depends on another task package. System dynamics results from the connectedness and interdependence of many components that interact so as to cause change over time (PMI, 2014).
The CAS theory is reinforced by the Chaos theory which studies the behavior of dynamical systems that are highly sensitive to initial conditions. The theory is attributed to Edward Lorenz who while using a computer to simulate weather systems in 1960 at Massachusetts Institute of Technology, discovered one important aspect of how non-linearity affects the weather-the principle of sensitive dependence on initial conditions (Lorenz, 1963). Lorenz’s discovery of how minute changes can have major and unpredictable consequences in nonlinear systems became known as the “butterfly effect.” According to this theory, small differences in initial conditions yield widely diverging outcomes for such dynamical systems, rendering long-term prediction impossible in general (Kellert, 1993). Thus, a small initial schedule delay in delivering one component of a megaproject can lead to more than the proportionate delay in the entire project.
2.1.2 Project Success Theory
There have been various attempts over the history of project management to define suitable criteria against which to anchor and measure project success (McLeod, Doolin & MacDonell, 2012). The most recognized of these measures is the long-established and widely used “iron triangle” of time, cost and quality (Atkinson, 1999; Cooke-Davies, 2002; de Wit, 1988, Ika, 2009; Jugdev, Thomas, & Delisle, 2001). However, the “iron triangle” dimensions are inherently limited in scope (Atkinson, 1999; Ika, 2009; Wateridge, 1998). A project that satisfies these criteria may still be considered a failure; conversely, a project that does not satisfy them may be considered successful (Baccarini, 1999; de Wit, 1988, Ika, 2009). The “iron triangle” only focuses on the project management process and does not incorporate the views and objectives of all stakeholders (Atkinson, 1999; Baccarini, 1999; Bannerman, 2008; de Wit, 1988; Jugdev & Muller, 2005; Wateridge, 1998).
Researchers have progressively widened the scope and constituency of what is meant by project success, recognizing that project success is more than project management success and that it needs to be measured against overall objectives of the project thus reflecting a distinction between the success of a project’s process and that of its product (Baccarini, 1999; Markus & Mao, 2004; Wateridge, 1998). Product success involves such criteria as product use, client satisfaction and client benefits (McLeod et al., 2012).
Researchers are also increasingly advocating for project success criteria that incorporate achievement of a broader set of organizational objectives involving benefits to the wider stakeholder base (see Shenhar, Dvir, & Levy, 1997; Shenhar, Dvir, Levy & Maltz, 2001; Shenhar & Dvir, 2007; Hoegl & Gemuenden, 2001). This is plausible given that projects are a means of delivering the organization’s strategic objectives. Proponents of this school of thought advocate for inclusion of success criteria such as business and strategic benefits. It is this broader context of success that appeals to infrastructural megaprojects. For these projects, success is seen from the point of view of its intended sublime-whether economic, political, aesthetic or technological.
2.2Conceptual Framework
A literature search on the influence of system behavior on the success of infrastructural megaprojects did not return many results. However, there exist some studies that are useful in building up hypothesis and constructs for the purposes of our study. For instance, in a study titled, “Toward a Systemic View to Cost Overrun Causation in Infrastructure Projects,” Ahiaga-Dagbui et al. (2017) posit that a poor understanding and treatment of project complexity and systemic is the most common shortcoming of cost overrun research undertaken thus far. The study recommends understanding overruns through an understanding of the entire system in which the project is implemented by using techniques such as cognitive mapping, retrospective sense-making, and systems dynamics.
Using a non-experimental, quantitative approach, O’Donnell (2010) conducted a study with the objective of providing insight into the relationships among project management leadership practices, project complexity, and measurements of project success within a variety of projects across six different organizations. The study found that increasing project systemicity had a strong, negative correlation to internal success but no relationship to external success. Thus, whereas literature points to the fact that systemic has an effect on project success, the direction of the effect is not apparent. For that matter, this study takes the view that depending on the context, system behavior can either provide an opportunity to innovate and enhance outcomes, or it can as well deter innovation and creativity thus affecting project delivery negatively. Therefore, this study tested a non-directional research hypothesis that:
HA: System behavior has a significant influence on the success of public infrastructural megaprojects. This relationship is shown in the figure below:
3. Methodology 3.1Research Design
This study was operationalized through exploratory, descriptive and explanatory research goals based on Neuman (2003) classification of research goals. To achieve these goals, a post-positivist philosophy emphasizing virtual constructionist ontology (Gauthier & Ika, 2012) was assumed. The choice of this philosophical perspective was guided by the social world of complex megaprojects. In this social world, a project is a discourse of legitimation and an arena of social and power plays; serving the interests of powerful stakeholders. As such, mega project management is neither practice nor a tool (as is the case with projects implemented in the modern social world) but rallying rhetoric in a context of the power play, domination, and control (Gauthier & Ika, 2012).
This study was designed to be quantitative research combining. To generate data for this study, a cross-sectional survey design was used. This design entails the collection of data (predominantly by questionnaire or structured interview) on usually quite a lot more than one case and at a single point in time in order to collect a body of quantitative or quantifiable data in connection with two or more variables, which are then examined to detect patterns of association (Bryman & Bell, 2007).
3.2 Target Population
This study had as its primary population public sector infrastructural megaprojects implemented by the government of Kenya since 2005. Given the continual reorganizations within government and the several projects implemented by the government, it was unlikely that project records earlier than 2005 could be traced with ease. Following Flyvbjerg (2014), the minimum budget for megaprojects included in this study was approximately Ksh. 1 billion. Managers, team members, sponsors and key stakeholders of these projects constituted the population of respondents from whom data was collected. The rationale for selecting infrastructure among other foundations of national transformation was based on its huge actual and projected expenditure in comparison to other sectors. Specifically, in the Government of Kenya (2013) Second Medium Term Plan, infrastructure was allocated over Ksh. 7.5 trillion with the second highest allocation of Ksh. 2.5 trillion going to the Information, Communication and Technology sector.
The sampling frame of this study comprised a listing of completed public sector infrastructural megaprojects implemented in Kenya since 2005 with a minimum budget of approximately Ksh. 1 billion. The list of these projects was obtained from the Vision 2030 Secretariat and counterchecked with key informants from government parastatals. A total of 31 such projects was identified.
Given the number of completed infrastructural megaprojects for the period under study as described by the sample frame, a census survey was found to be appropriate. Generally, when a sample frame is known, it can also be construed to mean that the population is known. In this case, collecting data on each member of the population becomes possible.
3.4 Instruments
The fieldwork for this study utilized two interlinked questionnaires namely, the Complexity Assessment Questionnaire, (CAQ) and the Project Success Questionnaire (PSQ). The CAQ was constructed based on the Practice Standard for Navigating Complexity (PMI, 2014) while the PSQ was developed based on Shenhar and Dvir (2004) and McLeod et al. (2012). The questionnaire survey is hailed to be an efficient data collection mechanism when the researcher knows exactly what is required and how to measure the variables of interest (Neuman, 2003). Both questionnaires utilized a mixture of Likert scale, open-ended questions, checklists and probing questions including those soliciting for specific project metrics. System behavior was measured on a scale comprising three constructs namely; connectedness, dependency and system dynamics. The scale comprised 14 items with 4 of these items measuring connectedness, 3 measuring dependency while 7 items measured system dynamics. The PSQ used in this study incorporates broader project success measures beyond the traditional critical dimensions of the “iron triangle.” The success scale comprised 18 items blending open and closed-ended questions on one part and Likert-type questions on the other part. This scale measured success along three constructs namely; process, product, and organizational success. The first part involving closed and open-ended questions were meant to assess process success while the Likert type questions assessed product and organizational success on a scale of 1 (strongly agree), 2 (agree), 3 (Neither agree nor disagree), 4 (disagree) and 5 (strongly disagree).
3.5 Pilot Test and Reliability
The pilot test involved validating data collection instruments and testing the feasibility of the data collection schedule. Through this study, the reliability and dimensionality of the measurement scales were tested to ensure that the items in the scales actually and reliably measured the intended variables. A total of four public infrastructural megaprojects and 16 respondents were surveyed as part of the pilot study. This was well above the “10% of the sample projected for the larger parent study” rule (Connelly, 2008). Reliability is concerned with the question of whether the results of a study are repeatable. It is concerned with whether or not the measures that are devised for concepts are consistent (Bryman & Bell, 2007). Cronbach’s (1951) coefficient alpha (α) is commonly used to measure the reliability of the scales for Likert-scaled sub-items (Spector, 1992). This is because the underlying assumption of the Likert scale is that it represents an underlying continuous latent scale, although the observations are ordinal (Likert, 1931), and a high score of Cronbach’s coefficient alpha means high reliability, stability and accuracy (Papadopoulos, Ojiako, Chipulu & Lee, 2012). If the sub-items have high agreement and are highly correlated then α will be close to 1. Hair, Babin, Money and Samouel (2003) asserted that an alpha coefficient between 0.8 and 0.9 shows very good strength of association. When α is ≥ 0.7, the scale is generally reliable (Nunnally, 1978). Following this rule, both instruments were found to be reliable with the system behavior scale recording a Cronbach’s alpha of 0.784 while the overall internal reliability of the success scale was 0.889.
3.6 Data Processing, Analysis and Presentation
Descriptive statistics for quantitative data analysis were derived using frequencies and percentages, measures of central tendency (mainly the mean), measures of dispersion (mainly standard deviation coefficient of variation, skewness, and kurtosis) and Earned Value measures (mainly Cost Performance Index, CPI and Schedule Performance Index, SPI). Inferential statistics were derived using regression and correlation analysis. The overall model for this study assumed the form of a simple linear regression model and was specified as:
i
i SB
PS 1 2 ; where
are the stochastic term, and β2 is the slope of the regression-change in the coefficient of project success as a result of a unit change in system behavior score. β1 is the intercept-the coefficient of project success when the system behavior score is equal to zero. The regression coefficients were extracted using Ordinary Least Squares (OLS) method and tested for significance at the 95 percent confidence level using two-tailed t-test based on the hypothesis that: H0:bi 0; HA:bi 0; where biare the values of individual betas in the estimated regression equation. The significance of the overall model was tested using multiple coefficients of determination (R2) and the F-test.
4. Findings 4.1Connectedness
System behavior arising from connectedness was measured using a Likert-type scale containing 4 items. Each of these items was scored on a scale of 1 to 3 with a score of 1 denoting low connectedness and 3 denoting high connectedness. This relationship was measured by checking the number of connections among stakeholders, subcontracts, project components, third-party relationships and layers in the organogram. The number of connections (C) was determined using the formula:
2 1 N N
C ; where N is the number of components, stakeholders, layers or third-party relations. The results
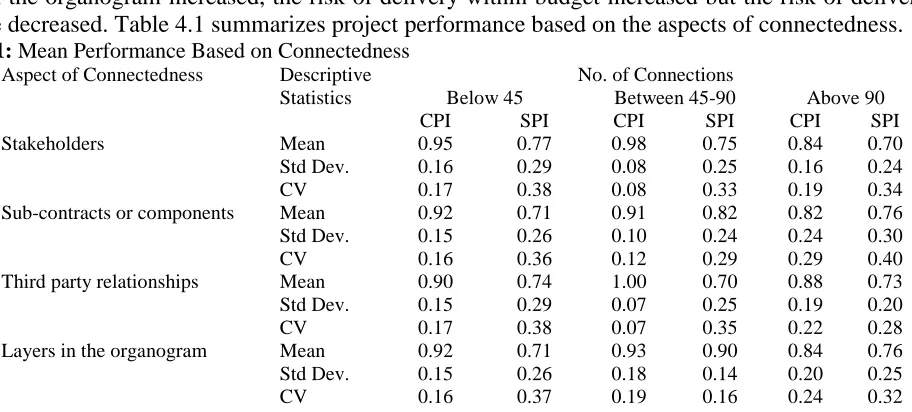
showed that in 66.6% of the projects surveyed, there were more than 45 stakeholder connections. These projects had more than 10 stakeholders. There were over 45 subcontractor/component connections in 25.9% of the projects, also implying that these projects had more than 10 subcontracts/components. The results also showed that in 39.7% of the projects surveyed, there were more than 45 third party relation connections while there were more than 45 connections related to the layers in the organogram in 22.2% of the project surveyed.
Comparison of performance based on the number of connections was made using the CPI and SPI values. The results indicated that as stakeholder connections increased from 45 to above 90, cost performance dropped from 0.95 to 0.84 and schedule performance also dropped from 0.77 to 0.70. There was higher relative variability in both cost and schedule performance for the projects that had over 90 stakeholder connections. The results seem to indicate that as stakeholder connections increases, the level of risk in cost and schedule performance increases.
For the subcontractor component connectedness, the results indicated that as the number of connections increased, cost performance decreased from 0.92 (when the number of connections was below 45) to 0.82 (when the number of connections was above 90). However, schedule performance seemed to improve from 0.71 when the connections were below 45, to 0.76 when the number of connections is above 90. The values of coefficients of variation showed that cost and schedule performance risk seemed to increase as the number of subcontract/component connections increased.
On connectedness arising from third-party relationships, the results indicated that the mean cost performance dropped from a high of 0.9 when the connections were below 45 to a low of 0.88 when a number of connections were more than 90. Schedule performance results also showed a decrease (albeit slight) from 0.74 when the number of connections was below 45 to 0.73 when the number was above 90. The relative cost performance risk was higher when a number of connections moved from below 45 to above 90. However, the results showed that the schedule performance risk decreased from a high of 0.38 when the number of connections was below 45 to a low of 0.28 when the number of connections was above 90.
layers in the organogram increased, the risk of delivery within budget increased but the risk of delivery within schedule decreased. Table 4.1 summarizes project performance based on the aspects of connectedness.
Table 4.1: Mean Performance Based on Connectedness Aspect of Connectedness Descriptive
Statistics
No. of Connections
Below 45 Between 45-90 Above 90 CPI SPI CPI SPI CPI SPI Stakeholders Mean 0.95 0.77 0.98 0.75 0.84 0.70 Std Dev. 0.16 0.29 0.08 0.25 0.16 0.24 CV 0.17 0.38 0.08 0.33 0.19 0.34 Sub-contracts or components Mean 0.92 0.71 0.91 0.82 0.82 0.76 Std Dev. 0.15 0.26 0.10 0.24 0.24 0.30 CV 0.16 0.36 0.12 0.29 0.29 0.40 Third party relationships Mean 0.90 0.74 1.00 0.70 0.88 0.73 Std Dev. 0.15 0.29 0.07 0.25 0.19 0.20 CV 0.17 0.38 0.07 0.35 0.22 0.28 Layers in the organogram Mean 0.92 0.71 0.93 0.90 0.84 0.76 Std Dev. 0.15 0.26 0.18 0.14 0.20 0.25 CV 0.16 0.37 0.19 0.16 0.24 0.32 4.2Dependency
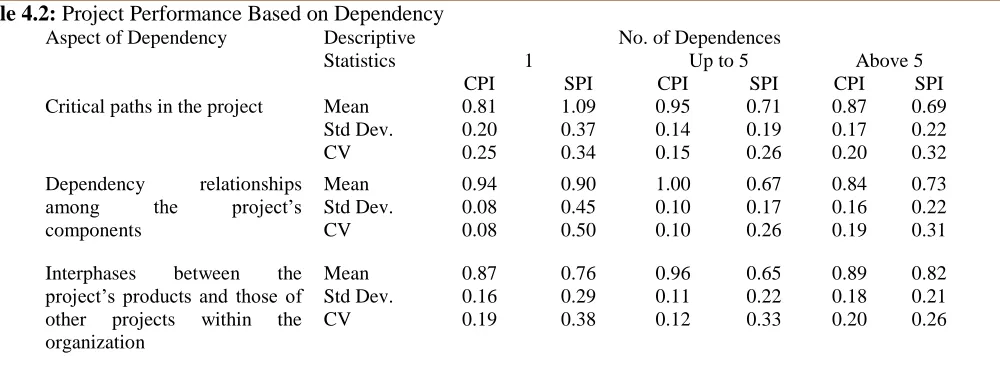
Dependency was measured using a Likert-type scale containing 3 items. Each of these items was scored on a scale of 1 to 3 with a score of 1 denoting low dependency and 3 denoting high dependency. The results indicated that of the projects surveyed, 11.1% had one critical path, 37% had up to 5 critical paths while 51.9% of the projects had more than 5 critical paths. In 14.8% of the projects there was one dependency relationship among the project components while in 29.6% of the projects, there were up to 5 dependency relationships. A total of 55.6% of the projects surveyed reported having more than 5 dependency relationships among the project components.
An aggregate 44.4% of the projects had one interphase between the project’s products and those of other projects within the organization while 37% of the projects reported having had up to 5 interphases between the project’s products and those of other projects within the organization. In 18.5% of the projects surveyed, there were more than 5 interphases between the project’s products and those of other projects within the organization.
Comparison of performance based on dependencies was made using the CPI and SPI values. The results indicated that projects that had more than one critical path recorded superior cost performance but schedule performance seemed to be a decreasing function of the number of critical paths in the project. However, relative variability in both mean cost and schedule performance seemed to decrease as the number of critical paths in the project increased.
Table 4.2: Project Performance Based on Dependency Aspect of Dependency Descriptive
Statistics
No. of Dependences
1 Up to 5 Above 5 CPI SPI CPI SPI CPI SPI Critical paths in the project Mean 0.81 1.09 0.95 0.71 0.87 0.69 Std Dev. 0.20 0.37 0.14 0.19 0.17 0.22 CV 0.25 0.34 0.15 0.26 0.20 0.32
Dependency relationships among the project’s components
Mean 0.94 0.90 1.00 0.67 0.84 0.73 Std Dev. 0.08 0.45 0.10 0.17 0.16 0.22 CV 0.08 0.50 0.10 0.26 0.19 0.31
Interphases between the project’s products and those of other projects within the organization
Mean 0.87 0.76 0.96 0.65 0.89 0.82 Std Dev. 0.16 0.29 0.11 0.22 0.18 0.21 CV 0.19 0.38 0.12 0.33 0.20 0.26
4.3System Dynamics
System dynamics was measured using a 6-item Likert type scale with five response choices for each item (1=strongly agree, 2=agree, 3=somewhat agree, 4=disagree, 5=strongly disagree) where the respondent was required to check one response for each item in the scale. A choice of 1 and 2 implied low system dynamics while a choice of 4 and 5 implied presence of high system dynamics. Borderline response (3) was not considered in further analysis.
The results indicated that 51.8% of the respondents agreed that there were only a few quality requirements that their project needed to conform that did not contradict each other. A total of 33.3% of the respondents disagreed with this statement. An aggregate of 25.9% of the respondents agreed that the deliverable(s) of their project utilized only a few technologies (e.g., electrical, mechanical, digital) while 59.2% of the respondents indicated that their projects utilized many technologies.
Of the 27 projects surveyed, 81.5% indicated having had a high level of confidence that the interconnected components of the project performed in a predictable manner, with 7.4% of the projects disagreeing. In 66.6% of the projects, all contracts related to the project were said to have been free of any financial, health or safety claims filed by suppliers, team members or customers. This was not the case for 29.6% of the projects surveyed. In 40.7% of the projects, project components were fabricated, pre-assembled and tested offsite before being used in the project, while in 55.5% of the projects all these were done on site. For 70.3% of the projects surveyed, materials were only brought on site when the site was ready to receive them. However, in 14.8% of the projects, materials were brought on site before the site was ready to receive them.
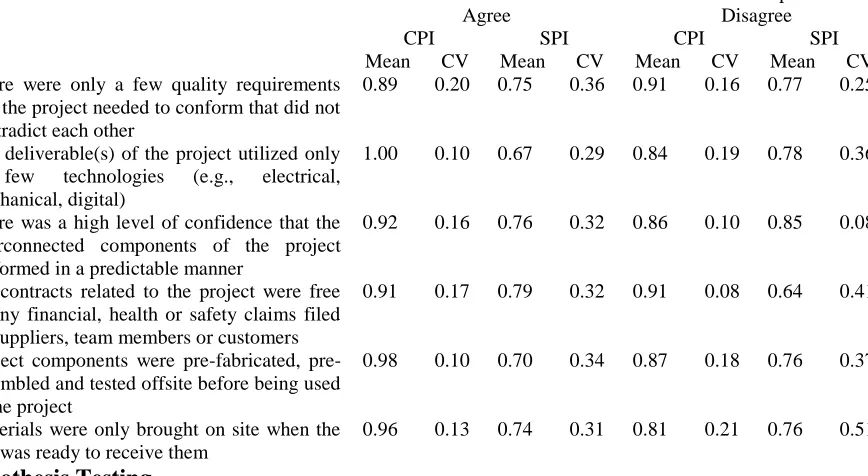
Cost and schedule performance indices were calculated to determine whether projects that had low system dynamics (agree/strongly agree on responses) performed differently when compared with the projects with high system dynamics (disagree/strongly disagree responses). The results are summarized in Table 4.3. These results indicated that projects in which there were only a few quality requirements that the project needed to confirm that did not contradict each other, had lower mean cost (0.89) and schedule (0.75) performance compared to those in which there were many quality requirements (CPI=0.91 and SPI=0.77). The mean cost and schedule performance for the projects in which there were only a few quality requirements that the project needed to confirm that did not contradict each other, were riskier when compared to the performance of those in which there were many requirements.
For projects in which there was a high level of confidence that the interconnected components performed in a predictable manner, mean cost performance was higher (CPI=0.92) but riskier (CV=0.16) compared with those that indicated to the contrary (CPI=0.86, CV=0.10). Schedule performance results for these projects indicate that mean performance increased with complexity and that this increased performance was relatively more stable (for Mean SPI, 0.85>0.76; for CV, 0.08<0.32).
Projects in which all contracts were free of any financial, health or safety claims filed by suppliers, team members or customers, recorded the same mean cost performance (but with higher risk) compared to projects with financial, health or safety claims. However, schedule performance for these projects decreased with increased claims and the overall stability of the mean schedule performance also went down.
Projects in which components were pre-fabricated, pre-assembled and tested offsite before being used in the project recorded both higher cost and schedule performance compared to those that indicated to the contrary. The relative variability in cost and schedule performance was lower in cases where components were pre-fabricated, pre-assembled and tested off-site. The results indicated that projects in which materials were only brought on site when the site was ready to receive them recorded superior performance in both cost and schedule compared to those indicating to the contrary. Even though the riskiness in cost performance was lower in cases where materials were only brought on site when the site was ready to receive them, schedule performance was riskier in these projects compared to those in which materials were brought on site earlier than required.
Table 4.3: Project Performance Based on System Dynamics
Item in the Scale Cost and Schedule Performance Based on Responses
Agree Disagree
CPI SPI CPI SPI
Mean CV Mean CV Mean CV Mean CV There were only a few quality requirements
that the project needed to conform that did not contradict each other
0.89 0.20 0.75 0.36 0.91 0.16 0.77 0.25
The deliverable(s) of the project utilized only a few technologies (e.g., electrical, mechanical, digital)
1.00 0.10 0.67 0.29 0.84 0.19 0.78 0.36
There was a high level of confidence that the interconnected components of the project performed in a predictable manner
0.92 0.16 0.76 0.32 0.86 0.10 0.85 0.08
All contracts related to the project were free of any financial, health or safety claims filed by suppliers, team members or customers
0.91 0.17 0.79 0.32 0.91 0.08 0.64 0.41
Project components were fabricated, pre-assembled and tested offsite before being used in the project
0.98 0.10 0.70 0.34 0.87 0.18 0.76 0.37
Materials were only brought on site when the site was ready to receive them
0.96 0.13 0.74 0.31 0.81 0.21 0.76 0.51
4.4Hypothesis Testing
To enable the use of system behavior and success scores in parametric tests (in this case, correlation and regression analysis), coefficients of skewness and kurtosis were determined to ensure that the data met the normality assumption of parametric tests. Skewness involves the symmetry of the distribution of the variable about its mean, whereas kurtosis involves the peakedness of probability distribution of a variable (Hassan, Bashir, & Abbas, 2017). The results showed that the Connectedness construct had a coefficient of skewness of 0.09 and kurtosis of 0.75. The Dependency construct scores had a coefficient of skewness of -0.46 with kurtosis of -0.65 while System Dynamics scores had a skewness of 0.45 and kurtosis of 0.30. The overall system behavior scores had a coefficient of skewness equal to 0.43 and kurtosis of 0.27. All these coefficients were within the acceptable -1 to +1 range for skewness and -2.2 to +2.2 for skewness (Sposito, Hand, & Skarpness, 1983). Thus, the data were passed the normality test for parametric analysis.
heteroskedasticity. The results indicated that there was no serial correlation in the data used to conduct regression analysis given a Durbin-Watson statistic value less than 2. Collinearity was tested using the Tolerance and VIF statistics. The results indicated that the VIF was equal to 1, a value much lower than 4 which is used as the threshold to indicate multicollinearity particularly in small samples (O’Brien, 2007). The problem of heteroscedasticity was checked using residual statistics plotted on a scatter diagram. The results indicated that almost all the residuals had a mean of 0.000 and approximately equal spread implying that the data was good for OLS regression analysis.
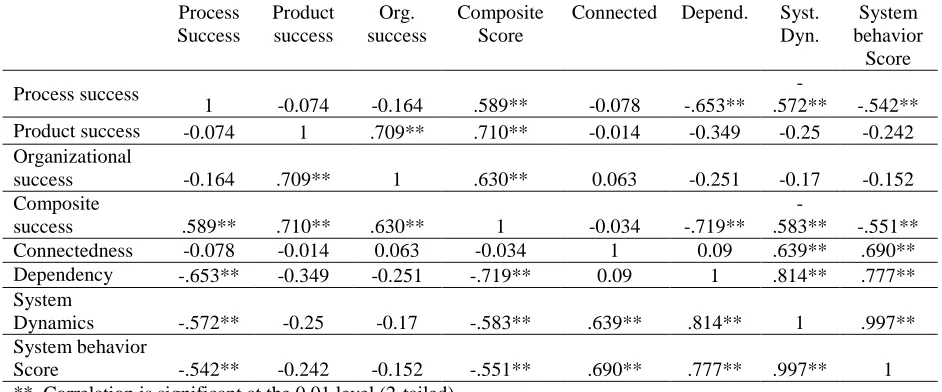
To test the hypothesis that system behavior has a significant influence on the success of public infrastructural projects, the scores of the system behavior constructs were first correlated with those of project success to determine if they had any association. The results showed that at 99% confidence level, both dependency and system dynamics had a significant negative correlation with process success (0.653 and r=-0.572, respectively). The overall system behavior had a significant negative correlation with both process success and overall success (r=-0.542 and r=-0.551, respectively). Both dependency and system dynamics were negatively correlated with overall success, and this relationship was significant (r= -0.719 and r=-0.583, respectively). The results also showed that system dynamics is positively correlated with dependency and connectedness. Table 4.4 summarizes the correlation coefficients.
Table 4.4: Correlation between System Behavior and Success
Process
Success
Product success
Org. success
Composite Score
Connected Depend. Syst. Dyn.
System behavior
Score
Process success
1 -0.074 -0.164 .589** -0.078 -.653**
-.572** -.542** Product success -0.074 1 .709** .710** -0.014 -0.349 -0.25 -0.242 Organizational
success -0.164 .709** 1 .630** 0.063 -0.251 -0.17 -0.152 Composite
success .589** .710** .630** 1 -0.034 -.719**
-.583** -.551** Connectedness -0.078 -0.014 0.063 -0.034 1 0.09 .639** .690** Dependency -.653** -0.349 -0.251 -.719** 0.09 1 .814** .777** System
Dynamics -.572** -0.25 -0.17 -.583** .639** .814** 1 .997** System behavior
Score -.542** -0.242 -0.152 -.551** .690** .777** .997** 1 **. Correlation is significant at the 0.01 level (2-tailed).
The causal relationship between system behavior and success of megaprojects was tested using OLS linear regression at the 95% confidence level. The results indicated that the overall model had a 30.4% predictive power (R2=0.304), implying that system behavior explained 30.4% of the variability in the success of megaprojects. ANOVA results showed that the overall model was significant with F(1,25)= 10.902 and P-Value<
.
Based on the findings, the regression equation was presented thus:
i
PS =6.0120.551SBi
s( )
i
b =(0.404) (0.080)
t (14.875) (-3.302) R2 0.304
Where s( )
i
b
is the standard error of the beta estimate.
2
The results showed that at 95% confidence level, the s( )
i
b ˂
2
i
b
for both the intercept and the slope of the
equation. Thus, following Koutsoyiannis (1992), the null hypothesis that b0 b1 0 was rejected and a conclusion made that the betas were significant. The results showed that the slope was significant, implying that a one unit increase in the system behavior score reduced project success by 0.551. Thus, the research hypothesis that system behavior has a significant influence on the success of public infrastructural megaprojects was accepted.
4.5 Discussion
Systemicity arising from connectedness has been shown to be associated with project outcomes, mostly failure to meet cost and schedule objectives. The number of stakeholder connections can be an indicator of the potential number of communication channels on a project, and an indicator of the complexity of communications (PMI, 2013), which is generally associated with negative outcomes (Remington & Zolin, 2011). In agreement with the propositions of normative theory on the effects of complexity on project outcomes, this study found that projects with fewer channels of communication (given the stakeholder connections) had superior cost and schedule performance compared to those with many channels of communication.
The number of critical paths in a project may determine the governance structure of a project and thus shape its management and control needs. According to the structural contingency theory, project structure could affect its outcomes in such a way that properly designed structure to deliver complexity that arises due to the number of critical paths may lead to better project outcomes. The findings of this study support this view given that the coefficients of variation for both cost and schedule performance went down as the number of critical paths increased. However, this finding does not support the postulation of normative literature that the percentage of work packages that have no float or have multiple or parallel critical paths are especially sensitive to failure (PMI, 2014).
Dependency determination enables the team to identify threats to the project plan so that ways of dealing with those threats can be designed into the project during planning. Being either systems or system of systems, the projects surveyed in this study had several components with dependencies. Some of those dependencies were mandatory or discretionary while others were external or internal to the project. The number of dependency relationships among the project’s components increases with the complexity of the projects. This study established that cost and schedule delivery decreased with the number of dependency relationships among project components. The implication of this is that increased systemic arising from the number of dependency relationships reduced the chances of cost and schedule delivery.
Interphases between the project’s products and those of other projects within the organization should be clearly mapped out to ensure proper prioritization and alignment of organizational as well as project resources. Misalignment may result in conflicting priorities and direction for the project team (PMI, 2014) which could impact project outcomes. This is compounded in a situation where there are many interphases. In attestation, the results of this study showed that both cost and schedule performance improved with an increased number of interphases between the project’s products and those of other projects within the organization.
Multiple quality requirements for the project’s products require multiple acceptance criteria and methods for their validation, verification, and final acceptance. Connectedness of, and interdependence among, the various quality requirements and acceptance criteria and methods may operate in such a way as to cause interactions that could affect project outcomes. As illustrated by the findings of this study, an inherent multiplicity of requirements actually affected the sensitivity of cost and schedule performance in such a way that as quality requirements increased, cost and schedule performance became more stable.
project baselines that may accompany such integration. Without such a system, the rate of changes to the project could exceed the rate of progress thus pushing the project to uncontrolled changes. Indeed, as the findings of this study illustrated, the use of more technologies on a project was associated with increased cost and schedule performance risk as seen from the values of the coefficients of variation.
Where the interconnected components of the project do not perform in a predictable manner, the emerging uncertainty increases dynamic complexity which in turn could affect project outcomes (PMI, 2014). As illustrated by the findings of this study, unpredictability in the manner in which the interconnected components operate is associated with low relative variability in project cost and schedule performance.
A key approach to dealing with risks due to progressive elaboration is to pre-fabricate, pre-assemble, and pretest components before using them on the project. This approach does not only ensure that quality is designed into the project but also minimizes chances of rework, rejects or off-specification. As Brady and Davis (2014) have shown, this approach does improve cost and schedule delivery. In support of this, this study found that cost and schedule performance indices were more stable where project components were pre-fabricated, pre-assembled and tested offsite before being used in the project. Construction sites are usually constrained for space. Some of the materials used are high-value items that may not be stocked for long without considerable risk of pilferage. Yet, other items such as cement are perishable and require to be stocked just in time. The implication here is that the project procurement function must ensure a seamless flow of materials and other stock items. Just-In-Time stocking of materials ensures economical use of site space and avoids tying too much money into a stock that may not be currently required. As the results of this study showed, this practice was associated with superior and more stable cost and schedule performance.
5. Conclusion and Recommendation
The results of this study led to a conclusion that system behavior has a significant influence on the success of public infrastructural megaprojects. The overall relationship was such that, ceteris paribus, when complexity arising from system behavior went up by one unit, the overall project success went down by a coefficient of 0.551. Thus, system behavior had an overall negative influence on the success of infrastructural megaprojects. Systemicity arising from connectedness appeared to influence success in such a way that the cost and schedule performance risk increased as the number of stakeholder and component connections increased. Interestingly, connectedness arising from third-party relationships and number of layers in the organogram increased cost performance risk when the number of connections increased but reduced schedule performance risk when those connections increased.
Systemicity arising from dependencies influenced success in such a way that as the number of critical paths and dependency relationships among project components increased, cost and schedule performance risk decreased. However, as the dependency arising from interfaces between the project’s products and those of other projects within the organization increased, cost performance risk increased but schedule performance risk reduced. The mean cost and schedule performance for projects in which there were only a few quality requirements that the project needed to confirm that did not contradict each other, were riskier when compared to the performance of those in which there were many requirements. The relative variability in cost and schedule performance was lower in cases where components were pre-fabricated, pre-assembled and tested off-site. Projects in which materials were only brought on site when the site was ready to receive them recorded superior performance in both cost and schedule compared to those in which materials were stocked way before their use.
This could require a shift from the current preference for outcome-based contracting to behavior-based contracting.
REFERENCES
i. Ahiaga-Dagbui, D.D., Love, P.E.D., Smith, S.D., & Ackermann, F. (2017). Toward a Systemic View to Cost Overrun Causation in Infrastructure Projects: A Review and Implications for Research. Project Management Journal, 48(2), 88-98.
ii. Atkinson, R. (1999). Project management: Cost, time and quality, two best guesses and a phenomenon, it is time to accept other success criteria. International Journal of Project Management, 17(6), 337-342. iii. Avolio, B.J., Walumbwa, F.O., & Weber, T.J. (2009). Leadership: Concurrent theories, research and
future directions. Annual Review of Psychology, 60(1), 421-449.
iv. Baccarini, D. (1999). The logical framework method of defining project success. Project Management Journal, 30(4), 25-32.
v. Bannermann, P.L. (2008). Defining project success: A multilevel framework. In Proceedings of the PMI Research Conference (pp. 1-14). Newton Square, PA: Project Management Institute.
vi. Brady, T., & Davies, A. (2014). Managing Structural and Dynamic Complexity: A Tale of Two Projects. Project Management Journal, 45(4), 21-38.
vii.Bruzelius, N., Flyvbjerg, B., Rothengatter, W. (2002). Big decision, big risks. Improving accountability in mega projects. Transport Policy, 9(2), 143–154.
viii. Bryman, A., & Bell, E. (2007). Business Research Methods (2nded.). New York, United States: Oxford University Press Inc., p. 55.
ix. Caldart, A. A., & Joan, E. R., (2004). Corporate Strategy Revisited: A View from Complexity Theory. European Management Review, 1(1).
x. Collyer, S. (2016). Culture, Communication, and Leadership for Projects in Dynamic Environments. Project Management Journal, 47(6), 111–125.
xi. Connelly, L. M. (2008). Pilot studies. Medsurg Nursing, 17(6), 411-412.
xii.Cooke-Davis, T. (2011). Complexity in Project Management and the Management of Complex Projects. In T. Cooke-Davis, L. Crawford, & C. Stevens (Eds.), Aspects of Complexity: Managing projects in a complex world (pp 1-13). Pennsylvania, USA: Project Management Institute.
xiii. Cooke-Davies, T., Crawford, L., & Stevens, C. (Eds.). (2011). Aspects of Complexity: Managing projects in a complex world. Pennsylvania, USA: Project Management Institute.
xiv.Cronbach, L.J. (1951). Coefficient alpha and the internal structure of tests. Psychometrika, 16(3), 297-334.
xv. de Wit, A. (1988). Measurement of Project success. Project Management Journal, 6(3), 164-170.
xvi.Duimering, P.R., Ran, B., Derbentseva, N., & Poile, C. (2006). The Effects of Ambiguity on Project Task Structure in New Product Development, Knowledge and Process Management, 13(4), 239-251.
xvii. Flyvbjerg, B. (2014). What You Should Know About Mega Projects and Why: An Overview. Project Management Journal, 45(2), 6-17.
xviii. Flyvbjerg, B., (Ed.). (2014). Megaproject planning and management: essential readings. Cheltenham, UK: Edward Elgar.
xix.Flyvbjerg, B., Bruzelius, N., & Rothengatter, W. (2003). Mega projects and Risk: An anatomy of ambition. Cambridge, England: Cambridge University Press.
xx. Flyvbjerg, B., Garbuio, B., & Lovallo, D. (2009). Delusion and deception in large infrastructure projects: Two models for explaining and preventing executive disaster. California Management Review, 51(2), 170-193.
xxii. Flyvbjerg, B., Holm, M.K.S., & Buhl, S.L. (2004). What causes cost overrun in transport infrastructure projects? Transport Reviews, 24 (1), 3-18.
xxiii. Flyvbjerg, B., Holm, M.K.S., & Buhl, S.L. (2002). Underestimating costs in public works projects: Error or lie? Journal of American Planning Association, 68(3), 279-295.
xxiv. Gauthier, J-B., & Ika, L.A. (2012). Foundations of Project Management Research: An Explicit and Six-facet Ontological Framework. Project Management Journal, 43(5), 5-23.
xxv. Geraldi, J., Maylor, H., & Williams, T. (2011). Now, let's make it really complex (complicated): A systematic review of the complexities of projects. International Journal of Operations & Production Management, 31(9), 966 – 990.
xxvi. Ghosh, P., Williams, D., Askew, P., & Mulgund, V. (2012). Organizations and leaders make or break projects. Energy Perspectives, (Summer), 20-27.
xxvii. Goldkuhl, G. (2012). Pragmatism vs interpretivism in qualitative information systems research. European Journal of Information Systems, 21(2), 135-146.
xxviii. Government of Kenya. (2013). Second Medium Term Plan, 2013-2013. Kenya Vision 2030: Author.
xxix. Hair, J.F., Babin, B., Money, A., & Samouel, P. (2003). The essentials of business research methods. London: Wiley.
xxx. Hair, J.F., Anderson, R.E., Tatham, R.L., & Black, W. C. (1998). Multivariate data analysis. Englewood Cliffs, NJ: Prentice Hall.
xxxi. Hoegl, M., & Gemuenden, H.G. (2001). Team work quality and the success of innovative projects: A theoretical concept and empirical evidence. Organization Science, 12(4), 435- 449. xxxii. Ika, L.A. (2009). Project success as a topic in project management journals. Project
Management Journal, 40(4), 6-19.
xxxiii. Jugdev, K., & Muller, R. (2005). A retrospective look at our evolving understanding of project success. Project Management Journal, 36(4), 19-31.
xxxiv. Kahneman, D., & Tversky, A. (1979). Intuitive prediction: biases and corrective procedures. In S. Makridakis, & S. C. Wheelwright (Eds.), Studies in the Management Sciences: Forecasting, 12. North-Holland, Amsterdam, pp.313–27.
xxxv. Kellert, S. H. (1993). In the Wake of Chaos: Unpredictable Order in Dynamical Systems. University of Chicago Press.
xxxvi. Koutsoyiannis, A. (1992). Theory of Econometrics (2nd ed.). Hong Kong: Macmillan Education. xxxvii. Li, L., & Zigrid, N. (2006). The accuracy of risk-based cost estimation for water infrastructure
projects: preliminary evidence from Australian Projects. Construction management and Economics (January 2010) 28, 89-100.
xxxviii. Likert, R. (1931). A technique for the measurement of attitudes. Archive of psychology, 22(140), 1-55.
xxxix. Lim, C. S., & Mohamed, M.Z. (1999). Criteria of project success: An exploratory re-examination. International Journal of Project Management, 17(4), 243-248.
xl. Liu, L., & Leitner, D. (2012). Simultaneous Pursuit of Innovation and Efficiency in Complex Engineering Projects-A Study of the Antecedents and Impacts of Ambidexterity in Project Teams. Project Management Journal, 43(6), 97-110.
xli.Livari, J., & Huisman, M. (2007). The Relationship Between Organizational Culture and the Deployment of Systems Development Methodologies. MIS Quarterly, 31(1), 35-58.
xlii. Loch, C.H., De Meyer, A., & Pich, M.T. (2006). Managing the unknown: A new approach to managing high uncertainty and risk in projects. Hoboken, NJ: John Wiley and Sons.
xliv. Love, P.E.D., Sing, C.-P., Wang, X., Irani, Z., & Thwala, D.W. (2012). Overruns in Transportation Infrastructure Projects. Structure and Infrastructure Engineering, 10(1), 141-159.
xlv.Lucas, T. (2009). Quantifying complexity. Website. www.calresco.org/lucas/quantify.htm. March 2015. xlvi. Markus, M.L., & Mao, J.Y. (2004). Participants in development and implementation-Updating
an old tired concept for today’s IS contexts. Journal of the Association for Information Systems, 5(11-12), 514-544.
xlvii. Maylor, H., Vidgen, R., & Carver, S. (2008). Managerial Complexity in Project based Operations: A grounded model and its implications for practice. Project Management Journal, 39(1), 15-26.
xlviii. McLeod, L., Doolin, B., & MacDonell, G. S. (2012). A Perspective-Based Understanding of Project Success. Project Management Journal, 43(5), 68-86.
xlix. Meyer, W. G. (2014). The Effect of Optimism Bias on the Decision to Terminate Failing Projects. Project Management Journal, 45(4), 7-20.
l. Neuman, W.L. (2003). Social research methods: Qualitative and quantitative approaches, (5th ed.). Upper Saddle River, NJ: Pearson Education.
li. Nunnally, J.C. (1978). Psychometric Theory (2nded.) New York, NY: McGraw-Hill.
lii. O’Brien, R.M. (2007). A Caution Regarding Rules of Thumb for Variance Inflation Factors. Quality and Quantity, 41(5), 673-690.
liii.O’Donnell, J.G. (2010). A study of the relationships among project managers’ leadership practices, project complexity, and project success.East Eisenhower Parkway, USA:UMI Dissertation Publishing. liv.Olaniran, O.J., Love, P.E.D., Edwards, D., Olatunji, O.A., & Mathews, J. (2015). Cost Overruns in
Hydrocarbon Megaprojects: A Critical Review and Implications for Research. Project Management Journal, 46(6), 126-138.
lv. Papadopoulos, T., Ojiako, U., Chipulu, M., & Lee, K. (2012). The Criticality of Risk Factors in Customer Relationship Management Projects. Project Management Journal, 43(1), 65-75.
lvi.Pinto, J. K., & Slevin, D.P. (1988a). Project Success: Definition and Measurement Techniques. Project Management Journal, 19, 67-71.
lvii. Pinto, J. K., & Slevin, D.P. (1988b). Critical Success Factors in Effective Project Implementation. In D. I. Cleland & W.R. King (Eds.), Project Management Handbook, (2nd ed., pp. 479-512). New York: Van Nostrand Reinhold.
lviii. Pinto, J. K., & Slevin, D.P. (1986). The Project Implementation Profile: New Tools for Project Managers. Project Management Journal, 17(4), 57-70.
lix.Project Management Institute. (2013). A Guide to the Project Management Body of Knowledge (5th ed.). Pennsylvania, USA: Author.
lx. Project Management Institute. (2014). Navigating Complexity: A Practice Guide. Pennsylvania, USA: Author.
lxi.Remington, K., & Pollack, J. (2011). Tools for complex projects. In T. Cooke-Davies, L. Crawford, & C. Stevens, (Eds.), Aspects of Complexity: Managing Projects in a Complex World, (pp. 29-38). Pennsylvania, USA: Project Management Institute.
lxii. Remington, K., & Zolin, R. (2011). Controlling Chaos? The Value of the Challenges of applying complexity theory to project management. In T. Cooke-Davies, L. Crawford, & C. Stevens, (Eds.), Aspects of Complexity: Managing Projects in a Complex World, (pp. 115-128). Pennsylvania, USA: Project Management Institute.
lxiii. Shenhar, A. J., & Dvir, D. (2007a).Reinventing project management: the diamond approach to successful growth and innovation. Boston, MA: Harvard Business School Press.
lxv.Shenhar, A.J., Dvir, D., Levy, O., & Maltz, A.C. (2001). Project success: A multidimensional strategic concept. Long Range Planning, 34(6), 699-725.
lxvi. Shore, B. (2008). Systematic Biases and Culture in Project Failure. Project Management Journal, 39(4), 5-13.
lxvii. Snowden, D. J., & Boone, M. E. (2007). A Leader’s Framework for Decision Making. Harvard Business Review, 85(11), 68-76.
lxviii. Spector, P. (1992). Summated rating scale construction. Thousand Oaks, CA: SAGE.
lxix. Sposito, V., Hand, M., & Skarpness, B. (1983). On the Efficiency of Using the Sample Kurtosis in Selecting Optimal Ipestimators. Communications in Statistics, Simulation and Computation, 12(3), 265-272.
lxx.Swartz, S.M. (2008). Managerial Perceptions of Project Stability. Project Management Journal, 39(4), 17-32.