Inzinerine Ekonomika-Engineering Economics, 2019, 30(3), 316–325
Testing Nonlinear Dynamics in Terms of Trade with Aggregated Data: Implications
for Economic Growth Models
Marinko Skare
1, Daniel Tomic
2, Malgorzata Porada – Rochon
31,2Juraj Dobrila University of Pula Preradovica 1/1, 52 100 Pula, Croatia E-mail. [email protected], [email protected]
3University of Szczecin
Cukrowa ul.8, 71-023 Szczecin, Poland E-mail. [email protected]
http://dx.doi.org/10.5755/j01.ee.30.3.23446
For many decades, world trade has grown on average nearly twice as fast as total world output. International trade flows have exploded since the 1980s, however high and middle-income countries continue to make up the main players in international trade. Favourable movements in global export prices lead to similar movements in terms of trade in developed and developing countries, but it still has not stopped the latent deterioration of the terms of trade of undeveloped countries. Though we can detect general convergence in the dynamics and lower volatility of the terms of trade, this still does not explain the evolution of the terms of trade. We still have to asses if the movements in this variable are random. This paper examines long time aggregated series data (1960–2015) of the terms of trade for the variety of (grouped) countries to find out if there are any signs of nonlinearity in these series. Finding evidence of nonlinearity suggests that economic models that include terms of trade can improve by switching from linear to nonlinear modelling strategy. For this purpose, we use BDS nonparametric test as it is one of the most popular tests for nonlinearity. We can use it as a portmanteau test or miss-specification test when applied to the residuals from a fitting model. The results reject the nonlinearity presumption going in favour of linear behaviour of the terms of trade.
Keywords: International Trade Dynamics; Terms of Trade; Nonlinearity; BDS Test; Univariate Analysis; Country Groups.
Introduction
Periods of moderate growth performances of developed countries and impressive growth rates in some emerging countries have been seriously threatened by recent financial turmoil, as the momentum of a real economic recovery is not yet in sight. However, when we look at the trade statistics, we can notice tremendous results. International trade has reached 18.26 trillion USD in 2011, increasing almost threefold since 2002, and when considered in volume terms world trade recorded more than four-fold increase between 1980 and 2011. A large share of the increase in international trade goes to developing countries. High and middle-income countries hence developed and developing countries continue to have a leading role, while low-income countries’, including those least developed, participation in world trade remains limited, albeit with increasing tendencies (UNCTAD, 2013). Many factors have contributed to this impressive expansion of trade. Easy financial conditions (banks liquidity and stable inflation rates, decreases in transport and communication costs), trade liberalization and geopolitics facilitated are among them. Manufactured goods increasingly dominate the composition of exports in developing countries. The fact that their major trading partners continue to be the developed countries remains. Most of the countries differ in the extent of international trade and financial position as some countries that have opened their trade accounts have kept different degrees of control over their capital accounts.
spikes at the time of World War I, again in the 1970s and most recently since 2000 are more than clear (Hallam, 2018).
Though today we detect general convergence in the dynamics and lower volatility of the terms of trade, this still does not explain the evolution of the terms of trade, thus whether the movements in this variable have been random. This paper examines aggregated time series data (for the period 1960–2015) of the terms of trade for the variety of countries (grouped by different aspects: geography, income, membership in different international organizations) to find out if there are any signs of nonlinearity in these series. If we find evidence of nonlinearity, this suggests that economic models that include terms of trade could be improved by switching from linear to nonlinear modelling strategy. For this purpose, we use BDS nonparametric test as it is one of the most popular tests for the nonlinearity that can be used as a portmanteau test or miss-specification test when applied to the residuals from a fitting model. Results reject the nonlinearity presumption going in favour of linear behaviour of the terms of trade.
Literature Review
Much of the contemporary literature analyzes the relationship between terms of trade and other macroeconomic variables (especially economic growth1) based on the cross-country evidence, but there is a paucity of studies that deal with terms of trade through univariate analyses. The number of papers that are, at least, indirectly related to nonlinear behaviour of terms of trade is even smaller. For example, Jerzmanowski (2006) following Markov switching logic for 89 countries in 32 years found switching among growth regimes (miracle growth, stable growth, stagnation, and crisis) based on the severity of terms of trade shocks, which is mainly determined by the quality of institutions. Berg Ostry and Zettelmeyer (2006) analysed so-called ‘growth spells’ as the period of acceleration and deceleration in growth by observing 140 countries through panel data analysis and found that external shocks, such as in terms of trade are negatively associated with growth spells, but their overall importance is small. Empirical facts suggest that it is crucial to monitor the process of terms of trade, i.e., its process changes since terms of trade can have low- and high-frequency fluctuations and in that manner shift in a regime. This shift could also be a significant factor in assessing growth regimes turning points to higher or lower levels of growth in a nonlinear manner. Tomic (2016) found evidence of nonlinearity in the income terms of trade variable for Croatia (2000–2014) and identified two distinct levels in the data using Markov switching approach with time-varying transition probabilities. Takala and Viren (1995) tested the nonlinear dynamics of ten Finnish macroeconomic series (including terms of trade) covering the period 1920–1994 with test (set of tests for nonlinearities such as BDS test, Lyapunov exponents, Hurst exponents) results unambiguously supporting the notion of nonlinearities in the data.
1 For a more in-depth insight into this topic see Skare, Simurina, and Tomic
(2012).
Using cross-country time-series (panel) data, based on five-year non-overlapping panel data according to 175 countries during 1980 to 2010 Brueckner and Carneiro (2018) analysed the effects that terms of trade volatility on real gross domestic product (GDP) per capita growth. The research results confirm that terms of trade volatility have significant adverse effects on economic growth in countries with procyclical government spending, but at the same time, this relationship has no significant effect of economic growth according to countries where government spending is countercyclical.
A parallel strand of studies also using multi-country analysis (selected ASEAN countries) by applying a panel cointegration method was done by Conduah and Yoo (2018). They found that fluctuations in oil price and non-fuel raw material price index have caused terms of trade volatility, which limits economic growth. Price convergence between the countries also plays an important role in terms of trade (Liu et al., 2018).
The same goal was searched by Jawaid and Raza (2015) according to China using annual time series data over the period 1980–2010. By applying Autoregressive distributed lag (ARDL) cointegration and Johansen and Juselius cointegration methods, they found the significant negative long-run relationship of terms of trade and volatility of terms of trade with economic growth. Jebran et al. (2018) tested the effect of terms of trade on the economic growth of China between 1980–2013. They applied the autoregressive distributed lag (ARDL) and Granger causality test. Their result is the same as Jawaid and Raza in long-run but also in short-run.
Karama and Zaki (2015) searched for macroeconomic and sectoral effects of goods and service trade on the economic performance of MENA countries over the period 1960–2011. Their research results confirm relations between real GDP and both service trade on real GDP is positive.
Inzinerine Ekonomika-Engineering Economics, 2019, 30(3), 316–325
causality tests to study the nexus between stock market depth, economic growth, trade openness, and foreign direct investment in 25 ASEAN regional forum (ARF) countries 1961–2012. The research results indicated that there is a long-run equilibrium relationship among these variables, but the nature of the causal relationship is complex and differ in results in short and long-run. Quite similar research was done by Lal (2017) in China, India, and Mexico over the period 1980–2011. The study estimates the VAR or VECM of these three variables. The research results showed the existence of long-run causal relationships between the three variables for China and Mexico.
To our knowledge, our paper is the first study to investigate the possibility of nonlinear dynamics of terms of trade on a cross-country scale. For that purpose, we used the BDS test, developed within chaos theory, which became one of the most popular tests for nonlinearity. Interesting empirical studies that used BDS test are Akintunde, Oyekunle and Olalude (2015), Bisaglia and Gerolimetto (2014), Vlad and Pentiuc (2009), Peǹa and Rodriguez (2005), Zhang (2002), Koller and Fischer (2001), Brooks (1996), Takala and Viren (1995).
Terms of Trade as Relevant Economic Variable
Terms of trade ratio became an essential explanatory variable in macroeconomics and international economics since its improvement can contribute to economic stability and long-term growth through efficient resource allocation and diminution of inflationary pressures. While positive movements in terms of trade could increase domestic purchasing power and real income, significant terms of trade shocks can lead to macroeconomic instability. Terms of trade dynamics also appear to play a role in explaining the turning points in growth accelerations. Different terms of trade measurements are often used for economic monitoring, as they sometimes present it as an indicator of a country’s economic health. It closely relates the point of understanding the international financial position and trade to the comprehension of the terms of trade. Growth economists have discovered a profound impact in terms of trade changes on economic growth, especially in developing countries. Terms of trade, and the terms of trade volatility, can have a critical impact on economic growth. Both real import and export solidly depend on exchange rate or terms of trade, and their developments (Tomic, 2016). Changes in terms of trade occur, last over time as shocks, trend and have substantial repercussions; the analysis of the dynamics of evolution of terms of trade throughout history could be of great help in understanding the dynamics of international trade.
Many factors contributed to different dynamics of terms of trade. A steady decline in North-North trade and the rising share of South-South trade in world export, few large economies still dominate international trade, fluctuations in world commodity prices and changes in the composition of trade (within intra-industry trade). Trade in commercial services (when measured in value-added rather than gross terms, services appear to play a more significant role in
2 The majority of the systems in nature have a nonlinear behaviour,
which is the opposite of the idealized linear behaviour. So it became
international trade), an overall decrease in countries specialization, globalized world vs. regionalized world (trade flows between regions are rising again), trade is concentrating in the hands of few global companies, a significant decline in transport and communication costs (WTO, 2013). Structural breaks clear over the whole post World War II period also suggest that high prices are accompanied by heightened price volatility. For most of the 20th-century commodity prices and manufactures prices moved together, but that pattern was disrupted in the 1980s with the series diverging as commodity prices slumped until the upswing in commodity prices in mid-2000s (Hallam, 2018). However, clear distinct dynamics between different economies and a different group of economies suggested a different story behind each country or a group of countries. For example, if the intense (liberalized) trade lead to commodity price equalization, it could subsequently lead to factor price equalization (based on the price equalization theorem; see Helpman & Krugman, 1985).
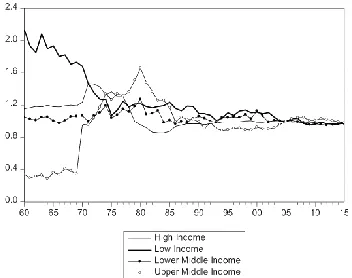
As we can notice from Figure 1, divergent dynamics in terms of trade between selected groups of countries ended with the effect of the oil price spike in the mid-1970s and with a general decline in terms of trade which was followed by a commodity price boom that lasted till the start of the 1980s. From that point, we can notice a similar relative trend in terms of trade across all groups. However, when we observe those groups of countries selectively, their dynamics seem somewhat different, following different trends that could be random but also could arise from some not random background. We can observe it in the variable's volatility when we split the period of observation in two parts; before and after the 1980s. Namely, average level and standard deviations of the terms of trade across the group of countries and the decades vary, especially till the mid-1980s. Much monetary time series such as relative prices, terms of trade, changes in price levels and money aggregates show a nonlinear behaviour. Prices are often more volatile than the real series, therefore could adjust asymmetrically to some shocks (Takala & Viren, 1995). For the purpose of macroeconomic modelling, it would be important to detect whether there is a nonlinearity in the variable terms of trade, for it could guide against model mis-specification by using linear modelling.
Utilization of the BDS Test
Method
Linear models, being simple and intuitive, have been a part of theoretical and applied economics and econometrics for most of the 20th century with only in the last two decades that nonlinear models were getting attention, owing it to the economic theory that frequently suggested the possibility of nonlinear relationships between economic variables (Bisaglia & Gerolimetto, 2014). It resulted in testing whether a linear model may generate a single economic series or group of the series against the alternative they were non-linearly related instead. The birth of a nonlinear time series model arises from natural sciences.2
Linear models are limited in explaining economic circumstances because of several facts. Referring to Zhang (2002), with the linearity assumption, the stationary solution to time series converges to a constant point as time goes to infinity, so it is hard to use linear time series models to describe limit cycles. The joint distribution of linear models is symmetric; therefore, they may not be suitable for strongly asymmetric data. Linear models are not ideally suited for data exhibiting sudden bursts of substantial amplitude at irregular time epochs (Zhang, 2002). For
Figure 1. Terms of Trade; Countries Grouped by Income (1960–2015) Source: World Bank (2018)
Example, the existence of nonlinearities in the formation of economic series is usual in financial economics. In particular, the stock market is characterized by high complexity in its function, having as a result high-level dynamical noise. That implies that linear models cannot be used for describing the formation of stock prices. The evidence of nonlinearity is compelling for the unemployment variable (see Zhang, 2002). We often relate nonlinearity to chaos theory based on the assumptions that the underlying system is a nonlinear process, and a deterministic system. To decide whether we should apply the methods of nonlinear time series analysis, first stage that must be carried out is to test for nonlinearity. If we find the time series to have an underlying stochastic dynamic, we reject the chaotic hypothesis. A frequently used test is the BSD test (Vlad & Pentiuc, 2009).
BDS test was initially developed in 1987 and in time became a powerful tool for detecting serial dependence in a time series (see Brock, Dechert & Scheinkman, 1996). It tests the null hypothesis of independent and identically distributed data, i.e., iid (by estimating the correlation integral at various embedding dimensions) against an unspecified alternative through nonparametric technique. Test cannot monitor chaos directly, but only nonlinearity provided that we have removed any linear dependence from the data by using traditional ARIMA-type models or taking the first difference of natural logarithms. Before the BDS test, to increase the relevance of the test, the time series should be detrended and to eliminate autocorrelation the time series must be first differenced. The advantage of the BDS test is that it is static which requires no distributional assumption on the data to be tested. Next, this test is robust to random variables which do not possess high-order movements. The additional advantage of the BDS test is that when applied to model residuals, the first order asymptotic
distribution of BDS statistic is independent of estimation errors under certain sufficient conditions. For linear additive models or models that can be transformed into that format, the BDS test is a nuisance parameter free and requires none adjustment when applied to fitted model residuals. Therefore, the BDS test can test for nonlinearity, or model mis-specification. This nonparametric statistical method requires very weak population assumption (enabling the study of chaos and linear time series models with the same tool) which come to a price because nonparametric statistics converge at a slower rate than parametric statistics, with the rate of convergence depending on dimensions (Mizrach, 1995).
We base our demonstration of the BDS test on the description from Bisaglia and Gerolimetto (2014). First, we define two distinct hypotheses; H0: the data are
independently and identically distributed (idd) and H1: the
data are not idd, which implies that the time series is non-linearly dependent (if first differences of the natural logarithm have been taken). Next, we can execute the BDS test. The BDS statistics is based on the correlation integral, a measure of the number of times with which temporal pattern is repeated in the data. Given a time series Xt, t = 1,
2…, n and define its m-history as Xtm = (xt, xt-1,…, xt-m+1),
the correlation integral at the embedding dimension m is:
𝑐𝑚,𝑇(𝜀) = ∑𝑡<𝑠𝐼𝜀(𝑋𝑡𝑚, 𝑋𝑆𝑚) {
2
𝑇𝑚(𝑇𝑚−1)} (1)
where Tm= T − (m − 1)and IXtm,Xsmis an indicator function which equals 1 if the sup norm ‖𝑋𝑡𝑚− 𝑋𝑠𝑚‖ < ε
and equals 0 otherwise. So, Cm,T(ε) counts up the number
of m-histories that lie within a hypercube of the sizeœµ of each other. Put it differently; the correlation integral estimates the probability that any two m-dimensional points are within a distanœ µ of each other:
𝑃(|𝑋𝑡− 𝑋𝑠| < 𝜀, |𝑋𝑡−1− 𝑋𝑠−1| < 𝜀, … , |𝑋𝑡−𝑚+1−
𝑋𝑠−𝑚+1| < 𝜀) (2)
If the Xt are iid, this probability should be equal to the
following in the limiting case C1,T(ε)m= P(|Xt− Xs| <
ε)m
, then Brock, Dechert, and Scheinkman (1996) define the BDS statistics as:
𝑉𝑚𝜀 = √𝑇
𝐶𝑚,𝑇(ε)−𝐶1,𝑇(ε)m
𝑆𝑚,𝑇 (3)
where sm,T is the standard deviation. Under moderate
regularity conditions, the BDS statistic converges in distribution to N (0, 1).
Data
Inzinerine Ekonomika-Engineering Economics, 2019, 30(3), 316–325
international organizations. Nonlinearities have been detected in many macroeconomic series with different univariate tests. In that manner, by examining a distinct set of countries, we want to answer whether the terms of trade data fully reflect the information from the past years, i.e.,
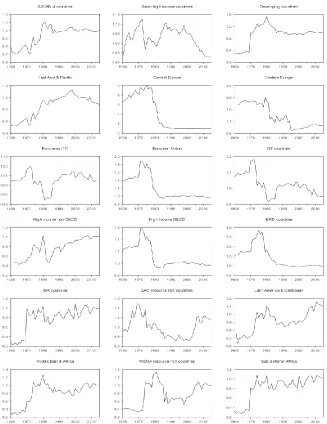
that successive price changes are independent (and identically distributed) or we can track some nonlinearity in their behaviour. By observing Figure 2 (data presented in natural logarithm) and Figure 3 we can perceive relatively different dynamics in terms of trade in distinct periods.
Figure 2. Terms of Trade; Adjusted Data (1960–2015) Source: World Bank (2018)
As we already mentioned, there is different dynamics in terms of trade between different countries till the 1980s, but afterward, their behaviour seems to resemble. However, when we analyse groups of countries selectively, their dynamics seem slightly different, following different trends that could be random but also could arise from some not random feature. Because of this, we survey the independence and nonlinear deterministic structure of the terms of trade. In addition, since there is a visible volatility in the variable across the countries within certain periods, we have split the period of observation on two sub-samples; before and after 1985, as a year that splits the sample in two similar periods taken by the number of observations, but the periods that are showing dissimilar behaviour.
Results
To test our hypothesis, we first tested standard linear unit root tests. Following the unit root tests (Augmented Dickey-Fuller test, Phillips-Perron test, and Kwiatkowski-Phillips-Schmidt-Shin test; results available upon request), variables revealed a non-stationary behaviour, meaning we have an I(1) order of integration for most of the variables. Thus, the random walk hypothesis can be rejected. For determining the possibility of nonlinear dependency, we used the BDS test which is applied for the variable terms of trade itself (in first differences) and the residuals from the AR(1) models (unadjusted variables)3. We display
results of the BDS test in Table 1 and Table 2, suggesting high BDS statistics, thus that the data generating mechanism is not linear. However, this is just the case for the analysis of the whole period. When observing sub-samples, the results are strikingly different.
Namely, BDS test results strongly suggest that the terms of trade series are non-linearly dependent when observing the whole period (1960–2015) for all groups of countries4. Even AR(1) and AR(2) models could not rule out the H1 hypothesis. That is because some patterns (or cycles) show up more frequently than would be expected in a real random series. However, when we split the sample into two sub-sample periods, we get contrary results. The BDS statistics from an AR(1) model for the whole period suggested linear dependency (H0) for the terms of trade of only a few groups of countries (for example, low-income countries, countries in the Middle East and Africa, Sub-Saharan Africa, Euro Area (17), G7 and IDA countries. When taking into account different sample periods, we come closer to the conclusion in favour of the null hypothesis. For the period 1960-1984, we can reject the null hypothesis of the BDS test for all the groups (except for the lower middle-income countries). For the period 1984-2015, we have shared results5 that again does not
3 Typically, an AR(p) is fitted to the time series and the BDS test is
then applied to the estimated residuals. Initially, we evaluated also the AR(2) process (as seen in Table 1). Other AR(p) models did not help in filtering linear dependency since the model's residuals suffer from heteroskedasticity and non-normality.
4 ASEAN 4-countries includes Indonesia, Malaysia, Philippines, and
Thailand. Euro Area (17) stands for 17 selected countries that are part of the European Monetary Union, LAC stands for Latin America and Caribbean countries, MENA stands for the Middle East and Africa countries, IDA countries include those that are so-called IDA-eligible for some IBRD borrowing, IBRD stands for those countries that have
confront that the underlying probability structure of the terms of trade could be linearly dependent6. If the null hypothesis is accepted (or not rejected with uniformity) then there would be little point to continue further, since either the lack of nonlinear structure or the shortness of the time series would strongly question the informativeness of tests for more specific forms of nonlinearity (Koller & Fischer, 2001). How should we interpret conflicting evidence between the linear unit root test and the BDS test, and the dissonance between the whole and sub-sample results? To answer this question is not an easy task. First, the trend decline/rise in terms of trade has often been accompanied with considerable volatility (related to the changes in commodity prices or periods of economic cycles). The diversity of the country’s experience (regarding selected macroeconomic and international policy with short- vs. long-run economic goals, tariff reforms, reduction of non-tariff barriers, export incentives, liberalization of foreign capital transactions) is also essential. In the period after the 1980s, international developments had a less impact on terms of trade that resulted in reduced volatility. Global economy experienced liberalization of trade on a significant scale with the diversification of export and import, there was a fall in prices of primary commodities with some recovering trends lately, low and stable inflation downward pressured many prices in foreign currency terms. Such divergent movements and heterogeneity in two sub-samples could have yielded the evidence of nonlinearity in a whole sample. However, this is not the proof of nonlinear dynamics of the terms of trade variable. Perhaps, the best way to summarize this evidence is to conclude that there are signs of nonlinearity, but not so emphatic it would suggest towards, for example, the theory deterministic chaos. Again, we accentuate that the BDS test does not provide a direct, but an indirect test for nonlinearity, meaning that other methods can test this property. Considering historical trends in terms of trade and our results, we think there should be further discussion, both theoretical and empirical, on this topic.
Table 1
BDS test; Countries Grouped by Income
Period (whole period 1960–2015)
Variables
Order of integration
BDS test on variable on AR(1) on AR(2)
ln_high_income - I(1) H1 H1 H1
ln_upper_middle_income -
I(1) H1 H1 H1
ln_lower_middle_income - I(0) H1 H1 H1
ln_low income - I(1) H1 H0 ntified unide
membership in the International Bank for Reconstruction and Development. China is not included separately because of its exceptional importance for the world trade, therefore should be evaluated individually.
5 For those countries (such as the Middle East and Africa, MENA
resource-rich countries, G7 and IDA countries) for we could reject the null hypothesis in the sample period still we could accept the null hypothesis for the whole period.
6 Display of the BDS test results for the high-income countries can be seen
Inzinerine Ekonomika-Engineering Economics, 2019, 30(3), 316–325
Period; 1960–1984
Variables
Order of integration
BDS test
on variable
on AR(1)
on AR(2)
ln_high_income - I(1) H1 H0 H0
ln_upper_middle_income - I(1) H1 H0 H0
ln_lower_middle_income - I(0) H0 H0 H0
ln_low income - I(1) H1 H0 H0
Period; 1985–2015
Variables
Order of integration
BDS test
on variable
on AR(1)
on AR(2)
ln_high_income - I(0) H1 H0
unide ntified
ln_upper_middle_income - I(0) H1 H1
unide ntified
ln_lower_middle_income - I(1) H1 H0 H0
ln_low income - I(1) H1 H0 H0
Source: Author’s calculation (EViews 9.5).
Table 2 presents the results of the BDS test as residues from the AR(1) model, executed on different categories of countries.
Table 2
BDS test; Countries Grouped Distinct Categories (Groups of Countries)
VARIABLES
BDS TEST AS AR(1) PROCESS
1960-2015
1960-1984
1985-2015
ASEAN 4 COUNTRIES H1 H0 H1
ASIAN HIGH-INCOME
COUNTRIES H1 H0 H1
EAST ASIA & PACIFIC H1 H0 H1
CENTRAL EUROPE H1 H0 H1
EASTERN EUROPE H1 H0 H1
EURO AREA (17) H0 H0 H0
EUROPEAN UNION H1 H0 H0
LATIN AMERICA &
CARIBBEAN H1 H0 H0
LAC RESOURCE-RICH
COUNTRIES H1 H0 H1
MIDDLE EAST & AFRICA H0 H0 H1
MENA RESOURCE-RICH
COUNTRIES H0 H0 H1
SUB-SAHARAN AFRICA H0 H0 H0
DEVELOPING
COUNTRIES H1 H0 H1
G7 COUNTRIES H0 H0 H1
IBRD COUNTRIES H1 H0 H1
IDA COUNTRIES H0 H0 H1
HIGH-INCOME
NON-OECD COUNTRIES H1 H0 H0
HIGH-INCOME OECD
COUNTRIES H1 H0 H0
Source: Author’s calculation (EViews 9.5)
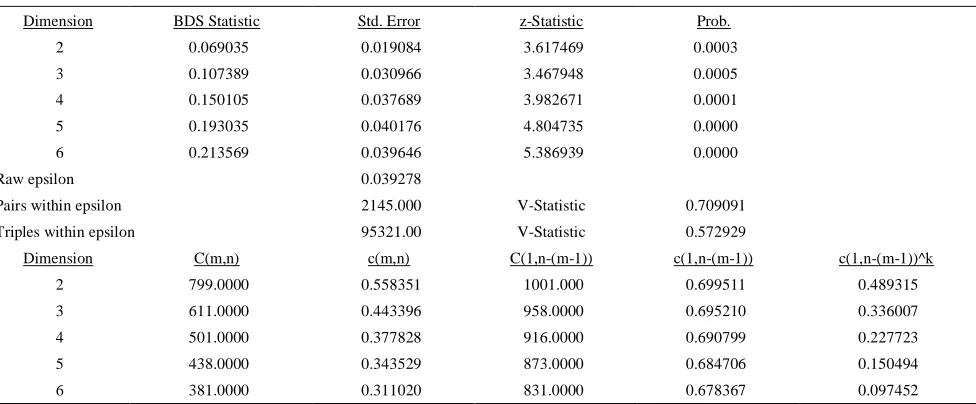
Table 3 BDS Test on RESID01; Sample: 1960:2015 (Observation: 56) Resid from In_High_Income AR(1)
Dimension BDS Statistic Std. Error z-Statistic Prob.
2 0.069035 0.019084 3.617469 0.0003
3 0.107389 0.030966 3.467948 0.0005
4 0.150105 0.037689 3.982671 0.0001
5 0.193035 0.040176 4.804735 0.0000
6 0.213569 0.039646 5.386939 0.0000
Raw epsilon 0.039278
Pairs within epsilon 2145.000 V-Statistic 0.709091
Triples within epsilon 95321.00 V-Statistic 0.572929
Dimension C(m,n) c(m,n) C(1,n-(m-1)) c(1,n-(m-1)) c(1,n-(m-1))^k
2 799.0000 0.558351 1001.000 0.699511 0.489315
3 611.0000 0.443396 958.0000 0.695210 0.336007
4 501.0000 0.377828 916.0000 0.690799 0.227723
5 438.0000 0.343529 873.0000 0.684706 0.150494
6 381.0000 0.311020 831.0000 0.678367 0.097452
Table 4
BDS Test on RESID02; Sample: 1960:1984 (Observation: 25) Resid from ln_High_Income AR(1)
Dimension BDS Statistic Std. Error z-Statistic Prob.
2 0.020203 0.025024 0.807345 0.4195
3 0.004922 0.040825 0.120553 0.9040
4 0.012222 0.049983 0.244529 0.8068
5 0.010787 0.053634 0.201128 0.8406
6 0.005342 0.053322 0.100185 0.9202
Raw epsilon 0.065867
Pairs within epsilon 441.0000 V-Statistic 0.705600
Triples within epsilon 8737.000 V-Statistic 0.559168
Dimension C(m,n) c(m,n) C(1,n-(m-1)) c(1,n-(m-1)) c(1,n-(m-1))^k
2 135.0000 0.489130 189.0000 0.684783 0.468927
3 78.00000 0.308300 170.0000 0.671937 0.303379
4 45.00000 0.194805 151.0000 0.653680 0.182583
5 28.00000 0.133333 138.0000 0.657143 0.122546
6 15.00000 0.078947 123.0000 0.647368 0.073605
Source: Authors’ calculations
Table 5
BDS Test on RESID03; Sample: 1985:2015 (Observation: 31) Resid from ln_High_Income AR(1)
Dimension BDS Statistic Std. Error z-Statistic Prob.
2 0.002311 0.012141 0.190375 0.8490
3 -0.004558 0.019774 -0.230502 0.8177
4 -0.018448 0.024139 -0.764248 0.4447
5 -0.027556 0.025806 -1.067834 0.2856
6 -0.038822 0.025542 -1.519935 0.1285
Raw epsilon 0.012849
Pairs within epsilon 640.0000 V-Statistic 0.711111
Triples within epsilon 14536.00 V-Statistic 0.538370
Dimension C(m,n) c(m,n) C(1,n-(m-1)) c(1,n-(m-1)) c(1,n-(m-1))^k
2 201.0000 0.495074 285.0000 0.701970 0.492763
3 130.0000 0.343915 266.0000 0.703704 0.348473
4 81.00000 0.230769 248.0000 0.706553 0.249217
5 50.00000 0.153846 231.0000 0.710769 0.181402
6 29.00000 0.096667 215.0000 0.716667 0.135489
Source: Authors’ calculations
Conclusion
We found different dynamics in terms of trade between different countries, which implied that the development of this variable could have a nonlinear deterministic structure. In macroeconomic modelling, it is important to detect whether there is nonlinearity in terms of trade, for misinterpretation of the data could guide towards model mis-specification by using linear models. A failure to recognize and deal with the presence of nonlinearity in the generating mechanism of a time series can often lead to poorly behaved parameter estimates and models who miss significant serial dependencies altogether. In this paper, we provided a comparative analysis of a different group of countries by testing nonlinearities in terms of trade time series. Nonlinearities have been detected in many macroeconomic series with different univariate tests. In that manner, by examining a distinct set of countries, we wanted to answer whether the terms of trade data fully reflect the information from the past years, i.e. that successive price changes are independent (and identically distributed) or we can track nonlinearity in their behaviour. We perform empirical evaluation with the use of BDS nonparametric statistical test which requires very weak population assumption and has proven its versatility in this area, by making it possible to study chaos theory and linear time series models with the same tool.
Inzinerine Ekonomika-Engineering Economics, 2019, 30(3), 316–325
References
Akintunde, M. O., Oyekunle, J. O., & Olalude, G. A. (2015). Detection of non-linearity in the time series using BDS test. Science Journal of Applied Mathematics and Statistics, 3(4), 184–187. https://doi.org/10.11648/j.sjams.20150304.13
Berg, A., Ostry, J. D., & Zettelmeyer, J. (2006). What makes growth sustained? WP/08/59, InternationalMonetary Fund Working Paper, IMF. https://doi.org/10.5089/9781451869217.001
Bisaglia, L., & Gerolimetto, M. (2014). Testing for (non)linearity in economic time series: a Monte Carlo comparison. Working Paper Series No. 3, Department of Statistical Sciences, University of Padua.
Brock, W., Dechert, W., & Scheinkman, J. (1996). A test for independence based on the correlation dimension. Econometric Review, 15(3), 197–235. https://doi.org/10.1080/07474939608800353
Brooks, C. (1996). Testing for non-linearity in daily sterling exchange rates. Applied FinancialEconomics, 6(4), 307–317.
https://doi.org/10.1080/096031096334105
Brueckner M., & Carneiro F. (2017). Terms of trade volatility, government spending cyclicality, and economic growth.
Review of International Economics, 1–15. https://doi.org/10.2139/ssrn.2796395
Conduah P. K. C., & Yoo, T. H. E. (2018). The impact of terms of trade volatility on economic growth in ASEAN countries,
Asian Policy.10, 32–40. https://doi.org/10.1142/S1793930518000259
Faisal, F., Tursoy T., Resatoglu, N. G., & Berk N. (2018). Electricity consumption, economic growth, urbanisation and trade nexus: empirical evidence from Iceland, Economic Research-Ekonomska Istrazivanja, 31(1), 664–680,
https://doi.org/10.1080/1331677X.2018.1438907
Hallam, D. (2018). Revisiting Prebisch-Singer: what long-term trends in commodity prices tell us about the future of CDDCs. Background paper to the UNCTAD-FAO Commodities and Development Report 2017, Commodity markets, economic growth and development. Food and Agricultural Organization of the United Nations: Rome.
Helpman, E., & Krugman, P. (1985). Market Structure and Foreign Trade: Increasing Returns, Imperfect Competition, and the International Economy. MIT Press: Cambridge.
Jawaid, S. T., & Raza, S. A. (2015). Do terms of trade and its volatility matter? Evidence from economic escalation of China, Journal of Transnational Management, 20(1), 3–30 https://doi.org/10.1080/15475778.2015.998136
Jebran, K., Iqbal, A., Bhat K.-U. & Ali A. (2018). Effect of terms of trade on economic growth of China. Emerging Economy Studies 4(2) 1–12 https://doi.org/10.1177/2394901518795068
Jerzmanowski, M. (2006). Empirics of hills, plateaus, mountains and plains: A Markov-switching approach to growth.
Journal of Development Economics, 81(2), 357–385. https://doi.org/10.1016/j.jdeveco.2005.05.005
Karama, F., & Zaki, C. (2015). Trade volume and economic growth in the MENA region:Goods or services? Economic Modelling 45, 22–37. https://doi.org/10.1016/j.econmod.2014.10.038
Koller, W., & Fischer, M. (2001). Testing for non-liner dependence in univariate time series: An empirical investigation of the Austrian unemployment rate. MPRA Paper 77809, University Library of Munich, Germany.
Lal, A. K. (2017). foreign direct investment, trade openness and GDP in China, India and Mexico, TheSingapore Economic Review, 62(5),1059–1076. https://doi.org/10.1142/S0217590815501076
Liu, T. Y., Su, C.W., Chang, H. L., & Xiong, D. P. (2018). Does the law of one price hold? A cross-regional study of China,
Economic Research-Ekonomska Istrazivanja, 31(1), 592–606. https://doi.org/10.1080/1331677X.2018.1429294
Mizrach, B. (1995). A simple nonparametric test for independence. Working Paper No. 1995–23, Rutgers University, Department of Economics, New Brunswick, NJ.
Patnaik, I., Bhattachary, R., & Pundit, M. (2013). Emerging economy business cycles: Financial integration and terms of trade shocks. WP/13/119, International Monetary Fund Working Paper, IMF. https://doi.org/10.5089/ 9781484354605.001
Pena, D., & Rodriguez, J. (2005). Detecting nonlinearity in time series by model selection criteria. International Journal of Forecasting, 21(4), 731–748. https://doi.org/10.1016/j.ijforecast.2005.04.014
Pradhan, R., P., Arvin, M., B., & Hall, J. H. (2017). The nexus between economic growth, stock market depth, trade openness, and foreign direct investment: The case of Asean countries, Singapore Economic Review. https://doi.org/10.1142/S0217590817500175
Reinsdorf, M. B. (2010). Terms of trade effects: Theory and measurement. Review of Income and Wealth 56(1), 177–205.
Skare, M., Simurina, J., & Tomic, D. (2012). Income terms of trade trend and volatility in Croatia. Economic Research, 25(4), 905–924. https://doi.org/10.1080/1331677X.2012.11517538
Takala, K., & Viren, M. (1995). Testing nonlinear dynamics, long memory and chaotic behaviour with macroeconomic data. Discussion Papers 9/95, Bank of Finland.
Tam, P. S, (2018). Global trade flows and economic policy uncertainty, Applied Economics, https://doi.org/10.1080/0 0036846.2018.1436151
Tomic, D. (2016). A more complex approach to the terms of trade dynamics; the case of Croatia, in Benazic, M., Bozina Beros, M., Gimigliano, G., Novak, A. & Uckar, D. ed., The EU economic environment post-crisis: policies, institutions and mechanisms, Juraj Dobrila University of Pula: Pula, pp. 95–108.
UNCTAD (2013). Key trends in international merchandise trade. United Nations Conference on Trade and Development. UNCTAD: New York and Geneva.
Vlad, S., & Pentiuc, S. G. (2009). Nonlinear analysis of BEFTI index time series data. Bulletin of University of Agricultural Sciences and Veterinary Medicine Cluj - Napoca, 66(2), 758–765.
World Bank. (2018). World Bank database. Available on: https://data.worldbank.org/
WTO. (2013). Trends in international trade. World Trade Report 2013, WTO.
Zhang, Y. (2002). Testing for nonlinearities in time series with application to exchange rates. Doctoral dissertation, Iowa State University.