Accepted Manuscript
The role of interdisciplinary collaboration for stated preference methods to value marine environmental goods and ecosystem services
Tobias Börger, Anne Böhnke-Henrichs, Caroline Hattam, Joanna Piwowarczyk, Femke Schasfoort, Melanie C. Austen
PII: S0272-7714(17)30010-0
DOI: 10.1016/j.ecss.2017.03.009
Reference: YECSS 5415
To appear in: Estuarine, Coastal and Shelf Science
Received Date: 4 January 2017 Revised Date: 19 February 2017 Accepted Date: 4 March 2017
Please cite this article as: Börger, T., Böhnke-Henrichs, A., Hattam, C., Piwowarczyk, J., Schasfoort, F., Austen, M.C., The role of interdisciplinary collaboration for stated preference methods to value marine environmental goods and ecosystem services, Estuarine, Coastal and Shelf Science (2017), doi: 10.1016/j.ecss.2017.03.009.
M
AN
US
CR
IP
T
AC
CE
PT
ED
The role of interdisciplinary collaboration for stated preference methods to value
1marine environmental goods and ecosystem services
23
Tobias Börgera,b*, Anne Böhnke-Henrichsc, Caroline Hattamb, Joanna Piwowarczykd, Femke 4
Schasfoorte, Melanie C. Austenb 5
6 a
School of Geography and Sustainable Development, University of St Andrews, UK 7
b
Plymouth Marine Laboratory, UK 8
c
Wageningen University, The Netherlands 9
d
Institute of Oceanology, Polish Academy of Sciences, Poland 10
e
Deltares, The Netherlands 11
12
* Corresponding author: [email protected] 13
14
Abstract: With the increasing use of environmental valuation methods in coastal, marine and 15
deep-sea settings, there is a growing need for the collaboration of natural scientists and 16
environmental economists. Stated preference valuation methods in particular need to be based 17
on sound natural science information and translate such information to be used in social surveys. 18
This paper uses three applications to make explicit the flow of information between different 19
disciplines in the preparation and implementation of stated preference studies. One approach 20
for facilitating this flow is to increase knowledge and understanding of natural scientists on these 21
methods. To address this, this paper highlights key opportunities and pitfalls and demonstrates 22
those in the context of three case studies. It therefore provides guidance on stated preference 23
valuation for natural scientists rather than for economists. 24
25
Keywords: Marine ecosystems, environmental valuation, stated preference methods, discrete 26
M
AN
US
CR
IP
T
AC
CE
PT
ED
1 1. Introduction
1
A rising demand for cost-benefit analyses of coastal and marine management measures, driven by 2
national and international legislation, has recently been stimulating increasing efforts in 3
environmental valuation in this field (Hanley et al. 2015, Börger et al. 2014a). Efficient use of public 4
funds for marine environmental policy requires the assessment of costs and benefits of management 5
measures (Oinonen et al. 2016, Scharin et al. 2016). Such management measures are a response to 6
an increasing number of directly and indirectly human-induced stressors, such as climate change, 7
fishing, maritime transport, land-based pollution and tourism. These stressors are leading to changes 8
in the state of the marine environment and consequently impact human welfare (Halpern et al. 2015, 9
Wolanski and Elliott 2015). Beyond their direct and indirect influence on economic activity, such as 10
the production of goods and services, there are a variety of impacts that are not directly accounted 11
for in observable market transactions. Their value (for use in environmental cost-benefit analyses) 12
cannot be assessed through the analysis of market data, necessitating the use of non-market 13
valuation techniques. These can be divided into two main groups: revealed preference and stated 14
preference (SP) methods. Other methods exist, such as cost-based approaches and value transfer 15
(Johnston and Rosenberger 2010), but as they do not employ survey methods, they are beyond the 16
remit of this paper. Revealed preference methods, such as the travel cost method (e.g. Whitehead et 17
al. 2008, Söderqvist et al. 2005, Bhat 2003) or hedonic pricing (e.g. Gopalakrishnan et al. 2011, 18
Samarasinghe and Sharp 2010), use available data on market transactions or individual behaviour to 19
infer the value of non-market goods. These methods are limited to the assessment of use values. 20
Total economic value, potentially consisting of use and non-use value, can only be assessed by 21
means of SP methods. The two most prominent of the latter are the contingent valuation method 22
(CVM) (Carson and Hanemann 2005, Mitchell and Carson 1989) and discrete choice experiments 23
(DCE) (Louviere et al. 2000). 24
In recent years, there has been an increase in the application of SP valuation studies in coastal 25
M
AN
US
CR
IP
T
AC
CE
PT
ED
2
Nunes et al. 2009, Bulte et al. 2005) and offshore resources (e.g. Brouwer et al. 2016, Aanesen et al. 27
2015, Börger et al. 2015, Jobstvogt et al. 2014a, Norton and Hynes 2014, Wattage et al. 2011, Glenn 28
et al. 2010, Liu and Wirtz 2010, McVittie and Moran 2010, Eggert and Olsson 2009). Nevertheless, 29
the number of high-quality primary valuation studies in the marine realm remains low compared to 30
terrestrial environments as can be seen in the existing valuation databases such as that of the 31
Marine Ecosystem Services Partnership (MSEP)1 or the Environmental Valuation Reference Inventory 32
(EVRI)2. 33
The stimulation for further marine valuation already exists due to increasing activity within 34
marine policy and management domains (for example, the EU Marine Strategy Framework Directive 35
(2008/56/EC), the development of marine plans and growing interest in the promotion of the blue 36
economy (Spalding 2016)). To ensure that environmental valuation is robust, of high quality, and 37
useable in the decision-making process, what needs to be fostered is increased collaboration 38
between natural scientists and environmental economists. This requires contributions from different 39
disciplines at different stages of the valuation process. On a practical level, the valuation of 40
environmental goods and ecosystem services entails four steps (Freeman 2002): (1) determining 41
(and quantifying) the size of the environmental change to be valued and its effect on ecosystem 42
structure and function; (2) determining (and quantifying) the impact of these effects on the 43
provision of ecosystem services to humans; (3) assessing changes in human welfare in monetary 44
terms, i.e. valuation; and (4) aggregating individual valuations over the affected population. While 45
steps (3) and (4) have received considerable attention from environmental economists and relevant 46
manuals are available (e.g. Johnston et al. forthcoming, Kanninen 2006, Champ et al. 2003, Bateman 47
et al. 2002, Haab and McConnell 2002), there is no standardised way to translate natural science 48
information into a valuation scenario in steps (1) and (2). It is evident that these steps depend 49
heavily on the specific survey topic. Interdisciplinary teams are indispensable to ensure that the links 50
1 www.marineecosystemservices.org
M
AN
US
CR
IP
T
AC
CE
PT
ED
3
between environmental changes and ecosystem services affected are presented to survey 51
respondents in a correct, succinct and understandable, yet neutral and non-leading way. This 52
involves a trade-off between the provision of more detail to increase ecological accuracy and realism 53
of the environmental changes to be valued and the risk of overburdening respondents on a cognitive 54
level. Against this backdrop, this paper explores how natural science knowledge and data can be 55
best translated for the use in SP studies by making the information flow in this interdisciplinary type 56
of research explicit. One approach for facilitating this information flow is to increase the 57
understanding of natural scientists of practical SP environmental valuation. In addition, while biases 58
and procedural problems still challenge valuation practitioners (Hoyos 2010, Venkatachalam 2004, 59
Mitchell and Carson 1989), the application of CVM and DCE in the marine environment has its own 60
recognised set of difficulties (Hanley et al. 2015). Therefore, key opportunities and pitfalls in the use 61
of SP valuation in the marine environment are highlighted by means of three recently conducted 62
valuation surveys in Poland, the Netherlands and the UK in the framework of the EU FP7 project 63
VECTORS (www.marine-vectors.eu). Consequently this paper is intentionally aimed predominantly at 64
a natural science readership rather than environmental economists. This focus will enable the 65
former to better assess the quality of existing valuation studies and generally to improve the 66
translation of environmental information for valuation purposes. Using the three applications of the 67
DCE approach as examples, this paper examines the approach and its application to value ecological 68
changes in the coastal and marine environment and thereby intends to raise awareness amongst 69
natural scientists for the particular requirements of interdisciplinary research around environmental 70
valuation. 71
72
2. Using stated preferences to value non-market environmental goods 73
2.1. Introduction to the concept of value in economics and stated preference methods 74
In economics, value can be expressed through exchange, and as such is instrumental and 75
M
AN
US
CR
IP
T
AC
CE
PT
ED
4
individual preferences and needs. Something has value to the extent that it satisfies existing human 77
preferences. Value can be thought of as the value of the good as a whole, which underpins the 78
conceptualisation in the CVM, or made up of the value of the different characteristics of the good, 79
which is the foundation of the DCE approach. Values are relative in the sense that the value of good 80
A relates and is comparable to the value of good B (Turner 1999). Consequently, in economics value 81
is usually assessed by employing the concept of willingness to pay (WTP), which implies a 82
comparison between the value of a good and money. This concept attempts to assess welfare 83
changes by quantifying how much of an individual’s current income or wealth he is willing to trade 84
for the provision of a good or service (or to prevent the cessation or reduction of this provision). An 85
alternative to this is the concept of willingness to accept (WTA) compensation to go without an 86
improvement or to endure deterioration of environmental quality. The majority of practical 87
applications, however, employ the WTP concept. In other words, what is the amount of money 88
forgone that leaves an individual exactly as well off, in terms of welfare, as before a positive change 89
in environmental quality occurred? This establishes a substitution relationship between the 90
provision of environmental quality and money. WTP can therefore be interpreted as an indicator of 91
the change in welfare that this individual expects from the change in provision or quality expressed 92
in monetary terms. 93
When goods or services are traded in markets, market data can usually be used to infer WTP 94
and hence the value of the goods in question.3 For the case of non-market goods this is not possible, 95
but SP valuation methods can be used to assess how much people would be willing to pay if there 96
was a market for these goods. While the beginnings of the CVM go back to the middle of the 20th 97
3 Note that there is a difference between WTP and market prices in that the amount a person is willing to pay
for a good might be more than she actually needs to pay in the market, i.e. the market price. Valuation is
therefore concerned with WTP, which is associated with the concept of consumer surplus (Bateman et al. 2002,
Morse-Jones et al. 2011). However, in well-functioning markets (and only there), market prices are usually a
M
AN
US
CR
IP
T
AC
CE
PT
ED
5
century (Randall et al. 1974, Davis 1963, Ciriacy-Wantrup 1947), DCE originate in the 1980s in 98
marketing and transport research (Louviere 1988, Louviere and Woodworth 1983) with first 99
applications in the environmental field appearing in the 1990s (Hanley et al. 1998, Boxall et al. 1996, 100
Adamowicz et al. 1994). Both methods are survey-based and present respondents with hypothetical 101
environmental management measures, the ‘valuation scenario’. These scenarios detail a proposed, 102
hypothetical environmental management project, which will lead to changes in specific aspects of a 103
non-market good or service. It is further specified that the proposed management measures can 104
only be implemented at a certain cost, which will have to be incurred by the potential beneficiaries 105
of the resulting changes, typically the households surveyed. As part of the valuation scenario, a 106
payment vehicle, the specific way respondents are asked to contribute to support the proposed 107
scenario, has to be specified. Typically coercive payment vehicles, such as taxes or fees are 108
preferable to voluntary vehicles such as donations (Carson and Groves 2007, Mitchell and Carson 109
1989). The payment vehicle also determines the frequency and duration of the hypothetical 110
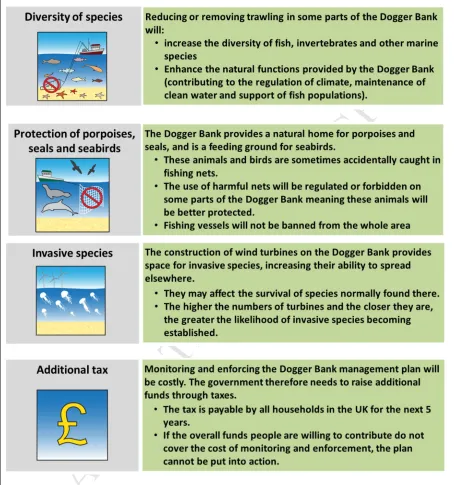
payments. In DCE, both the changing aspects of the ecosystem and the payment vehicle details are 111
expressed in the choice attributes that describe a certain choice option. As an example, Figure 1 112
displays the valuation scenario used in one of the DCEs examined in this paper (the Dogger Bank 113
survey; Section 3.1) introducing all choice attributes (‘Diversity of species’, ‘Protection of porpoises, 114
seals and seabirds’ and ‘Invasive species’ and the need to pay for this programme and the payment 115
vehicle, an ‘Additional tax’). Subsequently, respondents are presented with the valuation task. In the 116
CVM this is usually a single question directly eliciting the WTP for a change in environmental quality 117
proposed in the valuation scenario. Common formats of the elicitation question are the 118
dichotomous-choice question, in which respondents are simply prompted to indicate whether they 119
are willing to pay a certain amount for the proposed environmental change. This format has been 120
shown to make truthful responding in the best interest of the respondent (and hence more likely to 121
occur) if the WTP response really influences the chance of the proposed scenario to be implemented 122
M
AN
US
CR
IP
T
AC
CE
PT
ED
6
they are asked to state their maximum WTP on a list of monetary amounts (or intervals) (Cameron 124
and Huppert 1989). 125
126
- Figure 1 - 127
128
While the CVM assesses the value of the entirety of attributes of a good in monetary terms, 129
the DCE conceptualises a good as consisting of a number of attributes which all contribute to its 130
value. As two of these attributes are usually environmental quality and the price of the good, the 131
comparison with money is less direct in the DCE. Therefore, DCE are somewhat more flexible than 132
the CVM because instead of eliciting the WTP for the hypothetical management measures they 133
present respondents with a series of choices between two or more specifications of measures. These 134
choice options are described in terms of a set of attributes, the levels of which vary across options. 135
Each option displays how the management measure leads to different quantities or quality levels of 136
the specific non-market goods described (i.e. the choice attributes) at different costs. Respondents 137
are then asked to indicate their most preferred option. Typically a respondent answers several such 138
choice tasks with varying levels of the choice attributes. The use of the cost attribute allows for the 139
computation of respondents’ WTP for changes in the non-monetary choice attributes. As an example, 140
Figure 2 displays the choice card from one of the case studies. Respondents are asked to state their 141
preferred alternative between the current (‘Plan A’) and two hypothetical management plans (‘Plan 142
B’ and ‘Plan C’) (Section 3.1). 143
144
- Figure 2 - 145
146
In both CVM and DCE, if the survey sample is representative of the whole population affected 147
by the proposed environmental management measures, estimated mean WTP in the sample can be 148
M
AN
US
CR
IP
T
AC
CE
PT
ED
7
under study, which in welfare economics is referred to as the social value of this change. Both 150
approaches assume that respondents have clear and stable preferences regarding the goods and 151
services provided so that they can express their WTP (in CVM) or indicate their preferred choice 152
alternative(s) (in DCE) during the survey interview. In turn, respondents need to have all the 153
necessary information to complete this task. However, an increasing number of studies have shown 154
that preferences are often formed during the valuation interview (e.g. Kingsley and Brown 2010, 155
Holmes and Boyle 2005). Consequently, the way information is presented and what information is 156
provided is crucial if respondents are to accurately express their WTP or preferences. This is 157
especially important when the good to be valued is unfamiliar to respondents, which is often the 158
case in applications to coastal or marine environmental goods (Aanesen et al. 2015; McVittie and 159
Moran 2010). 160
161
2.2. Stated preference valuation in practice 162
Considerable research has gone into the different steps of developing a survey questionnaire, 163
preparing and administering the survey, and analysing collected data. In addition to a vast literature 164
in this field (Carson 2012a, Hoyos 2010), a number of manuals and textbooks are available (e.g. 165
Johnston et al. forthcoming, Kanninen 2006, Champ et al. 2003, Bateman et al. 2002). The 166
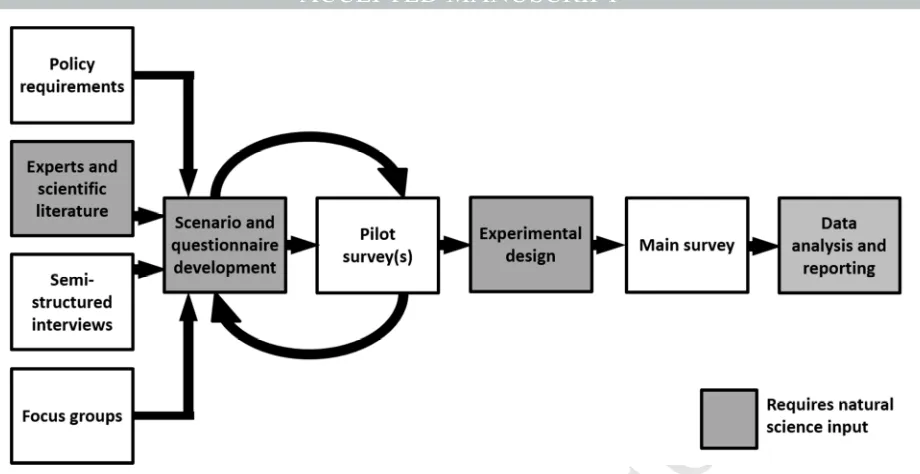
development of the valuation scenario and survey questionnaire is often informed by policy 167
requirements (Hanley et al. 2015), consultation with the scientific literature and natural scientists 168
with expertise in the area under study, and semi-structured interviews and focus groups with 169
members of the general public (Figure 3). The latter two help the researchers gauge the level of 170
concern, knowledge and understanding that potential survey respondents have for the specific topic. 171
It also helps identify suitable cost levels that can be incorporated into the choice exercise and the 172
payment scenario. The former helps identify how the proposed measures will be financed, the 173
responsible institution and the payment vehicle. The choice of an appropriate payment vehicle 174
M
AN
US
CR
IP
T
AC
CE
PT
ED
8
respondents relate the proposed changes to their household budget. The last crucial component of 176
questionnaire construction is the experimental design. In the case of the CVM, the experimental 177
design involves the selection of payment amounts for the dichotomous-choice format or the 178
specification of a payment card. For DCE, the experimental design is the combination of attribute 179
levels and costs into choice alternative that appear on the choice cards (e.g. Figure 2). In practical 180
applications the number of all possible attribute combinations is typically too large to present them 181
to respondents. Efficient experimental designs generate that combination of attribute levels in a 182
limited number of choice occasions, which is able to produce accurate estimates of the model 183
parameters in the analysis stage of the DCE while taking into account a number of additional criteria, 184
such as balancing the occurrence of each attribute level (Johnson et al. 2006, 2013, Street et al. 2005, 185
Ferrini and Scarpa 2007). 186
187
- Figure 3 - 188
189
Figure 3 illustrates the further survey process. Preliminary questionnaires are tested in waves 190
of pilot surveys using face-to-face interviews or the mode to be applied in the main survey (e.g. 191
postal, e-mail or online). This is an essential iterative process in which the scenario and 192
questionnaire are refined based on insights from pilot interviews, and the importance of this stage 193
should not be underestimated. During this stage, repeated meetings with natural scientists are 194
typically necessary regarding the use of factual information and its clear and concise, yet 195
understandable, representation in the survey materials (e.g. the use of illustrative materials, such as 196
photos, charts, graphs or maps in the questionnaire to support respondent comprehension). For 197
DCEs, typically the pilot surveys produce choice data that can be used to further inform the 198
experimental design (Scarpa and Rose 2008). The development of a survey and a questionnaire can 199
take up considerable amounts of time; a year or 18 months is not uncommon in academic 200
M
AN
US
CR
IP
T
AC
CE
PT
ED
9
months. With the fully developed questionnaire and an experimental design the main survey can be 202
conducted and resulting choice data analysed. The three case study surveys reported below were 203
developed and conducted following this procedure. 204
205
3. Translating and presenting natural science knowledge in SP surveys 206
In the framework of the VECTORS project, three stated preference surveys were conducted to value 207
changes in the provision of goods and services from selected marine ecosystems. These case studies 208
cover two European regional seas, the North and Baltic Seas, and both coastal and offshore sites. 209
These case studies illustrate the practical steps and considerations necessary to use SP surveys to 210
value changes in the marine environment. To reach this point, Figure 3 indicates that understanding 211
and quantifying these environmental changes requires close cooperation between environmental 212
economists and natural scientists, such as marine biologists and ecologists. However, there is 213
frequently a mismatch between the types of data and knowledge available to natural scientists and 214
the type of information required for a valuation survey. Therefore, this section first sketches out the 215
practical implementation of valuation surveys in the case studies. It subsequently uses these cases to 216
highlight the challenges of translating natural science information into SP surveys and links these 217
challenges to relevant procedural issues and ongoing research on SP methods.4 This discussion is 218
structured into three parts: (1) valuation scenarios, (2) endpoints of environmental change to be 219
valued and (3) the importance of letting policy and management issues guide survey development. 220
The use of realistic and believable scenarios based on accurate natural scientific evidence is an 221
essential requirement to obtain valid valuation estimates. While substantial methodological research 222
on these approaches in environmental economics focuses on removing or minimising biases in the 223
4 General overviews of methodological issues under study for stated preference valuations can be found in
Hoyos (2010), Venkatachalam (2004) and Mitchell and Carson (1989). Continuing methodological controversies
M
AN
US
CR
IP
T
AC
CE
PT
ED
10
survey responses and resulting WTP estimates (Rakotonarivo et al. 2016), the subsequent discussion 224
emphasises the role of cooperation between the natural sciences and economics in this effort. 225
226
3.1. Stated preference valuation in the marine environment – The cases 227
3.1.1. Conservation benefits on the Dogger Bank (North Sea) 228
The Dogger Bank is a shallow sea area in the southern North Sea traversing the exclusive economic 229
zones of Denmark, Germany, the Netherlands and the UK. Due to its shallowness the area is 230
characterised by high primary production, which supports substantial fish assemblages (Sell and 231
Kröncke 2013). Consequently, the Dogger Bank has long been an important fishing ground. In recent 232
years the site has also been used for natural gas and aggregate extraction (JNCC 2011). More 233
recently, plans for Europe’s largest wind farm have been developed for the Dogger Bank (Forewind 234
2010). The valuation scenario for this DCE survey was framed around ongoing negotiations between 235
stakeholders about a management plan for the Dogger Bank, a requirement of its recent designation 236
as a candidate special area of conservation (cSAC) under the EU Habitats and Species Directive 237
(92/43/EEC) (Burdon et al. in press, Hattam et al. 2015b). The valuation scenario introduced to 238
respondents focused on the regulation of the two main commercial activities on the site – 239
commercial fishing and wind farm development. Respondents were informed that by introducing 240
different regulations regarding permissible fishing gear and construction of the wind farm, several 241
aspects of the local ecosystem would be affected. These aspects are captured in the resulting choice 242
attributes, which were general species diversity, protection of some charismatic species (porpoises, 243
seals and seabirds), restrictions of the spread of invasive species and an annual household tax (Table 244
1). While ecosystem service categories were not directly used as attributes, the idea of capturing 245
diversity of species as a regulating service and the protection of particular species as a cultural 246
service guided attribute selection. As the survey was to be conducted in the UK, all described 247
changes refer to the UK section of the Dogger Bank area. The survey was conducted online in 248
M
AN
US
CR
IP
T
AC
CE
PT
ED
11
were obtained (Table 1), 973 of which were used for analysis. Survey preparation took 250
approximately one year and drew upon continual interaction between members of the survey team 251
(two natural scientists and three environmental economists) and multiple interactions with 252
members of the public: 29 semi-structured in-person interviews in the Southwest and Northeast of 253
England, 19 test interviews using a draft questionnaire and finally an online pilot survey ( = 60). 254
WTP estimates and further details can be found in Börger et al. (2014b). 255
256
- Table 1 - 257
258
3.1.2. Climate change impacts in the Dutch Wadden Sea (North Sea) 259
The Dutch Wadden Sea is an intertidal zone in the south eastern part of the North Sea enclosed by 260
the Frisian Islands. It comprises deep basins, tidal gullies, sand and mudflats and saltmarshes (Wang 261
et al. 2012), which accommodate several habitats and a variety of species, including shellfish, birds, 262
fish and seals. This distinctive ecological system makes the Wadden Sea area attractive for tourism 263
and recreation, with activities concentrated on the five Dutch Wadden Sea islands and alongside 264
some parts of the mainland coast. With approximately 2.15 million visitors and a turnover of around 265
€450 million per year, tourism is one of the most important economic sectors of this region (Stenden 266
Instituut Service Management 2010, Statistics Netherlands 2010). Changing ecosystems may impact 267
the Wadden Sea area and the tourism industry it sustains. Two challenges that the Wadden Sea may 268
encounter are: (1) mud flats may disappear, which may substantially influence the ecological system 269
potentially threatening the habitat of several species, such as birds and seals (van Goor et al. 2003, 270
Wang et al. 2012); and (2) growing sea transport and rising temperatures will facilitate more 271
introductions of southern warm water species, such as the invasive pacific oyster Crassostrea gigas, 272
into the area (Ravel and Olden 2008). 273
A DCE survey was conducted to assess the values held by tourists to the Wadden Sea for the 274
M
AN
US
CR
IP
T
AC
CE
PT
ED
12
as the presence of beach and sea, nature and an open view (Sijtsma et al. 2012, Raad voor de 276
Wadden 2008). Five climate change related attributes, which potentially impact the value of the 277
Wadden Sea to tourists, were chosen: (1) changes in the abundance of the ‘Pacific Oyster’ that may 278
limit recreation possibilities on the mud flats; (2) numbers of ‘Birds’ and (3) numbers of ‘Seals’ as 279
charismatic species; (4) ‘Wind turbines’ as a landscape feature that may affect the open view of the 280
sea; and (5) a tourist tax, which was selected as the most realistic payment vehicle (Table 1). This 281
selection was based on three indicators: (1) the importance of the attribute for tourists, (2) the 282
potential impact of climate change on the attributes and (3) the lack of a proven management 283
strategy that may reduce the potential impact. Beach width seemed to be another relevant indicator. 284
However, the Netherlands already have a successful sand nourishment strategy, which will reduce 285
the potential impact (Giardino et al. 2011). Hence this characteristic was not included. 286
Attribute levels were based on the present situation and potential future changes resulting 287
from the International Panel on Climate Change (IPCC) emission scenarios A1F1 (high CO2 emissions) 288
and B1 (lower CO2 emissions) (Nakićenović et al. 2000). Due to limited literature regarding the extent 289
of the potential impacts on the Wadden Sea (Markham et al. 2016), expert judgment was used to 290
derive attribute levels reflecting the possible future impacts on the selected attributes. Assumptions 291
were made on the potential vectors of change based on the climate change scenarios resulting from 292
a literature review. This review was subsequently checked by eight experts and practitioners in the 293
field including ecologists, policy makers, tourism experts and a morphologist. After several semi-294
structured interviews with amongst others environmental economists, ecologists, geologists, 295
sociologists and Wadden Sea experts a draft questionnaire was set up. This questionnaire was tested 296
during two pilot surveys with residents ( = 50) and tourists ( = 25) on the Wadden Island 297
Ameland (Table 1). After both pilots the feedback was included in the questionnaire. The attribute 298
levels of the payment vehicle were also set based on these tests. The final questionnaire consisted of 299
six choice cards including a test choice card and an introduction of the different attributes. After the 300
M
AN
US
CR
IP
T
AC
CE
PT
ED
13
2012 a combination of 550 face-to-face and take-home interviews were undertaken in Ameland. The 302
sample consisted of 121 German and 429 Dutch tourists. 303
304
3.1.3. Ecosystem benefits of seagrass in the Gulf of Gdańsk (Baltic Sea) 305
The Gulf of Gdańsk in Northern Poland is part of the Southern Baltic Sea. This shallow and sheltered 306
sea has witnessed a sharp decline in seagrass (Zostera marina) from the 1950s, but recently there 307
have been measures to protect and recover the seagrass meadows (Boström et al. 2003, Jankowska 308
et al. 2014). This DCE was concerned with benefits resulting from seagrass restoration. Choice 309
attributes were a reduction of the amount of filamentous algae (Ectocarpus and pilyaella) in the 310
water and on the shore (ecosystem service: biological control), access to seagrass meadows for 311
boaters and divers (opportunities for recreation and tourism) and improved water clarity through 312
water purification (waste treatment/water purification). The cost attribute was specified as a waste 313
water treatment fee that all households in the region would have to pay (Table 1). The preparation 314
of this survey took just under one year and comprised regular interactions between members of the 315
survey team (two economists and three seagrass ecologists) and between the survey team and the 316
public, including: 19 semi-structured interviews with residents in the Gdańsk area, three focus group 317
meetings as well as two face-to-face pilot surveys with = 50 completed interviews each (Table 1). 318
After each of these steps, the survey questions, valuation scenario and attribute description were 319
modified based on findings. In the main survey, 500 interviews were completed face-to-face with 320
residents in the coastal areas of the Pomeranian Province in Northern Poland between November 321
2013 and January 2014. Börger and Piwowarczyk (2016) provide detailed WTP estimates and 322
additional results. 323
324
3.2. Valuation scenarios 325
The effect of scenario realism has been assessed in several studies (e.g. Cameron et al. 2011, Kataria 326
M
AN
US
CR
IP
T
AC
CE
PT
ED
14
change and their level of agreement with them have been demonstrated to affected the elicited 328
preferences. To ensure that lay respondents understand the survey task and can accurately state 329
their preferences, valuation scenarios, the provision of information on the environmental change to 330
be valued, how it will be caused (i.e. the management measure) and what its consequences will be, 331
therefore need to be presented in an understandable way. This can be problematic for marine 332
settings as the marine environment has been shown to be perceived as remote and unfamiliar (Rose 333
et al. 2008, Steel et al. 2005). While it is crucial to present realistic scenarios of change to ensure 334
respondents interpret scenarios as credible and to induce them to take the (hypothetical) valuation 335
task seriously it is equally important to simplify ecological relationships to ensure they are 336
understood. Scenarios which are hardly credible will result in random stated choices and 337
consequently uninformative WTP estimates. The valuation scenario must demonstrate how the 338
environmental changes under study will affect the welfare of the interviewed population. Practically 339
this means repeated interactions between specialists on the environmental change of interest, 340
survey designers, other members of the valuation team and members of the target survey 341
population (e.g. members of the public in the three cases presented here). For example, in the Dutch 342
case, the different ecosystem impacts had to be made specific to the Wadden Sea (Table 2). This 343
required ecological, climate-related and morphological expert knowledge, including a pilot survey to 344
examine the understanding of the scenarios by the general public. Experts of Pacific oysters 345
indicated the possible spreading of this invasive species, while mud flat walking agencies could add 346
information on the impact of this spread for tourists. Another example of expert input into scenario 347
design concerned the possibility of replanting of seagrass in the Polish survey. While participants of 348
the preparatory focus groups believed that active replanting of seagrass was the easiest mitigation 349
strategy, expert interviews revealed that such initiatives have so far proved to be technically 350
unsuccessful. As a result of this information the restoration scenario included in the survey 351
M
AN
US
CR
IP
T
AC
CE
PT
ED
15
Once a preliminary questionnaire has been developed, multiple rounds of questionnaire 353
testing commence. This can be undertaken in many ways, including through interviews, focus groups 354
and self-completion activities. One of the approaches used in the development of the Dogger Bank 355
survey was the use of think-aloud interviews whereby respondents were asked to vocalise their 356
thoughts are they completed the questionnaire. This enabled the survey development team to 357
detect unclear wording and overly complex attribute description (Ryan et al. 2009, Schkade and 358
Payne 1994). By gaining insight into how respondents take up and process the information 359
presented, refinements of the questionnaire were undertaken with the aim of increasing respondent 360
engagement and the stating of informed preferences. This process of testing and refinement should 361
be employed routinely, especially when remote and unfamiliar goods are to be valued. 362
Realistic, credible and understandable valuation scenarios are also required to help mitigate a 363
procedural problem that continues to trouble SP surveys: Protest responses (Venkatachalam 2004; 364
Meyerhoff and Liebe 2008). In the CVM some respondents might state a WTP of zero not because 365
they truly expect no change in welfare but because they want to express protest, dissatisfaction or 366
anger regarding the valuation scenario, the payment vehicle, the institution responsible for the 367
proposed measures or the valuation survey as a whole. This type of respondent has to be identified 368
so that only true zero WTP statements are used for welfare analysis. In DCE studies, protest 369
respondents might be those who prefer the no-cost status quo in all choice occasions even though 370
they would in fact experience a change in welfare from the proposed changes. Attitudinal follow-up 371
questions are used to distinguish these respondents from those who choose the no-cost option 372
because they truly do not value the described changes. In the Wadden Sea study, for example, all 373
respondents consistently choosing the status quo were asked why they were not willing to pay to 374
avoid environmental changes in the Wadden Sea. Most of these respondents stated that the 375
Wadden Sea needs to be protected by law or that such measures should be paid out of current taxes. 376
M
AN
US
CR
IP
T
AC
CE
PT
ED
16
management measures, but simply that they did not want to pay even though they would value the 378
proposed changes. Based on these answers 33 respondents were discarded from the survey sample. 379
380
- Table 2 - 381
382
3.3. Endpoints of valuation scenarios: Definition and range of choice attributes 383
Valuation scenarios need to clearly specify the endpoints of the proposed environmental change. 384
Such endpoints are described in terms of the different ways through which the environmental 385
changes will affect societal welfare. In CVM scenarios, typically only a one-off change from a current 386
status or business-as-usual scenario to a future change scenario covering all possible impacts is 387
presented. In DCE, the different impacts may find expression in the choice attributes which can be 388
varied and valued independently based on the collected choice data. Determining realistic ranges for 389
each attribute and ensuring that combinations of different attribute levels are ecologically 390
meaningful are crucial to the interpretability of valuation results. 391
A helpful tool to specify choice attributes and their ranges proved to be the ecosystem service 392
framework, which facilitates the translation of ecosystem changes to services and eventually 393
benefits that affect human welfare (de Groot et al. 2010). Böhnke-Henrichs et al. (2013) call for 394
valuation studies to clearly describe which ecosystem service categories are being valued and “how 395
much of a particular service has been valued” (p. 144). However, ecosystem service categories may 396
have a greater role than just as a communication tool in the valuation scenario. They can also help 397
guide the development of choice attributes by the researchers, as applied in both the Polish and the 398
Dogger Bank case studies (Table 2). If indicators for ecosystem service change exist (e.g. Hattam et al. 399
2015a, Liquete et al. 2013), such metrics can be used in the valuation scenario. This allows the 400
changes in the marine environment to clearly map to the values elicited in the survey. In the case of 401
the Gulf of Gdańsk survey, the ecosystem service framework was used to structure preparatory 402
M
AN
US
CR
IP
T
AC
CE
PT
ED
17
affects individual welfare proved helpful in guiding participants’ discussions of the role of this 404
ecosystem. Consequently, the use of clear-cut ecosystem service categories as choice attributes was 405
retained in the main survey. While ecosystem service categories guided the initial considerations 406
about the choice attributes to be used in the Dogger Bank survey, they were not used in the final 407
survey due to a lack of required ecosystem data at the appropriate spatial scale for the ecosystem 408
services in the case study area and lack of familiarity with these services by the respondents (e.g. 409
waste remediation, carbon sequestration and gene pool protection). 410
The selection of choice attributes, however, is always influenced by both the scientific 411
evidence and the perception of respondents. In the Polish survey, ecological expert knowledge was 412
necessary to translate the quantitative – but still relatively scarce – information about projected 413
filamentous algae abundance into spatial terms meaningful to respondents. In a series of work 414
meetings, economists and seagrass ecologists developed the description of the attribute and its 415
levels, which were then tested on members of the public and subsequently refined. Focus groups 416
can serve to detect potential interaction effects between attributes which should be taken into 417
account in the experimental design (Hoyos 2010). While clarification from a natural science 418
perspective is needed about which services are delivered jointly by the same ecological processes 419
(e.g. carbon sequestration and bioremediation of waste) and hence cannot be independently varied, 420
the perception of respondents on service interactions also needs to be assessed. It is possible that 421
the value of a benefit from a certain service depends on the level of another service. This 422
information needs also to be incorporated into the experimental design of the DCE. For example, 423
participants in the Polish focus groups explicitly discussed which seagrass ecosystem services they 424
perceive as related and being provided jointly. Since no relationships between the three attributes 425
were perceived, they were varied independently in the experimental design used in the main survey. 426
427
M
AN
US
CR
IP
T
AC
CE
PT
ED
18
Supporting natural science knowledge is required to facilitate the use of value estimates and 429
particularly environmental cost-benefit analysis (informed by valuation) in policy and management 430
(Scharin et al. 2016). Natural science knowledge provides the context for result interpretation but 431
also makes valuation outputs useful beyond the specific context of the study. As stated, a well-432
designed survey not only improves the credibility of the scenario for respondents, ensuring scenario 433
realism, but is also more likely to elicit credible values. The presentation of SP valuation findings by 434
interdisciplinary teams is necessary as it has been shown that decision-makers have limited 435
knowledge about the economic aspect of these valuation techniques in particular (Guo and Kildow 436
2015). The use of interdisciplinary language to present results may therefore help to remedy this 437
situation and facilitate the take-up of these values by policy- and decision-makers. Values assessed 438
through SP surveys provide indications about the societal desirability of environmental change, but 439
natural scientific knowledge is needed to devise the management measures that will lead to these 440
changes. 441
Guo and Kildow (2015) emphasise that valuation studies need to address specific 442
environmental management problems if they are to be relevant for policy-making. This idea has 443
guided the Dogger Bank study, which looked at the specific need to develop a management plan for 444
the area. This study’s scenario was entirely based on ongoing negotiations about a management 445
plan for the Dogger Bank cSAC under the EU Habitats and Birds Directive. Different attribute levels 446
represented the anticipated outcomes of different management measures proposed by the 447
stakeholders involved in these negotiations. Similarly the Gdańsk study was framed by the need for 448
management to support local implementation of local targets for the EU Marine Strategy Framework 449
Directive. In the Wadden Sea study scenarios were linked to global rather than national or local 450
policy by using official IPCC scenarios from which to derive the anticipated environmental change in 451
the study area (Table 2). This step attempts to close the gap between SP valuation and policy-making 452
(Guo and Kildow 2015) and address the lack of uptake of valuation results by decision-makers 453
M
AN
US
CR
IP
T
AC
CE
PT
ED
19 455
4. Discussion and conclusions 456
The above discussions illustrate how valuation studies can incorporate natural science knowledge to 457
improve scenario realism, attribute definition and valuation surveys and findings for policy and 458
management. This is achieved through the establishment of the causal links between the 459
applications of certain environmental management measure(s), the impact on ecosystems, the 460
resulting effects on human welfare and associated values. Establishing these links and conducting 461
policy-driven valuation is essential if the needs of marine legislation and policy, such as the EU 462
Marine Strategy Framework Directive or for marine planning are to be met (Börger et al. 2014a). 463
Despite the use of state-of-the-art survey development techniques in the above studies, the 464
presentation of information about the marine environment remains challenging. Self-reported 465
knowledge of respondents about the survey topic is often gathered in such surveys and commonly 466
shown to be low. For example, in the Dogger Bank survey, while approximately half of the 467
respondents stated they had heard of the Dogger Bank, 80.3% of these had done so in the shipping 468
weather forecast on national radio. After completing the choice tasks, 57.2% of respondents 469
indicated that they did not have enough information about the Dogger Bank to know what the 470
proposed measures are worth to them. Looking beyond the three case studies, this share is equally 471
high (56.2%) in a similar survey about ecological and amenity impacts of an offshore windfarm in 472
Northwest England (Börger et al. 2015) and higher in the Gulf of Gdańsk survey (63.0%). In a 473
valuation study of deep-sea ecosystem services in Scotland, 63.0% of respondents indicated they 474
knew only half or less of the presented information (Jobstvogt et al. 2014a). In the Dogger Bank 475
study, 59.6% of respondents stated they had known none of the information presented. These 476
numbers demonstrate that providing respondents with accurate, succinct and neutral information 477
about the good to be valued is crucial and yet still challenging. Many DCE studies, but particularly 478
those valuing offshore environmental goods, such as Börger et al. (2014b), Jobstvogt et al. (2014a) or 479
M
AN
US
CR
IP
T
AC
CE
PT
ED
20
attributes to keep the survey manageable for respondents.Methodological research has recently 481
been studying how exactly respondents receive and process information in stated preference 482
surveys (Czajkowski et al. 2014, LaRiviere et al. 2014). Given the low level of prior knowledge 483
regarding many marine ecosystems, this is an important field for further research. 484
To further facilitate the presentation of ecological information in SP surveys, the use of 485
ecosystem principles has been proposed (Jobstvogt et al. 2014b), which systematically extracts 486
expert knowledge on ecosystem processes to express these in a set of comprehensive principles in a 487
survey setting. Other research on SP surveys has pointed out the role of using maps, both as 488
overview maps and individualised maps, to facilitate the respondent’s understanding of the 489
environmental good and its exact location or spatial distribution (Johnston et al. 2016). Another area 490
of research that has consequences for nature of natural science information to be included and the 491
way how it can be presented concerns survey modes. While face-to-face surveys are regarded as the 492
‘gold standard’ (Arrow et al. 1993) and allow for presentation of complex information and even 493
additional explanations from the interviewer, other modes are usually employed to save costs and 494
time.5 Online surveys (Olsen 2009) are comparably cheap and allow access to a wide range of 495
respondents (in countries where there is a high level of internet penetration in the population) but 496
are also vulnerable to “professional respondents” who regularly take surveys and might rush 497
through the questionnaire and might not be easy to identify (Börger 2016). As an alternative, some 498
studies valuing hard-to-understand or remote environmental goods employ workshops to collect 499
data (Aanesen et al. 2015, Christie and Rayment 2012). This approach increases survey costs and 500
limits the geographical reach of the survey sample, but it facilitates the provision of complex 501
ecological information and offers more room for deliberation and contemplation before WTP or 502
choices are stated. It is important that social and natural scientists work cooperatively on the 503
5 It should be noted that the presentation of choice cards needs to be randomised, which is difficult in
face-to-face interviews. While computer-assisted personal interviewing (CAPI) is a way to solve this problem, this
M
AN
US
CR
IP
T
AC
CE
PT
ED
21
preparation and implementation of valuation surveys to ensure that the information provided and 504
the materials used are in line with the particular requirements of the survey mode. 505
Many changes in the marine environment cannot be described in quantitative terms due to 506
the lack of relevant data at appropriate spatial and/or temporal scales. Indicators of ecosystem 507
services and their changes as developed by e.g. Hattam et al. (2015a) will play an important role in 508
overcoming this challenge, as may ecological and ecosystem modelling outputs (Hyder et al. 2015, 509
Peck et al. in press). Some degree of uncertainty therefore exists around ecosystem change and 510
responses to ecosystem management. How this uncertainty is presented in SP surveys remains a 511
challenge and is an under-researched issue. Although natural science information is often associated 512
with uncertainty, valuation surveys often present respondents with future changes that occur with 513
certainty. This mismatch would not be problematic if preferences were unaffected by this, but it has 514
been shown that presenting environmental change in valuation scenarios as certain or uncertain 515
affects elicited preferences (Roberts et al. 2008). Consequently, better communication of 516
uncertainty about future environmental states in surveys and understanding its effect on values is an 517
important field of research. This requires better information from natural scientists about the extent 518
and the type of uncertainty related to a particular environmental change. 519
In addition, ecological expertise is usually required for value transfer to ensure that elicited 520
values from one site are only applied to other sites which are ecologically equivalent in 521
characteristics (Richardson et al. 2015, Johnston and Rosenberger 2010). Value transfer is analogous 522
to the process by which a marine ecologist might infer that the marine species in one location where 523
sampling has been undertaken will be similar to those in another location because they share key 524
environmental characteristics. The pitfalls for an economist using value transfer with limited data 525
availability are familiar to those faced by the natural scientists. Can it be reasonably assumed that 526
the two sites are sufficiently similar in the characteristics that affect economic choices to be certain 527
that value transfer is a valid process? However, this technique is developing rapidly (e.g. Czajkowski 528
M
AN
US
CR
IP
T
AC
CE
PT
ED
22
case studies and the use of ecosystem service categories guiding the selection of choice attributes 530
could further facilitate the use of the elicited values in value transfer. The values could, therefore, 531
support management decisions in these other locations. For example, in the Polish seagrass study 532
values for the reduction of algae abundance and improved water clarity can be transferred to other 533
sites independent of their link to seagrass beds, but ecologists and biologists are required in this 534
transfer to ensure the equivalence of ecological conditions between the study site and the transfer 535
site. 536
Several conclusions can be drawn from the above discussion of challenges of SP valuation in 537
marine and coastal settings. First, interdisciplinary teams are a necessity, consisting at least of 538
marine scientists (particularly biologists and ecologists), environmental economists and survey 539
methodology experts. Furthermore, the handling of DCE data and the related field of choice 540
modelling (also relevant to applications to health and transport policy) have seen rapid progress in 541
recent years and methods are now available to extract increasingly detailed information from choice 542
data (Hensher et al. 2015, Train 2009). Second, the ecosystem service approach should be more 543
extensively applied in valuation studies as a way of describing the consequences of change in the 544
marine environment and guiding the selection of choice attributes as highlighted in the Dogger Bank 545
and Gulf of Gdańsk cases. Future research is needed to strengthen this link between what is being 546
valued and established ecosystem service categories so that ecosystem service values can be used to 547
support marine planning and general marine management. This is also necessary if valuation outputs 548
are to be used as input to larger ecosystem or bioeconomic models that consider multiple ecosystem 549
services (e.g. Punt et al. 2009, Hyder et al. 2015). Third, defining best practice for questionnaire 550
development for SP surveys is challenging. While there are detailed manuals available for the 551
development of an appropriate survey instrument, some trade-off between clarity and realism 552
within the survey and the potential overburdening of respondents with information will always exist. 553
Against this background, the cases in this paper show that (and how) natural scientists can 554
M
AN
US
CR
IP
T
AC
CE
PT
ED
23
between natural scientists and environmental economists adds a further layer of complexity to 556
survey preparation and implementation and therefore requires time during survey development but 557
results in greater survey quality. For the natural scientists who are willing to contribute to 558
interdisciplinary SP valuation the reward is that their research can directly support policy 559
development and management decisions in the marine and coastal environment. 560
561
Acknowledgements 562
This study was funded by the European Community’s Seventh Framework Programme (FP7/2007 – 563
2013) within the Ocean of Tomorrow call under Grant Agreement No.266445 for the project Vectors 564
of Change in Oceans and Seas Marine Life, Impact on Economic Sectors (VECTORS). 565
566
References 567
Aanesen M, Armstrong C, Czaijkowski M, Falk-Petersen J, Hanley N, Navrud S (2015) Willingness to 568
pay for unfamiliar public goods: Preserving cold-water coral in Norway. Ecological Economics, 569
112, 53-67. 570
Adamowicz W, Louviere J, Williams M (1994) Combining Revealed and Stated Preference Methods 571
for Valuing Environmental Amenities. Journal of Environmental Economics and Management, 572
26 (3), 271-292. 573
Arrow KJ, Solow RM, Portney PR, Leamer EE, Radner R, Schuman H (1993) Report of the NOAA Panel 574
on Contingent Valuation: Natural resource damage assessment under the oil pollution act. 575
Federal Register 58. 576
Bateman IJ, Carson RT, Day B, Hanemann M, Hanley N, Hett T, Jones-Lee M, Loomes G, Mourato S, 577
Özdemiroglu E (2002) Economic valuation with stated preference techniques: A manual. Edward 578
Elgar, Cheltenham. 579
Bateman IJ, Brouwer R, Ferrini S, Schaafsma M, Barton DN, Dubgaard A, Hasler B, Hime S, Liekens I, 580
M
AN
US
CR
IP
T
AC
CE
PT
ED
24
Deriving and testing principles for value transfers for similar and dissimilar sites using a case 582
study of the non-market benefits of water quality improvements across Europe. Environmental 583
and Resource Economics, 50 (3), 365-387. 584
Bhat MG (2003) Application of non-market valuation to the Florida Keys marine reserve 585
management. Journal of Environmental Management, 67 (4), 315-325. 586
Billé R, Laurans Y, Mermet L, Pirard R, Rankovic A (2012) Valuation without action? On the use o 587
economic valuations of ecosystem services. IDDRI Policy Brief 07/12, 1-4. 588
Böhnke-Henrichs A, Baulcomb C, Koss R, Hussain SS, de Groot RS (2013) Typology and indicators of 589
ecosystem services for marine spatial planning and management. Journal of Environmental 590
Management, 130, 135-145. 591
Börger T (2016) Are fast responses more random? Testing the effect of response time on scale in an 592
online choice experiment. Environmental and Resource Economics, 65 (2), 389-413. 593
Börger T, Beaumont NJ, Pendleton L, Boyle KJ, Cooper P, Fletcher S, Haab T, Hanemann M, Hooper 594
TL, Hussain SS, Portela R, Stithou M, Stockill J, Taylor T, Austen MC (2014a) Incorporating 595
ecosystem services in marine planning: The role of valuation. Marine Policy, 46 (C), 161-170. 596
Börger T, Hattam C, Burdon D, Atkins JP, Austen MC (2014b) Valuing conservation benefits of an 597
offshore marine protected area. Ecological Economics, 108 (0), 229-241. 598
Börger T, Hooper TL, Austen MC (2015) Valuation of ecological and amenity impacts of an offshore 599
windfarm as a factor in marine planning. Environmental Science & Policy, 54, 126-133. 600
Börger T, Piwowarczyk J (2016) Assessing non-market benefits of seagrass restoration in the Gulf of 601
Gdansk. Journal of Ocean and Coastal Economics, 3, Article 1. 602
Boström C, Baden S, Krause-Jensen D (2003) The seagrass of Scandinavia and the Baltic Sea. In: 603
Green EP, Short FT (eds.) The world atlas of seagrasses, University of California Press, Berkeley 604
and Los Angeles, 27-37. 605
Boxall PC, Adamowicz WL, Swait J, Williams M, Louviere J (1996) A comparison of stated preference 606
M
AN
US
CR
IP
T
AC
CE
PT
ED
25
Brouwer R, Brouwer S, Eleveld MA, Verbraak M, Wagtendonk AJ, van der Woerd HJ (2016) Public 608
willingness to pay for alternative management regimes of remote marine protected areas in the 609
North Sea. Marine Policy, 68, 195-204. 610
Bulte E, Gerking S, List JA, de Zeeuw A (2005) The effect of varying the causes of environmental 611
problems on stated WTP values: Evidence from a field study. Journal of Environmental 612
Economics and Management, 49 (2), 330-342. 613
Burdon D, Boyes SJ, Elliott M, Smyth K, Atkins JP, Barnes RA, Wurzel RK (in press) Integrating natural 614
and social sciences to manage sustainably vectors of change in the marine environment: Dogger 615
Bank transnational case study. Estuarine, Coastal and Shelf Science, 616
doi:http://dx.doi.org/10.1016/j.ecss.2015.09.012. 617
Cameron TA, DeShazo JR, Holmes Johnson E (2011) Scenario adjustment in stated preferences 618
research. Journal of Choice Modelling, 4 (1), 9-43. 619
Cameron TA, Huppert DD (1989) OLS versus ML estimation of non-market resource values with 620
payment card interval data. Journal of Environmental Economics and Management, 17 (3), 230-621
246. 622
Carson RT (2012a) Contingent valuation: A comprehensive bibliographic history. Edward Elgar, 623
Cheltenham. 624
Carson RT (2012b) Contingent valuation: A practical alternative when prices aren't available. Journal 625
of Economic Perspectives 26 (4), 27-42. 626
Carson RT, Groves T (2007) Incentive and informational properties of preference questions. 627
Environmental and Resource Economics, 37 (1), 181-210. 628
Carson RT, Hanemann WM (2005) Contingent valuation. In: Mäler K-G, Vincent JR (eds.) Handbook 629
of Environmental Economics, vol 2. Elsevier, Amsterdam, 821-936. 630
M
AN
US
CR
IP
T
AC
CE
PT
ED
26
Christie M, Rayment M (2012) An economic assessment of the ecosystem service benefits derived 632
from the SSSI biodiversity conservation policy in England and Wales. Ecosystem Services, 1 (1), 633
70-84. 634
Ciriacy-Wantrup Sv (1947) Capital returns from soil-conservation practices. Journal of Farm 635
Economics, 29 (4 (II)), 1181-1196. 636
Czajkowski M, Hanley N, LaRiviere J, Simpson K (2014) What is the causal effect of information and 637
learning about a public good on willingness to pay? Stirling Economics Discussion Papers 2014-638
05, University of Stirling, Stirling. 639
Czajkowski M, Ahtiainen H, Artell J, Meyerhoff J (2017) Choosing a functional form for an 640
international benefit transfer: Evidence from a nine-country valuation experiment. Ecological 641
Economics, 134, 104-113. 642
Davis RK (1963) The value of outdoor recreation: An economic study of the Maine woods. Ph.D. 643
disseration, Harvard University. 644
de Groot RS, Fisher B, Christie M, Aronson J, Braat L, Gowdy JM, Haines-Young R, Maltby E, Neuville 645
A, Polasky S, Portela R, Ring I (2010) Integrating the ecological and economic dimensions in 646
biodiversity and ecosystem service valuation. In: Kumar P (ed.) The Economics of Ecosystems 647
and Biodiversity. Ecological and Economic Foundations. Earthscan, London and Washington, 9-648
40. 649
Eggert H, Olsson B (2009) Valuing multi-attribute marine water quality. Marine Policy, 33 (2), 201-650
206. 651
Ferrini S, Scarpa R (2007) Designs with a priori information for nonmarket valuation with choice 652
experiments: A Monte Carlo study. Journal of Environmental Economics and Management, 53 653
(3), 342-363. 654
Forewind (2010) Dogger Bank zonal characterisation report. Version 4, October 2011, Reading. 655
Freeman AM (2002) How much is nature really worth? An economic perspective. The Shipman 656