Int. J. Communications, Network and System Sciences, 2011, 4, 42-52
doi:10.4236/ijcns.2011.41005 Published Online January 2011 (http://www.SciRP.org/journal/ijcns)
A Discrete-Time Traffic and Topology Adaptive Routing
Algorithm for LEO Satellite Networks
Wenjuan Jiang, Peng Zong
College of Astronautics, Nanjing University of Aeronautics and Astronautics, Nanjing, China E-mail: luckjj411@hotmail.com
Received October 13, 2010; revised November 9, 2010; accepted November 11, 2010
Abstract
“Minimizing path delay” is one of the challenges in low Earth orbit (LEO) satellite network routing algo-rithms. Many authors focus on propagation delays with the distance vector but ignore the status information and processing delays of inter-satellite links. For this purpose, a new discrete-time traffic and topology adap-tive routing (DT-TTAR) algorithm is proposed in this paper. This routing algorithm incorporates both inher-ent dynamics of network topology and variations of traffic load in inter-satellite links. The next hop decision is made by the adaptive link cost metric, depending on arrival rates, time slots and locations of source-destination pairs. Through comprehensive analysis, we derive computation formulas of the main per-formance indexes. Meanwhile, the perper-formances are evaluated through a set of simulations, and compared with other static and adaptive routing mechanisms as a reference. The results show that the proposed DT-TTAR algorithm has better performance of end-to-end delay than other algorithms, especially in high traffic areas.
Keywords:LEO Satellite Network, Discrete-Time Traffic and Topology Adaptive Routing (DT-TTAR) Algorithm, End-to-End Delay, Traffic Distribution, Snapshot
1. Introduction
To meet the rapidly growing real-time multimedia ser-vices, satellite networks should offer quality of service (QoS) guarantees. Geostationary Earth orbit (GEO) sat-ellites suffer from high propagation delay, which is not suitable for most applications. Therefore, focus has been directed towards development of non-geostationary (NGEO) systems, especially low Earth orbit (LEO) satel-lite systems, due to their superior performances such as extensive geographic coverage, small end-to-end delay, and inherent multicast capabilities and so on [1-4].
Inter-satellite links (ISLs) in new LEO satellite sys-tems introduce both challenges and opportunities to space segment routings [5]. Some authors capitalize on varies of ISLs and periodically evaluate the propagation delays in ISLs, considering this as the metric to be mini-mized in the route calculation process. A centralized routing scheme geared toward ATM-based LEO/MEO networks, called dynamic virtual topology routing (DVTR) [6], was proposed, which relied on the Dijkstra shortest path algorithm to compute the optimal path for any pair of satellites. After that, Werner [7] extended that
scheme by introducing a heuristic metric for calculating the cost of each ISL. Ekici et al. [8] introduced the data-gram routing algorithm (DRA) for an idealized polar constellation. It selected the one that most reduced the remaining distance to the destination as the candidate next hops. Sun et al. [9] dealt with static routing in a regular LEO satellite network that was modeled as a two-dimensional Nary hypercube. The minimum-hop path was found by the Dijkstra algorithm, and contention resolution schemes were investigated for maximizing the throughput. However, such schemes are not designed or not supposed to take into account traffic related metrics such as the queuing delay.
routing for traffic load balance in satellite systems first time. Unfortunately, it only used the local traffic infor-mation, which might not reflect the global traffic load distribution. The similar link cost was adopted by an explicit load-balancing (ELB) scheme [11], which achie- ved load balances by aware of traffic conditions at the next-hop satellite. This method reduced the packet drop-ping probability of each hop [12].
In this paper, a discrete-time traffic and topology ada- ptive routing (DT-TTAR) algorithm is derived without considering fractional handover but integer handover for a LEO satellite system. For the integer handover, the ground users are switched from one satellite to another entirely. On the hand, fractional handover allows the users shift to the other satellite individually depend on the coverage changing. Supposed the routing program is changing along with fractional handover, it has a name of continuous-time traffic and topology adaptive routing (CT-TTAR). In DT-TTAR algorithm, the routing pro-grams are kept “fixed” in each discrete interval. Such discrete-time topology still exhibits dynamic features in terms of considerable ISLs’ distance variations, and the traffic patterns on both up-down and inter-satellite links show variations due to the rapid relative movements be-tween serving satellites and served (global and inhomo-geneous) users’ distributions. The traffic model [13] in-corporated into the DT-TTAR algorithm, takes into ac-count both geographic and demographic factors. Another important aspect of the study is that Jackson queuing network model [14] is adopted to obtain the ISLs’ queu-ing delay.
The remainder of this paper is organized as follows: In Section 2, the topology architecture of the LEO satellite network is introduced. In Section 3, a reasonable method for calculating discrete-time intervals is derived. In Sec-tion 4, global traffic distribuSec-tion model is presented. A queuing model for inter-satellite links is computed in Section 5. Section 7 builds up simulations and analyzes the results. Finally, conclusions are given in Section 8.
2. LEO Constellation Architecture
The satellite network architecture looks like a Twisted Manhattan network [15]. In fact, a real network has small differences which affect the optimal routing in this mesh architecture. To facilitate following discussions, some terminologies are first introduced in Table 1. The size of a LEO constellation is NLML , where NL is the
number of the orbits and ML is the number of satellites
per orbit. Each satellite has four inter-satellite links (ISLs): two to neighbors fore and aft in the same orbital plane, called intra-satellite links, and two to satellites in neighboring orbits to either side, called inter-satellite
links. A paradigm of a π-Constellation in two-dimensional plane is shown in Figure 1.
The intra-satellite links are maintained permanently whereas the inter-satellite links between adjacent orbits must be switched-off due to the relative position ex-changes when two satellites in consideration cross the poles. In fact, the periodically topological changes of a constellation are resulted from inter-satellite links’ swit- ches. For example, when satellite 3,2 (the second satel-lite in the third orbit in Figure 1) approaches the polar area, the ISLs
S
3,2 2,2
S S and S3,2S4,2 should be swit- ched-off.
3. Discrete-Time Intervals Determination
In the earth-fixed cell system [16], the cell on the Earth is fixed and the satellites’ antenna beams are steered so as to point toward this fixed cell during some intervals. The status of satellites and related links should be fre-quently collected in order to accurately depict the current network status. If we consider an instant and think the network as static, the routing can be done easier. Ac-cording to our assumption, we associate the routing in-formation with the virtual network model [17]. In the virtual network model, the Earth is uniformly divided into NLML terrestrial zones which are corresponding
to NLML virtual nodes. The terrestrial zone
corre-sponding to a footprint area of a satellite is rectangle, contiguous and non-overlapping, and each of them has its logical address Z ii, 1, 2,,NLML
1
. When the satel-lites move on their orbits, they switch logical addresses in a discrete manner. Figure 2 is a paradigm of virtual net-work model with 66 virtual nodes, and the logical ad-dresses of terrestrial zones from Z to Z66 are allo-cated longitudinally.
Definition 1. Let z be a time unit for a satellite to
travel a distance that equals to the width of a zone in
Figure 2.
Table 1. Terms and their meanings for satellite orbits [13].
Terms Descriptions
NL the number of orbits in a LEO satellite constellation
ML the number of satellites per-orbit
Si,j the jth satellite in the ith orbit
vs the angular velocity of a LEO satellite
T the period of a satellite network
the latitude of the polar area border
h the radius of the satellite orbit
W. J. JIANG ET AL. 44
Figure 1. Topology of a π-Constellation with 6 11 satellites.
Figure 2. Virtual network model.
w z
s
d v
(1) a specific area one after other [18]. If ML is even, cT ML . It is indicated that satellite Si1,j and
1,mod 2,
w is the width of a zone and
d vs is the speed of a
satellite. Traffic in a zone currently is served by a given satellite Si,j and then will be served by satellite Si,j+1on the same orbit after z time units.
L L
i j M M
S are geometrically symmetric with re-spect to the center of the earth. On the other hand, ML
is odd, c T 2ML.
Definition 3. Let d be a switch-off duration of an
ISL Si1,jSi j, traversing one polar area and can be cal-Definition 2. Let τc be an interval between two
culated by Equation (2) [18].
2 4 L
d
s
M v
(2)
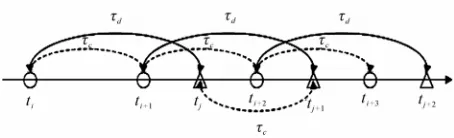
Definition 4. Let s be the length of a snapshot in our
network model. It is determined by c and d as
shown in Figure 3. ti and tjare the entrance occurrence
and the departure occurrence respectively.
Case 1 d kc,k: a interval of topological dy-namics caused by entrance and departure activities is
s c .
Case 2 d kc,k: a interval consists of two dis-tinct values smax and smin which can be calculated by Equation (3).
max min
max mod , , mod ,
min mod , , mod ,
s d c c
s d c c
d c d c
(3)
The link state information for each satellite is col-lected at each snapshot. Figure 4 shows the discrete-time intervals in a LEO satellite system. The period of the link state information S is determined by the least common multiple of
s, z
.4. Traffic Generation
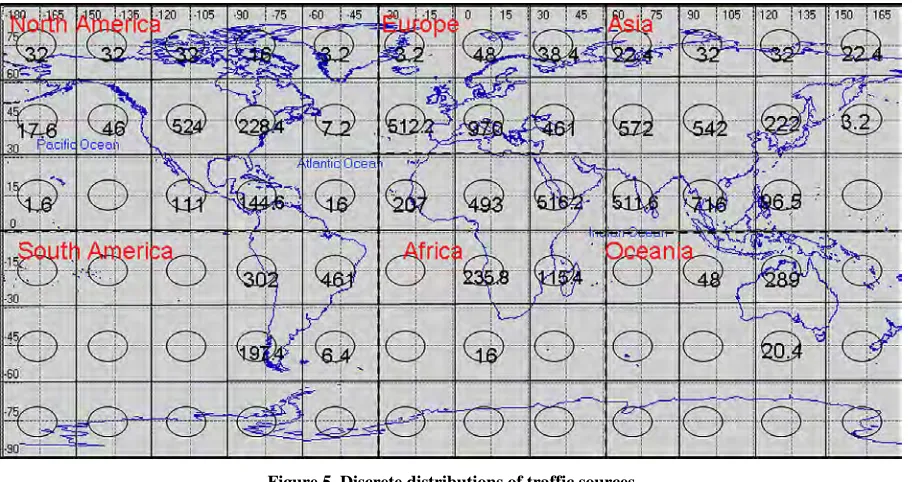
Because of the asymmetry of the IP traffic, the user be-havior and host bebe-havior are different for each zone. We build two databases for the user density level and the host density level for each zone [19]. A distribution of traffic sources on the Earth surface is shown in Figure 5. Numbers in circles denote the user level ui,j (million
minutes/year) corresponding to zones Zij in Figure 2.
[image:4.595.309.536.78.147.2]The larger the number is, the more calls are collected. It
Figure 3. Determination of snapshots with c and d.
can be seen that satellites covering medium latitude or land mass regions will probably collect more calls from ground than satellites crossing polar or oceans regions.
According to these data, the host level hi,j of zone Zi,j
can be obtained by Equation (4) [13]:
, ,
i j i j h
k
u h
u k
N k (4)where Nh
k is the number of hosts in continent k, and
k
u k
is the sum of users’ density levels of zones in continent k.The traffic requirement from zone Zi,j to zone Zm,n is
proportional with the users’ density ui,j, host density hm,n,
and distances between centers of two zones d(Zi,j, Zm,n).
, ,
, ,
, ,
,
, , 1, 2, ,1
,
i j m n i j m n z
i j m n
u h
Traffic Z Z k k
d Z Z
1
(5)
1, 2, , c
k n , c is the number of topology changes
during an orbit period.
n
0.5, 1.5
[13]. We as-sume that the arrival of packets from Zi,j to Zm,n is a
Pois-son process with rate
Zi j, ,Zm n, ,kz
,(packets/second).
k1, 2,,nc
[image:4.595.65.528.509.707.2]W. J. JIANG ET AL. 46
Figure 5. Discrete distributions of traffic sources.
, ,
, ,
, ,
, ,
, ,
, ,
,
1, 2, ,11
100 3600
i j m n
i j m n z i j m n z
i j m n Z Z
Traffic Z Z k
Z Z k
Traffic Z Z
a A
k
(6)
a is the activity percentage in the corresponding hour [13] and A is the aggregate traffic that represents total traffic generated worldwide a day (packets per day).Note that arrival rate is not only affected by locations of the source-destination pair, but also a function of time slot.
5. Queuing Model and Queuing Delay
In a LEO satellite network, an inter-satellite link can be modeled as a finite capacity queue (see Table 2) [20].
Figure 6 shows a stationary open Jackson queuing net-work for analysis of the queuing delay [14]. The arrival is assumed to follow Poisson process with rate. Service time of satellite i may be exponential-distributed with service rate i. ij in Equation (7) is a routing
prob-ability from satellite i to j.
q
1
1 1
M id ij
i
q q i
M1
(7)
where d is the destination, 0qij . In real satellite
networks, some of ij’s values may be zero, which
represents that no packet enters into the queue. i q
is the sum of the arrival rates into inter-satellite link i from all sources and can be computed by Equation (8):
1
1
M i si ki K
k
q q i
M
(8)where s is the source and qsi is the arrive from source. i
is the severing utilization of the inter-satellite link i, which reflects directly traffic load on the link.
1
i i
i
(9)
[image:5.595.309.538.481.702.2]Equation (8) and (9) give the relationships among in-
Table 2. Parameters of a queuing system [20].
Terms Descriptions
arrival rate
service rate
s
t average time spending packets in server per packet
p
t average time spending packets in queue per packet
server utilization
L average packet size
ter-satellite links in a network.
Based on the queuing theory and Little’s equation [21], the queuing delay and some parameters of ISLs’ state information can be deduced by following equations. The average service rate of a satellite i can be written as:
0
i
C L
(10)
0 is an inter-satellite link’s capacity and L is the av-erage packet length. The service delay is calculated by
C 1 s i t
(11)
The pending delay in a queue is given by
i
p
i i i
t
(12)
Finally, the queuing delay of an inter-satellite link can be obtained as:
0
1
q s p
i i i
L
E t t
C L
(13)
6. Routing Algorithms
When designing the routing algorithm, a suitable link- cost metric must be introduced firstly, which can repre-sent the information of network status. In this algorithm, there are two dynamically changing parameters, which have significant effects on the routing performance. The first one is the propagation delay, which is determined by ISLs’ distances and can be calculated in advance. The second one is the queuing delay. It is affected by the traf-fic load on a particular satellite and its outgoing links, as the satellite’s coverage traverses varying traffic zones. In this paper, in each snapshot, the link-cost metric can be calculated as:
cost d
L E Eq (15)
where d denotes the propagation delay updating with
discrete interval
E
s
, which takes into account the spe-cific dynamics of the LEO satellite system. It has dis-cussed in our previous works, considering the motion of satellites [22]. q denotes a predicted value of the
queuing delay updating with discrete interval
E
z . Sup-pose a path passing M satellites and the queuing delay of this path can be given as:
1 1 1
1 1
1
M M M
i
q z qi
i i i i z i i z
E k E t
k k
(16)1, 2, , c
k n . Combined Equation (9) with Equation
(16), Equation (17) can be obtained:
1 1 1 1 1 1 M Mq z q
i i i i z
M
M i
i si z ki K z
k
E k E t
k
q k q k
(17)where k1, 2,,nc, and i, 1 i M is calcu-lated by Equation (7).
This paper will modify Dijkstra’s algorithm to give a result that is relevant to our case. In this algorithm, the shortest path is defined as the minimum-delay path. Here, we assumed that topology model and traffic model are changed with a discrete-time manner, which is mentioned in Section 3. Thus, a discrete-time traffic and topology adaptive routing (DT-TTAR) algorithm is proposed. It can be described as follows:
Step1. Initialize routing tables and link-cost of all satel-lites and ISLs.
Step 2. For t
k1
z,,kz //initiate k = 1For t
p1
s,,ps //initiate p = 1 {for all the ISLs}1) Calculate link-cost Lcosti
kz
of all the ISLs using Equation (15) with current arrival rate
i k z
. The propagation delay Edi
ps
can be obtained in advance and the queuing delay Eqi
kz is the average queuing delay in an interval kz.2) An iterative calculation of a modified Dijkstra’s algorithm is used to discover feasi-ble, minimum-delay paths between each satel-lite and every other satelsatel-lite.
3) The path-cost Pcosti
kz of a minimum- delay path i is the sum of link-cost of all links on the path.4) If t ps p = p + 1;
Update the propagation delay Edi
ps
and the routing tables.5) If tkZ k = k + 1;
Update arrival rate i
k z
and the routing tables.6) Else, repeat from Step 2.
Step 3. Obtain the minimum-path routing tables and delays in every snapshot.
To compare the end-to-end delays of different schemes, one static and two adaptive shortest path algorithms are considered in this study [23]:
W. J. JIANG ET AL. 48
destination. Otherwise, it sends in x direction (East or West). The established route consists of two straight paths that first goes in y direction, and then in x direction (if s and d are in different longitudes and latitudes).
2) Fixed Adaptive Routing (FAR): A satellite that re-ceives a packet, always selects dir y as the initial direc-tion. If dir y is empty or ISL on that direction is busy, it tries dir x.
3) Random Adaptive Routing (RAR): Satellite ran-domly selects one of the dir y or dir x. If it is empty or ISL on that direction is busy, it tries the other direction.
7. Simulations and Results
7.1. Setting up Simulations
Iridium constellation is chosen for simulations. Table 3
[image:7.595.59.540.394.705.2]gives relative parameters of Iridium constellation. For simplicity, all ISLs are assumed to be identical (in terms of length and capacity): Capacity of each ISL is assumed to be 0.16 Gbps and a buffer is 40 Mbytes. A packet size is assumed to be 1 Kbyte.
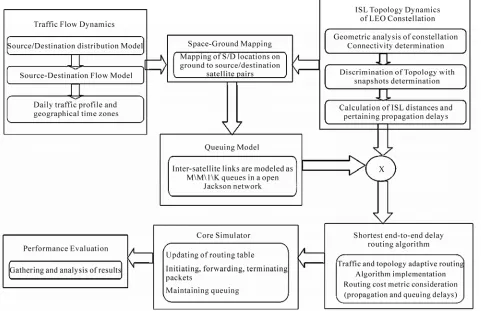
Figure 7 gives the simulation diagram of proposed DT-TTAR algorithm, which includes all the modules and
their functions. In this paper, simulations can be com-pleted mainly with four steps:
1) Topology model of Iridium constellation, which considers network connectivity and topology dynamics in a discrete-time manner;
2) A global traffic flow model based on different geo-graphic user distributions;
3) A link-cost ISLs’ dynamic characteristics and the traffic load on inter-satellite links;
4) A simulation model covering packets generation and forwarding, queue management and implementation of the DT-TTAR algorithms considered.
7.2. Results Analysis
The first step of experiments researches a dynamic to-pology of Iridium constellation. Table 4 presents the discrete interval distributions of Iridium system under different polar border threshold . z, s, smin and
max
s
are the theoretical results according to the analysis in Section 3. In an Iridium system, the number of satel-lites in each orbit is odd, a snapshot s separates into
two parts smin and smax. Different values only determine the partition of s into smin and smax.
Table 3. Parameters of iridium satellite constellation [24].
LEO Iridium
Altitude h = 780 km
Number of plane NL = 6
Number of satellite per plane ML = 11
Orbital velocity of the satellites = 27,000 km/h
Orbital Period (min) 100.4
Inclination i 82.2970 (deg)
Number of intra-plane ISLs 2
[image:8.595.56.285.282.354.2]Number of inter-plane ISLs 2
Table 4. Discrete intervals distributions of iridium system.
System () z s s s smin s smax s
Iridium 60 547.63 273.95 91.32 182.63
65 547.63 273.95 7.05 266.90
70 547.63 273.95 111.22 162.73
In this simulations, is chosen. The length of snapshot
60
s
is 273.95 s and it is separated into smax = 182.63 s and smin = 91.32 s. It is can be seen that an Iridium satellite travels through a traffic zone using 547.63 s, which is about twice a discrete interval 273.95 s. It means that 4 topology changes of Iridium system will occur during a satellite travelling through a traffic zone, successively at
, ,min smax and smin smax . This model
of discrete-time intervals in an Iridium system can be named as an alternating dual-topology model.
mi
s
t t
n
2
t min
2
maxs s
t2s
The second step of experiments analyzes arrival rates based on global traffic flow model. Figure 8 shows the arrival rates of different traffic zones at a given time. The higher the bar is, the larger the arrival rate is. There are zones in X-Y plane corresponding to 66 satellites in a constellation. It can be seen that distributions of ar-rival rates are assigned according to traffic requirements in Equation (6). Satellites covering medium latitude or land mass regions have larger arrival rates than satellites crossing oceans.
6 11
In our experiments, three inter-satellite links in differ-ent areas are chosen to observe the assignmdiffer-ents of global traffic. The first pair is located at and
in Asia. The second pair is located at in Oceania and over the Atlantic. The last link connects two satellites at
and ( in Africa.
(115E, 40N)
, 65 )
W N
(78E, 32N) (45W, 32N)
(137E, 20 )
(50
) S
S 145E, 32
The dynamic arrival rates of these three inter-satellite
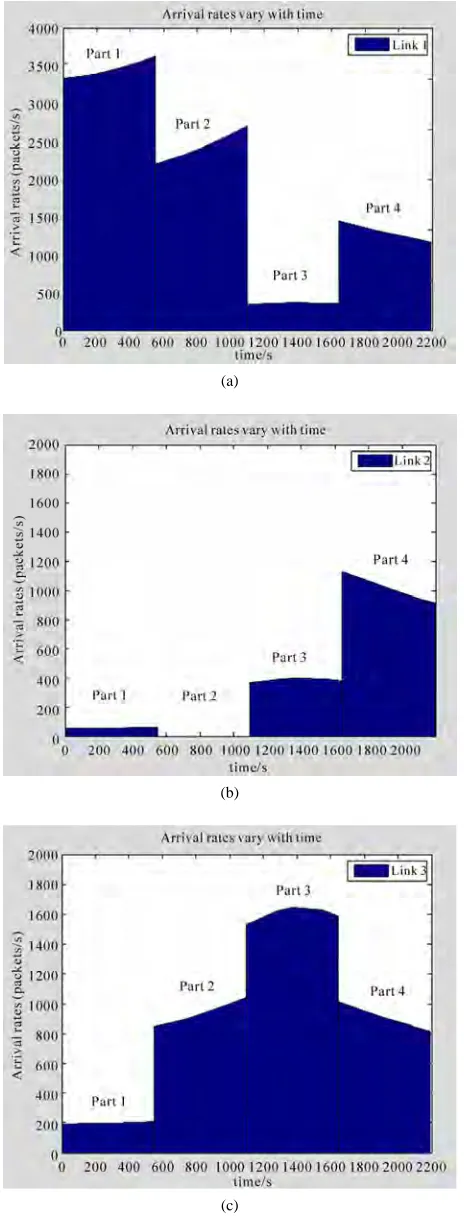
links are depicted in Figures 9(a), (b) and (c), respec-tively. The time unit of an Iridium satellite travelling a traffic zone is about 547.63 s, so there are four parts in
Figure 9 corresponding to four consecutive traffic zones during simulation time (2200 s). Non-uniform traffic dis-tribution is the main reason for variations of arrival rates in different parts. For example, in Figure 9(a), the inter- satellite link starts in Asia with high traffic requirements and the arrival rate in part 1 are about 3500 packet/sec. After 18 minutes, it goes into Oceania area in part 3 and arrival rate decreases to 250 packet/sec. In addition, we can find that there are small varies of arrival rates in each part, that is because the distances between to satellite change with time.
At last, we compare the performance of the end-to-end delay which are computed by proposed DT-TTAR algo-rithm and three other routing algoalgo-rithms: static shortest path routing (STA), fixed adaptive routing (FAR) and random adaptive routing (RAR).
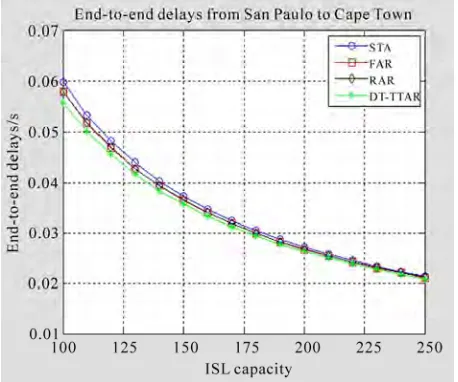
Simulations are based on the observation of the end-to-end delay between three terrestrial source-desti- nation pairs. The source nodes of the first two pairs are both located in North America: Washington D.C. and San Jose. The destination nodes are at Sydney in Oceania and Buenos Aires in South African. The third pair is from San Paulo in South America to Cape Town in Af-rican. The path associated with the third pair does not travel through high traffic concentration areas.
To compare the performances of the end-to-end delay in different schemes, we increase the ISLs’ capacity gradually. The end-to-end delay of DT-TTAR algorithm and three other routing algorithms are depicted in Fig. 10-12. It can be seen that all of the end-to-end delays are decreasing with ISL capacity increasing.
[image:8.595.310.537.525.691.2]When the ISL’s capacity is more than 200, the end- to-end delays of four algorithms are similar, even for
W. J. JIANG ET AL. 50
(a)
(b)
[image:9.595.57.289.78.686.2](c)
Figure 9. Arrival rates of three satellite pairs vary with time, (a) Inter-satellite link 1; (b) Inter-satellite link 2; (c) Inter- satellite link 3.
the path crossing high traffic concentration area, e.g., source-destination pair 1. This is reasonable because when the ISL capacity is large enough, the queue is short even empty. However, in Figure 10, as the ISL capacity decreases, the delays’ curves of STA, FRA and RPR deviate from the curve returned by DT-TTAR algorithm obviously. The end-to-end delays of the paths calculated by RPR and FAR increase dramatically when the ISL capacity smaller than 125. That is because when the server rates become slow, the pending queue of in-ter-satellite link 1 with higher traffic load tends to be very long even full more easily. Whereas the routing scheme based on DT-TTAR can choose the shorter delay paths and reduce the traffic entering into the congested areas.
The second pair has the similar curves as the first pair. DT-TTAR performs the best and STA performs the worst. The end-to-end delay of STA and RPR are very close to each other. However, in Figure 11, the maxi-mum value about 0.081s is only half the value of 0.16s in
Figure 10. Delays’ curves of second pair decrease more slowly with ISL capacity increasing. That is because source-destination pair 2 goes through paths with lighter traffic than source-destination pair 1 does.
For the path only through areas with lower traffic con-centration, e.g., source-destination pair 3, the delays’ curves of STA, FAR and RPR are very close to DT- TTAR. Even when the ISL capacity is smaller than 125 (compare with source-destination pair 1), the end-to- end delays deviation from the DT-TTAR for STA, FAR and RPR are within 0.05 s, 0.05 s and 0.25 s, respectively. That is because the links in areas with very light traffic are seldom congested. Comparing Figures 10, 11 and 12, we can find that DT-TTAR algorithm has better per- formance of the end-to-end delay, especially for the path that travels through high traffic areas.
8. Conclusions
In this paper, a new discrete-time traffic and topology adaptive routing (DT-TTAR) algorithm in LEO satellite networks is addressed. It is able to adapting to inherent dynamics of network topology and variations of traffic load of satellites’ coverage in a discrete manner. The decision criterion of the routing algorithm depends on the link-cost metric mostly concerned by the propagation delay and the queuing delay. The propagation delay is determined by motions of the satellites. The queuing delay is evidently affected by the mechanisms of the queuing network and traffic load on ISLs. The perform-ance evaluation has been carried out with a set of simula-tions.
Figure 10. Comparisons of end-to-end delays of S-D pair 1.
Figure 11. Comparisons of end-to-end delays of S-D pair 2.
Figure 12. Comparisons of end-to-end delays of S-D pair 3.
performance of end-to-end delay than three other shortest path algorithms: STA, FAR and RAR. Especially in some high traffic concentration areas, DT-TTAR algo-rithm has obvious advantages in end-to-end delay char-acteristics. However, our algorithm will cause the large sum of routing changing as all the satellites shift their entire traffic to the others. The more sophisticated rout-ing algorithms are required to meet the dynamic traffic accessing against the topological coverage changing. Meanwhile, our algorithm only focuses on the perform-ance of end-to-end delay and a more comprehensive performance evaluation of a routing algorithm should be considered. Thus, we might enhance DT-TTAR algo-rithm as continuous-time traffic and topology routing algorithm (CT-TTRA) in order to attain traffic load bal-ance and the maximum throughput accurately, as well as minimum end-to-end delay.
9. References
[1] J. Farserotu and R. Prasad, “A Survey of Future Broad-band Multimedia Satellite Systems, Issues and Trends,” IEEE Wireless Communication Magazine, Vol. 38, No. 6, 2000, pp. 128-133. doi:10.1109/35.846084
[2] T. Taleb, N. Kato and Y. Nemoto, “Recent Trends in IP/NGEO Satellite Communication Systems: Transport, Routing, and Mobility Management,” IEEE Wireless Com- munication Magazine, Vol. 12, No. 5, 2005, pp. 63-69. [3] T. Gayraud and P. Berthou, “Research Article: A QoS
Architecture for DVB-RCS Next Generation Satellite Networks,” EURASIP Journal on Wireless Communica-tions and Networking, Vol. 2007, 2007, pp. (58484)1-9. [4] R. E. Sheriff, A. Donner and A. Vanelli-Coralli, “Satellite
Communications,” EURASIP Journal on Wireless Com-munications and Networking, Vol. 2007, 2007, pp. (058964) 1-2.
[5] F. Alagoz, O. Korcak and A. Jamalipour, “Exploring the Routing Strategies in Next-Generation Satellite Networks,” IEEE Wireless Communications, Vol. 14, No. 3, 2007, pp. 79-88. doi:10.1109/MWC.2007.386616
[6] M. Werner, “A Dynamic Routing Concept for ATM Based Satellite Personal Communication Networks,” IEEE Jour-nal on Selected Areas in Communications, Vol. 15, No. 8, October 1997, pp. 1636-1648. doi:10.1109/49.634801
[7] M. Werner, C. Delucchi, G. Maral and J. J. D. Ridder, “ATM-Based Routing in LEO/MEO Satellite Networks with Intersatellite Links,” IEEE Journal on Selected Ar-eas in Communications, Vol. 15, No. 1, 1997, pp. 69-82. doi:10.1109/49.553679
[8] E. Ekici, I. F. Akyildiz and M. D. Bender, “A Distributed Routing Algorithm for Datagram Traffic in LEO Satellite Networks,” IEEE/ACM Transactions on Networking, Vol. 9, No. 2, 2001, pp. 137-147. doi:10.1109/90.917071
[image:10.595.58.287.512.703.2]W. J. JIANG ET AL. 52
No. 2, 2004, pp. 273-286. doi:10.1109/JSAC.2003.819 975
[10] E. Papapetrou, S. Karapantazis and F. N. Pavlidou, “Dis-tributed On-demand Routing for LEO Satellite Systems,” Computer Networks, Vol. 51, No. 15, 2007, pp. 4356- 4376. doi:10.1016/j.comnet.2007.05.008
[11] T. Tarik, M. Daisuke and A. Jamalipour, “Explicit Load Balancing Technique for NGEO Satellite IP Networks with On-Board Processing Capabilities,” IEEE/ACM Trans- actions on Networking, Vol. 17, No. 1, 2009, pp. 281-293. doi:10.1109/TNET.2008.918084
[12] Y. Rao and R.-C. Wang, “Agent-Based Load Balancing Routing for LEO Satellite Networks,” Computer Net-works, Vol. 54, No. 17, 2010, pp. 3187-3195. doi:10. 1016/j.comnet.2010.06.019
[13] C. Chen and E. Ekici, “A Routing Protocol for Hierar-chical LEO/MEO Satellite IP Networks,” Wireless Net-works, Vol. 11, No. 4, 2005, pp. 507-521. doi:10.1007/ s11276-005-1772-1
[14] Z. Y. Sheng, “Queuing Theory and Applications in Mod-ern Communications,” Posts & Telecommunications Press, Beijing, 2007.
[15] L. Wood, A. Clerget, I. Andrikopoulos, G. Pavlou and W. Dabbous, “IP Routing Issues in Satellite Constellation Networks,” International Journal of Satellite Communi-cations, Vol. 19, No. 1, 2001, pp. 69-92. doi:10.1002/sat. 655
[16] W. A. Bukhsh, B. L. G. Jonsson and P. Persson, “Ele-ment Position Perturbation for a Narrow Spot Beam with Applications to Satellite Communication Antennas,” Pro-gress in Electromagnetics Research, Vol. 104, 2010, pp. 283-295. doi:10.2528/PIER10040602
[17] O. Korcak and F. Alagoz, “Virtual Topology Dynamics and Handover Mechanisms in Earth Fixed LEO Satellite Systems,” Computer Networks, Vol. 53, No. 9, 2009, pp. 1497-1511. doi:10.1016/j.comnet.2009.01.010
[18] J. F. Wang, L. Li and M. T. Zhou, “Topological Dynam-ics Characterization for LEO Satellite Networks,” Com-puter Networks, Vol. 51, No. 1, 2007, pp. 43-53. doi:10. 1016/j.comnet.2006.04.010
[19] M. D. Voilet, “The Development and Application of a Cost per Minute Metric of the Evaluation of Mobile Sat-ellite Systems in a Limited-Growth Voice Communica-tion Market,” Master’s Thesis, Massachusetts Institute of Technology, Cambridge, 1995.
[20] J. Banks, et al., “Discrete-Event System Simulation,” China Machine Press, Beijing, 2005.
[21] K S. Trivedi, “Probability & Statistics with Reliability, Queuing, and Computer Science Application,” Prentice- Hall, Inc., Upper Saddle River, 1982.
[22] W. J. Jiang and P. Zong, “Prediction and Compensation of Sun Transit in LEO Satellite Systems,” Proceedings of International Conference on Communications and Mobile Computing, Vol. 3, Shenzhen, 12-14 April 2010, pp. 495-499. doi:10.1109/CMC.2010.206
[23] Ö. Korçak, “Routing and Network Mobility Management in Next Generation Satellite Networks,” Ph.D. Thesis, Bogaziçi University, Bebek, 2009.
![Table 3. Parameters of iridium satellite constellation [24].](https://thumb-us.123doks.com/thumbv2/123dok_us/9005507.397314/8.595.59.286.96.254/table-parameters-of-iridium-satellite-constellation.webp)