LABORATORY PERSISTENCE STUDY OF BISPYRIBAC
1
Jakka Mastan,
*, 2B. N., Srinivas,
1
Department of Chemistry, Krishna University, Machi
2
Usharama College of Engineering
ARTICLE INFO ABSTRACT
Laboratory persistence studies were performed in water at pH 4.0, 7.0, and 9.0 using bispyribac sodium 40% SC (w/v) formulation at the rates of T0
µg/mL. The different pH Waters samples have been kept under sunlig
Acidic water: 0, 5, 10, 20 and 50 days for acidic water (pH 4.0), basic and Neutral water: 0, 5, 10, 20, 50, 70 and 90 days Samples collected on different occasions were analysed for Bispyribac content by a validated
86.33% ± 1.74, 87.50% ± 1.20 and 89.0% ± 1.23 at 0.05 µg/mL and 91.33% ± 1.33, 93.0% ± 1.67 and 94.83% ± 1.82 at 0.5 µg/mL fortification level for acidic, neutral and basic water respect The method has a limit of quantification (LOQ) 0.05 µg/mL. The DT50 (Half Life) of bispyribac sodium calculated by regression analysis from the dissipation data.
Copyright © 2016, Jakka Mastan et al. This is an open access article distributed distribution, and reproduction in any medium, provided the original work is properly cited.
INTRODUCTION
Bispyribac sodium is used to treat the invasive Eurasian watermilfoil (Myriophyllum spicatum) as well as h (Hydrilla verticillata), an invasive submerged plant not currently found in Wisconsin. Sago pondweed (Stuckenia pectinata), a desirable native species, may also be affected by treatment (Shimin Wu et al., 2011) Bispyribac sodium is a systemic herbicide that moves throughout the plant tissue and works by interfering with production of a plant enzyme necessary for growth, acetolactate synthase (ALS). Bi
sodium, sodium 2,6-bis [(4, 6- dimethoxy-
2-benzoate which was first developed by Japan Kumiai Chemical, belongs to the pyrimidinyl oxybenzoic acid group (Tamilselvan et al., 2014) In rice planting, bispyribac
is absorbed through the leaf surface and translocated throughout the plant to inhibit the activity of acetolactate synthase, which results in death of the weeds. The present research was aimed to investigate the fate of residues of Bispyribac sodium in three different aqueous buffer solutions under sun light.
*Corresponding author: Srinivas, M. V.,
Usharama College of Engineering & Technology, Telaprolu, Vijayawada, Andhra Pradesh, India.
ISSN: 0975-833X
Article History:
Received 20th July, 2016
Received in revised form 22nd August, 2016
Accepted 08th September, 2016
Published online 30th October,2016
Key words:
Bispyribac-sodium 40% SC (w/v), Dissipation, DT50, Residues and aqueous buffer solutions.
Citation: Jakka Mastan, B. N., Srinivas, M. V., Basaveswara Rao
in acidic, neutral and basic water”, International Journal of Current Research
RESEARCH ARTICLE
LABORATORY PERSISTENCE STUDY OF BISPYRIBAC-SODIUM IN ACIDIC,
NEUTRAL AND BASIC WATER
B. N., Srinivas,
1M. V., Basaveswara Rao and
1Tentu. Nageswara Rao
Department of Chemistry, Krishna University, Machilipatnam, Andhra Pradesh, India
College of Engineering and Technology, Telaprolu, Vijayawada, Andhra Pradesh, India
ABSTRACT
Laboratory persistence studies were performed in water at pH 4.0, 7.0, and 9.0 using bispyribac sodium 40% SC (w/v) formulation at the rates of T0 – Untreated Control, 1.0 (T1) and 2.0 (T2) µg/mL. The different pH Waters samples have been kept under sunlig
Acidic water: 0, 5, 10, 20 and 50 days for acidic water (pH 4.0), basic and Neutral water: 0, 5, 10, 20, 50, 70 and 90 days Samples collected on different occasions were analysed for Bispyribac content by a validated HPLC method. The average percent recovery for Bispyribac
86.33% ± 1.74, 87.50% ± 1.20 and 89.0% ± 1.23 at 0.05 µg/mL and 91.33% ± 1.33, 93.0% ± 1.67 and 94.83% ± 1.82 at 0.5 µg/mL fortification level for acidic, neutral and basic water respect The method has a limit of quantification (LOQ) 0.05 µg/mL. The DT50 (Half Life) of bispyribac sodium calculated by regression analysis from the dissipation data.
is an open access article distributed under the Creative Commons Attribution License, which distribution, and reproduction in any medium, provided the original work is properly cited.
used to treat the invasive Eurasian
watermilfoil (Myriophyllum spicatum) as well as hydrilla ), an invasive submerged plant not
currently found in Wisconsin. Sago pondweed (Stuckenia es, may also be affected by Bispyribac sodium is a systemic herbicide that moves throughout the plant tissue and works by interfering with production of a plant enzyme necessary for growth, acetolactate synthase (ALS).
Bispyribac--pyrimidinyl) oxy] benzoate which was first developed by Japan Kumiai Chemical, belongs to the pyrimidinyl oxybenzoic acid group ., 2014) In rice planting, bispyribac- sodium through the leaf surface and translocated throughout the plant to inhibit the activity of acetolactate synthase, which results in death of the weeds. The present research was aimed to investigate the fate of residues of t aqueous buffer solutions
Usharama College of Engineering & Technology, Telaprolu,
MATERIALS AND METHODS
Reference analytical standards of bispyribac sodium
99.8%) were obtained from Sigma Aldrich. The test item bispyribac sodium 40% aqueous suspension concentrates (SC) was purchased from local market. Acetonitrile, Water HPLC grade, formic acid AR grade, Sodium hydroxide LR grade, Potassium chloride GR grade, Boric acid GR grade, Potassium biphthalate GR grade and Potassium phosphate AR grade were obtained from the Merck India limited. Distilled water was purified by using the
Milli-Bedford, MA, USA).
Standard stock solution
Accurately 25.55 mg of bispyribac sodium reference standard, purity (99.8 %) was weighed into 50 mL volumetric flask. The content was dissolved in 10 mL of acetonitrile, sonicated and made up to the mark with the same solvent. The concentration was 510 µg/mL solution and stored in a freezer at
stock standard solutions were used for up to 3 months. Suitable concentrations of working standards were prepared from the stock solutions by dilution using acetonitrile, immediately prior to sample preparation.
Sample stock solution
Accurately 124.2 mg of test item (purity 40.26%) of bispyribac sodium was taken into a 50 mL volumetric flask. The content
International Journal of Current Research Vol. 8, Issue, 10, pp.39762-39766, October, 2016
INTERNATIONAL
Basaveswara Rao and Tentu. Nageswara Rao, 2016. “Laboratory persistence study of bispyribac
International Journal of Current Research, 8, (10), 39762-39766.
SODIUM IN ACIDIC,
Tentu. Nageswara Rao
lipatnam, Andhra Pradesh, India
Technology, Telaprolu, Vijayawada, Andhra Pradesh, India
Laboratory persistence studies were performed in water at pH 4.0, 7.0, and 9.0 using bispyribac-Untreated Control, 1.0 (T1) and 2.0 (T2) µg/mL. The different pH Waters samples have been kept under sunlight. The sampling occasions are Acidic water: 0, 5, 10, 20 and 50 days for acidic water (pH 4.0), basic and Neutral water: 0, 5, 10, 20, 50, 70 and 90 days Samples collected on different occasions were analysed for Bispyribac-sodium HPLC method. The average percent recovery for Bispyribac-sodium was 86.33% ± 1.74, 87.50% ± 1.20 and 89.0% ± 1.23 at 0.05 µg/mL and 91.33% ± 1.33, 93.0% ± 1.67 and 94.83% ± 1.82 at 0.5 µg/mL fortification level for acidic, neutral and basic water respectively. The method has a limit of quantification (LOQ) 0.05 µg/mL. The DT50 (Half Life) of bispyribac-sodium calculated by regression analysis from the dissipation data.
ribution License, which permits unrestricted use,
MATERIALS AND METHODS
Reference analytical standards of bispyribac sodium (purity 99.8%) were obtained from Sigma Aldrich. The test item bispyribac sodium 40% aqueous suspension concentrates (SC) was purchased from local market. Acetonitrile, Water HPLC grade, formic acid AR grade, Sodium hydroxide LR grade, GR grade, Boric acid GR grade, Potassium biphthalate GR grade and Potassium phosphate AR grade were obtained from the Merck India limited. Distilled water was -Q Plus apparatus (Millipore,
Accurately 25.55 mg of bispyribac sodium reference standard, purity (99.8 %) was weighed into 50 mL volumetric flask. The content was dissolved in 10 mL of acetonitrile, sonicated and made up to the mark with the same solvent. The concentration as 510 µg/mL solution and stored in a freezer at -20°C. The stock standard solutions were used for up to 3 months. Suitable concentrations of working standards were prepared from the stock solutions by dilution using acetonitrile, immediately
Accurately 124.2 mg of test item (purity 40.26%) of bispyribac sodium was taken into a 50 mL volumetric flask. The content
INTERNATIONAL JOURNAL OF CURRENT RESEARCH
was dissolved in 10 mL of acetonitrile, sonicated and made up to the mark with the acetonitrile. The concentration was 1000 mg/L solution. The stock sample solution was used for preparation of dose samples (T1 and T2) in different aqua’s buffers.
Preparation of acidic water (pH 4.0)
About 8g of potassium dihydrogen phosphate was dissolved in distilled water and diluted to 1000 mL. The pH was adjusted to 4.0 with the same.
Preparation of neutral water (pH 7.0)
About 6.3 g of disodium hydrogen was phosphate and 5g of potassium dihydrogen phosphate was dissolved in distilled water and diluted to 1000 mL. The pH of the buffer was adjusted with disodium hydrogen ortho phosphate and potassium dihydrogen phosphate.
Preparation of basic water (pH 9.0)
12.5g of boric acid & 15g potassium chloride was dissolved in distilled water and diluted to 1000 mL. The pH was adjusted to 9.0 using 0.1 M sodium hydroxide solution.
Application data
Name of the buffers Acidic, Neutral and Basic
Replications Three
Method of fortification T0 ( Untreated Control )
T1 (1 mg/L Level)
1.0 mL of test item stock solution was fortified in to 1000 mL (1Liter) different buffer samples to get the uniform concentrations.
T2 (2 mg/L Level)
2.0 mL of test item stock solution was fortified in to 1000 mL (1Liter) different buffer samples to get the uniform concentrations.
Sampling data
Samples Exposure Under direct sunlight Sample
preparation
During each sampling occasion, water samples were mixed thoroughly and sub sampled 20mL using a pipette.
Occasion (Days)
pH 4 (0, 5, 10, 20 and 50) and pH 7and 9 (0, 5, 10,
20, 50, 70 and 90) Laboratory
condition
Temperature
Minimum Maximum
20.1°C 25.7°C
Chromatographic separation parameters
The HPLC-UV system used, consisted shimadzu high performance liquid chromatography with LC- 20AT pump and SPD-20A interfaced with LC solution software, equipped with a reversed phase C18 analytical column of 150 mm x 4.6 mm and particle size 5 µm (Zorbax SB- C18) Column oven temperature was maintained at 30°C. The injected sample volume was 10µL. Mobile Phases A and B was Acetonitrile and 0.1% formic acid (55:45 (v/v)). The flow- rate used was kept at 0.8 mL/min with a detector wavelength at 240 nm. The external standard method of Calibration was used for this analysis.
Method validation
Method validation ensures analysis credibility. In this study, the parameters accuracy, precision, linearity and Limits of Detection (LOD) and Quantification (LOQ) were considered. The accuracy of the method was determined by recovery tests, using samples spiked at concentration levels of 0.05 and 0.5 µg/mL (Karri, Apparao et al., 2015; Nageswara Rao et al 2013; Tentu Nageswara Rao et al., 2015) Linearity was determined by different known concentrations (0.05, 0.1, 0.5, 1.0 and 2.0, 5.0 µg/mL) which were prepared by diluting the stock solution. The Limit of Detection (LOD, µg/mL) was determined as the lowest concentration giving a response of 3 times the baseline noise defined from the analysis of control sample (Steven J. Lehotay, 2000). The Limit of Quantification (LOQ, µg/mL) was determined as the lowest concentration of a given fungicide giving a response of 10 times the baseline noise13-15.
RESULTS AND DISCUSSION
Specificity
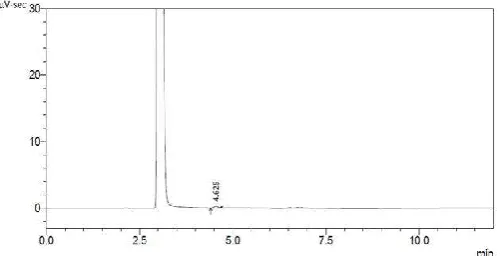
[image:2.595.32.291.377.502.2]Specificity was confirmed by injecting the Mobile phase solvents i.e., Acetonitrile and 0.1% formic acid, HPLC water, sample solution standard solution and buffer controls (acidic, neutral, basic) There were no matrix peaks in the chromatograms to interfere with the analysis of fungicide residues shown in Figure 1, Figure 2 and Figure 3. Furthermore, the retention time of bispyribac-sodium was constant at 4.6 ± 0.2 min. Different known concentrations of fungicides (0.05, 0.1, 0.5, 1.0, 2.0 and 5.0 µg/mL) were prepared into a different 10 mL volumetric flasks by diluting the stock solution. The serial dilution details were presented in Table 1. These standard solutions were directly injected into a HPLC. A calibration curve has been plotted for concentration of the standards injected versus area observed and the linearity of method was evaluated by analyzing six standard concentration solutions. The peak areas obtained from different concentrations of standards were used to calculate linear regression equation. This was Y=4342.8X + 1.1 with correlation coefficient of 0.9997 respectively. A calibration curve is showed in (Figure 4).
Accuracy and Precision
[image:2.595.311.562.633.761.2]The analytical method was validated for the recovery of the test item at two concentration levels with acidic, neutral and basic water.
Figure 1. Representative chromatogram of bispyribac-sodium test
Figure 2. Representative Chromatogram of bispyribac-sodium
[image:3.595.41.285.225.360.2]test item in neutral water - 70th day
Figure 3. Representative Chromatogram of bispyribac-sodium
[image:3.595.306.558.349.550.2]test item in basic water - 70th day Linearity
Table 1. Serial dilutions for linearity standard solutions
Stock solution concentration (µg/mL)
Volume taken from stock solution
(mL)
Final make up volume
(mL)
Obtained concentration
(µg/mL)
510 1.960 10 100
100 0.500 10 5
100 0.200 10 2
100 0.100 10 1
5 1.000 10 0.5
5 0.200 10 0.1
1 0.500 10 0.05
Figure. 4. Representative Calibration curve of bispyribac sodium standard
Preparation of Test item stock solution
Accurately 6.46 mg of test item (purity 50.12%) of bispyribac-sodium was taken into a 50 mL volumetric flask. The content was dissolved in 5 mL of acetonitrile, sonicated and made up
to the mark with the same solvent. This concentration was 52.0 mg/L solution.
Fortified test item concentration – 1 mg/L
0.481 mL of test item stock solution was taken into a 25 mL volumetric flask and made up to the mark with acetonitrile.
Preparation of 0.05 mg/L Fortification Level
0.5 mL aliquot of 1.0 mg/L test item solution was fortified into each of the 10mL of buffer solutions (acidic, neutral, basic). This was done in 6 replications.
Preparation of 0.5 mg/L Fortification Level
5.0 mL aliquot of 1.0 mg/L test item solution was fortified into each of the 10mL of buffer solutions (acidic, neutral, basic). This was done in 6 replications. The samples were assayed for accuracy and repeatability in HPLC. Accuracy was calculated as %recovery and repeatability as %RSD and the results are mentioned in Table 2.
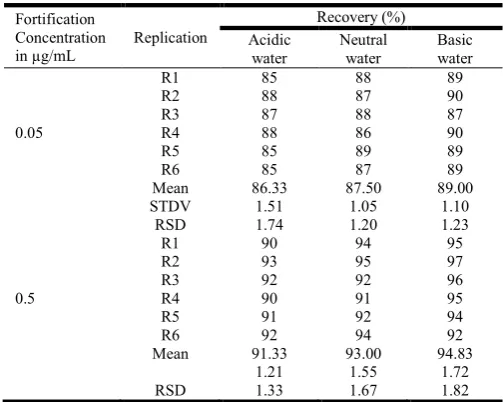
Table 2. Recoveries of the bispyribac sodium from aqueous buffer solutions samples (n=6)
Fortification Concentration in µg/mL
Replication
Recovery (%) Acidic
water
Neutral water
Basic water
R1 85 88 89
R2 88 87 90
R3 87 88 87
0.05 R4 88 86 90
R5 85 89 89
R6 85 87 89
Mean 86.33 87.50 89.00
STDV 1.51 1.05 1.10
RSD 1.74 1.20 1.23
R1 90 94 95
R2 93 95 97
R3 92 92 96
0.5 R4 90 91 95
R5 91 92 94
R6 92 94 92
Mean 91.33 93.00 94.83
1.21 1.55 1.72
RSD 1.33 1.67 1.82
Detection and Quantification Limits
The limit of quantification was determined to be 0.05 µg/mL. The quantitation limit was defined as the lowest fortification level evaluated at which acceptable average recoveries (86-95%, RSD<2%) were achieved. This quantification limit also reflects the fortification level at which an analyte peak is consistently generated at approximately 10 times the baseline noise in the chromatogram. The limit of detection was determined to be 0.02 µg/mL at a level of approximately three times the back ground of control injection around the retention time of the peak of interest.
Dissipation details
Acidic water
[image:3.595.39.289.425.686.2]to 0.874 µg/mL and 1.625 µg/mL. The 10th day samples showed the residues 0.712 µg/mL (T1) and 1.408 µg/mL (T2), 20th day samples showed 0.425 µg/mL (T1) and 0.856 µg/mL (T2). A complete dissipation of residues of bispyribac-sodium to below detectable level in both the tested dosages was observed on 50th day.
[image:4.595.37.290.498.653.2]Figure 5. Dissipation curve of bispyribac-sodium in acidic water
Figure 6. Dissipation curve of bispyribac-sodium in neutral water
[image:4.595.35.289.727.789.2]Figure 7. Dissipation curve of bispyribac-sodium in basic water
Table 3. Regression Analysis – Acidic water (pH -4) for of
bispyribac-sodium
Parameters Dosages
T1 T2
Regression équation Y = -0.0197*X+0.9663
Y = -0.0383*X+1.8269
Half-life (Days) 16.00 16.57
Correlation co-efficient 0.966 0.968
Table 4. Regression Analysis – neutral water (pH -7) for of
bispyribac-sodium
Parameters Dosages
T1 T2
Regression equation Y = -0.0100*X+0.8227 Y = -0.0197*X+1.6448
Half-life (Days) 20.55 20.99
Correlation co-efficient 0.908 0.877
Table 5. Regression Analysis – basic water (pH -9) for of bispyribac-sodium
Parameters Dosages
T1 T2
Regressionequation Y = -0.0084*X+0.6254 Y = -0.017*X+1.2633
Half-life (Days) 18.72 18.96
Correlation co-efficient 0.6249 0.6195
Neutral water
The initial concentration of Bispyribac-sodium in neutral water collected on 0 day was 0.995 µg/mL and 1.917 µg/mL in T1 and T2 dosages respectively, which on 5th day had dissipated to 0.874 µg/mL and 1.791 µg/mL. The 10th day samples showed the residues 0.591 µg/mL (T1) and 1.175 µg/mL (T2). Analysis of water samples collected on 20th day showed the residues 0.484 µg/mL and 0.874 µg/mL whereas 50th day samples showed 0.351 µg/mL and 0.798 µg/mL in (T1) and (T2) tested dosages respectively. By70th day the residue dissipated to 0.061 µg/mL and 0.121 µg/mL in (T1) and (T2) tested dosages. A complete dissipation of residues of Bispyribac-sodium to below detectable level in both the tested dosages was observed on 90th day.
Basic water
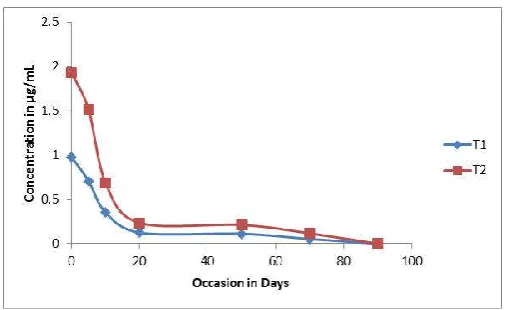
The initial concentration of Bispyribac-sodium in basic water collected on 0 day was 0.979 µg/mL and 1.932 µg/mL in T1and T2 dosages respectively, which on 5th day had dissipated to 0.706 µg/mL and 1.512 µg/mL. The 10th day samples showed the residues 0.349 µg/mL (T1) and 0.682 µg/mL (T2). whereas 20th day samples showed 0.124 µg/mL and 0.235 µg/mL in (T1) and (T2) tested dosages respectively. By 50th day the residue dissipated to 0. 112 µg/mL and 0.212 µg/mL in (T1) and (T2) tested dosages. Analysis of water samples on 70th day showed the residues to 0.054 µg/mL in (T1) and 0.117 µg/mL on (T2) tested dosages. A complete dissipation of residues of bispyribac-sodium to below detectable level in both the tested dosages was observed on 90th day.
The dissipation curve plotted between concentration of the analyte and sampling occasions is presented in Figure. 5, Figure. 6 and Figure. 7. DT50 value was calculated using the following formula
DT50 = ln 2/ (k)
Where,
‘k’ is slope of the curve obtained from the dissipation data.
days. Further the degradation of herbicide in basic water was rapid; the half-life value was around 18.96 days. The calculated DT 50 (Time required to degrade 50% of residues) values of bispyrabic sodium in different pH waters (Acidic (pH -4), Neutral (pH -7) and Basic (pH -9)) under the influence of sunlight presented in Table 3, 4 and 5. The rate constant value was calculated by linear regression equation from the first order rate equation (Prem Dureja et al., 2011; Jyot, Gagan et al., 2010)
K = ln a/a-x/dt
Where, dt is the time interval between t1 and t2 and a, x are the
concentration of pesticides at times t1 and t2 respectively. A
plot of concentration of the residues and rate with the R2 indicates first order kinetics in dissipation of the fungicide. The DT50 (Half Life) of bispyrabic sodium calculated by regression analysis from the dissipation data.
Conclusion
The Dissipation kinetics of bispyribac-sodium in different pH waters under direct sunlight become very fast whilst as compared with dissipation facts acquired at 25°C. In basic water degradation changed into faster while compared to acidic and impartial water. Dissipation of bispyribac-sodium in different pH waters followed first order kinetics and this paper describes a fast, simple sensitive analytical method based on HPLC-UV to determine the bispyribac-sodium residues in three different types of buffers. The mobile phase Acetonitrile and 0.1% formic acid confirmed excellent separation and decision and the analysis time required for the chromatographic determination of three different type of buffers is very short (around 12 min for a chromatographic run). Satisfactory validation parameters such as linearity, recovery, precision and LOQ and DT 50 values were established by following South African National Civic Organization and Environmental Protection Agency (EPA) guidelines (Alberto Navalo N et al., 2002; SANCO Guidelines, 2009) Hence, the proposed analytical procedure and dissipation information would be valuable for regulatory monitoring authority, residue labs and research scholars to determine the bispyribac-sodium residues in different commodities (crop, water and soil samples).
Acknowledgement
The authors are thankful to the Dr. B. Gowtham Prasad, SVV University, for providing necessary facility to conduct the Laboratory experiment.
REFERENCES
Alberto Navalo N., Avismelsi Prieto., Lilia Araujo., Jose Luis Vilchez. 2002. Determination of Pyrimethanil and kresoxim methyl in green groceries by head space solid-phase microextraction and gas chromatography- mass spectroscopy. Journal of Chromatography A, 975: 355-360.
Jyot, Gagan., Arora, Parshotam Kumar. 2010. Persistence of Trifloxystrobin and Tebuconazole on grape leaves, grape berries and soil. Bulletin of Environmental Contamination and Toxicology, 84(3): 305-310.
Karri, Apparao, Surendra Babu, MS., Basaveswara Rao, M.V., Tentu. Nageswara Rao. 2015. A new method for determination of tolfenpyrad residues in mango fruit. The Experiment, 32:2040-2047.
Nageswara Rao, T., Sreenivasulu, D., Patrudu, T.B. 2013. Simultaneous extraction and detection of six fungicide residues in mango fruit followed by new validated HPLC-UV method. Scholars Academic Journal of Biosciences, 1(3): 80-84.
Prem Dureja., Yogesh Kumar. 2011. Persistence of Azoxystrobin in/on Grapes and Soil in Different Grapes Growing Areas of India. Bulletin of Environmental Contamination and Toxicology, 86(1): 90-94.
SANCO Guidelines 2009. Method validation and quality control procedures for pesticide.
Shimin Wu., Jun Mei, 2011. Analysis of the Herbicide Bispyribac-sodium in Rice by Solid Phase Extraction and High Performance Liquid Chromatography. Bull Environ Contam Toxicol, 86:314–318.
Steven J. Lehotay. 2000. Analysis of pesticide residues in
mixed fruit and vegetable extracts by direct sample introduction/Gas Chromatography/Tandem Mass
Spectrometry. Journal of AOAC International, 83 (3): 5. Tamilselvan, C. S. John Joseph, V. Angayarkanni. 2014.
Determination of Bispyribac Sodium 10 % SC (Herbicide) Residue Level in Straw, Grain and Soil Using HPLC Method. International Letters of Natural Sciences, 17: 30-40.
Tentu Nageswara Rao., SNVS Murthy, S. Seshamma., D. Sreenivasulu. 2015. Independent Laboratory method validation and determination of spiromesifen residues in tomatos. International journal of Chem Tech Research, 8 (3): 1149-1155.