ISSN Print: 2164-5388
DOI: 10.4236/ojbiphy.2019.92007 Feb. 27, 2019 88 Open Journal of Biophysics
Determination of the Optical Properties of
Basal Cancer Using OCT System
Sohad Elwakeel
1*, Nafie Almuslet
1, Yahia Badr Aldeen
2, Khalid Haroun
31Institute of Laser, Sudan University of Science and Technology, Khartoum, Sudan 2National Institute of Laser Enhanced Science, Cairo University, Cairo, Egypt
3Facility of Radiobiological and Imagine Science, Alzaaim Alazahari University, Khartoum, Sudan
Abstract
The objective of this work is to determinate the optical properties of basal cancer cells using an optical coherence tomography (OCT). OCT system with He-Ne & diode laser was used to make interference pattern for the basal can-cer, then the output was displayed by optical detector, information of an elec-trical signal passed to the digital oscilloscope to give the object information after Fourier transform processing for that signal, then PC and CCD were used to display FFT signal. Finally many steps were done to determine the optical properties for the basal cancer. The intensity of the signals was plotted against scanning distance; the obtained graphs were used to determine the penetration depth and absorption coefficient.
Keywords
Optical Imaging, Resolution, FT, Cancer Cell, Optical Properties
1. Introduction
Skin cancer is the most common form of cancer [1]. Nonmelanoma skin can-cers, including basal cell carcinomas (BCCs) and squamous cell carcinomas (SCCs), are more common than all other types of human cancers [2].
Basal cell carcinoma (BCC) is the most prevalent skin cancer among cauca-sians [3] [4]. BCCs are derived from keratinocytes [5]. The incidence of BCC continues to increase worldwide [6]. It is a multifactorial disease in which exces-sive sun exposure plays a major pathogenic role [7] [8]. Treatment strategy has changed in the last two decades [9]. Nowadays, a broad variety of imaging tech-niques are becoming available. Optical imaging, also known as optical tomogra-phy, has become an active research field [10]. Several optical imaging techniques How to cite this paper: Elwakeel, S.,
Al-muslet, N., Aldeen, Y.B. and Haroun, K. (2019) Determination of the Optical Prop-erties of Basal Cancer Using OCT System. Open Journal of Biophysics, 9, 88-97.
https://doi.org/10.4236/ojbiphy.2019.92007
Received: December 30, 2018 Accepted: February 24, 2019 Published: February 27, 2019
Copyright © 2019 by author(s) and Scientific Research Publishing Inc. This work is licensed under the Creative Commons Attribution International License (CC BY 4.0).
DOI: 10.4236/ojbiphy.2019.92007 89 Open Journal of Biophysics being investigated include time resolved-optical imaging, frequency-domain optical imaging, optical coherence tomography, optoacoustic tomography and ultrasound-modulated optical (acousto-optical) tomography [11].
Optical coherence tomography is a relatively new noninvasive [12] [13] [14] optical imaging modality for biomedical diagnosis. It is based on low coherence reflectometry which was first developed for telecommunication devices of a high precision in the range of micrometers and lateral introduce to biomedical areas as a method to map the contour and monitor the thickness of retina [15]. The use of optical techniques for diagnostic purpose relies on the capability to meas-ure the optical properties of different tissues. In the fact, a degree of contrast must exist between absorption and scattering coefficients for effective detection of tissue alteration using optical imaging [16].
Recently, extensions of OCT technology, including Doppler flow and polari-zation sensitive image, have been developed that permit spatially resolved imag-ing of velocity or birefrimag-ingence [17].
In ordinary diagnostic, and to understand the origins of disease, material to be examined must be excised from the body and brought to the microscope.
While OCT has potential to go inside the tissue and give us the information from the reflected light, OCT performs imaging by measuring the echo time de-lay and intensity of backscattered light from internal microstructure in the tissue [18].
The advantages of OCT, as compared to other imaging methods such as CT, NMR and ultrasonic, are that there is no ionizing radiation involved, the method is non invasive, and it is high precision, and lack of need for mechanical contact between instrument and eye, high depth. Doppler imaging is capable of simul-taneous imaging and real-time flow measurements [19].
However, there is also a demand for gaining insight into functional parame-ters of tissue, such as the blood oxygen content. With OCT, we can diagnose small segments of tissue as opposed to most of other imaging modalities that can scan the whole organ; image can be acquired in vivo and in real time without loss of information for unknown sample structure [20]. In addition, it also prec-ludes the need for surgical biopsies and hence avoids discomfort and bleeding of biopsies [21].
Because the velocity of light is extremely high, the echo time delay cannot be measured directly. Instead, it is necessary to use correlation or interferometery techniques [22].
In an OCT system the spectrum of the source is very important as it deter-mines the maximum resolution of the image.
The general requirements of sources of OCT imaging are [23]: 1) Emission in near IR 2) Short coherence length 3) High irradiance
DOI: 10.4236/ojbiphy.2019.92007 90 Open Journal of Biophysics morphology, gastroterology, dentistry, and embryology have been demonstrated by several groups [25]. In this study, optical properties of basal cancer were de-termined by OCT system.
2. Materials and Methods
Laser source (diode 1550) nm, ≤4.25 mW, class III) constructed Michelson in-terferometer, detector, digital oscilloscope (150 MHz), computer, printer, CCD (LBA-100A) camera.
In this study different cancer cells samples were investigated.
First, laser light incident on the beam splitter, which reflects half of the inci-dent light to the reference mirror which was fixed, and the other half of the in-cident light was transmitted to the object (the basal cancer) through the concave lens. Figure 1 shows the block diagram of the constructed system.
Then the two beams were reflected or backscattered again to the beam splitter, and interference fringes were obtained after some adjustment done by screws on the fixed mirror. This step was done for all the samples and to scan the sample depth, a micrometer screw was used.
The performed pattern was received by the detector to convert it into voltage, which was displayed on the digital oscilloscope.
Automatic calibration was used to get high accuracy for measurement. Vertic-al position axis was used to adjust the signVertic-al position in the screen, and to dis-play all signals information “Math” button must be pushed, then advanced func-tions are displayed, and FT can be selected to allow acquired waveforms to be converted into frequency domain traces.
At the last, “Measure” button must be pressed and waveforms information are displayed.
The intensity of that signal was represented (plotted) against scanning dis-tance; the obtained graph was used to determine penetration depth and absorp-tion coefficient. From absorpabsorp-tion coefficient all other optical properties can be calculated.
3. Results and Discution
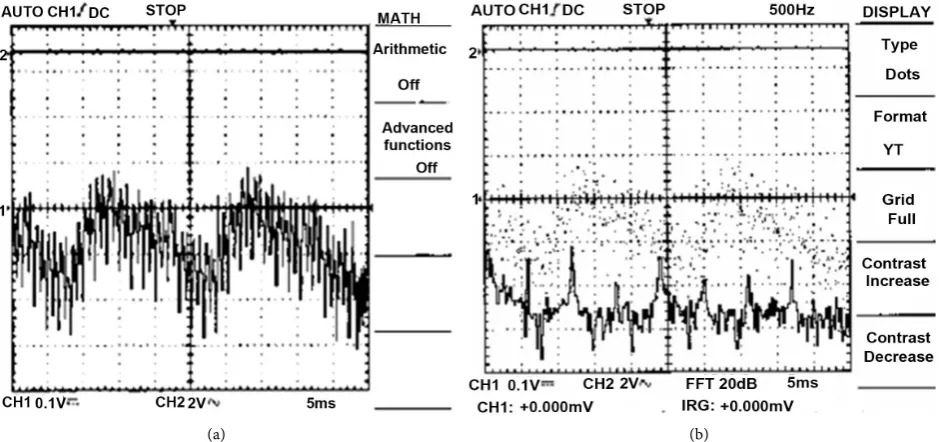
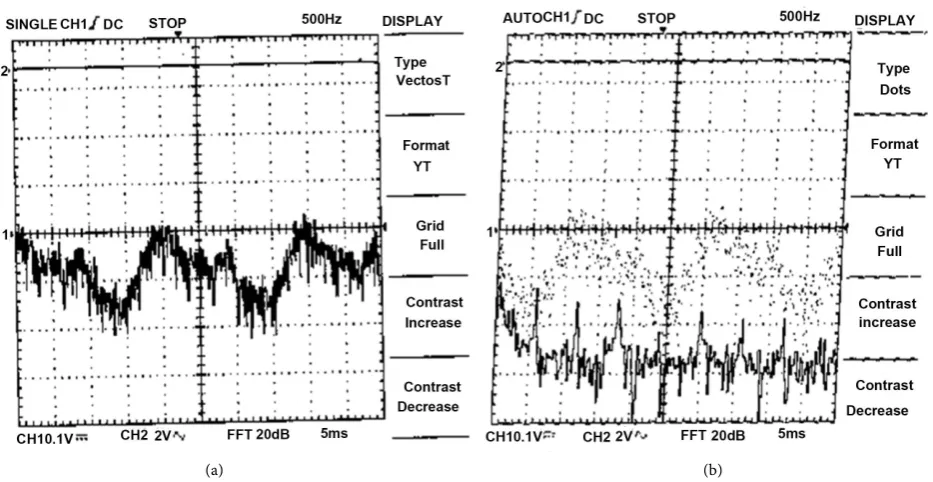
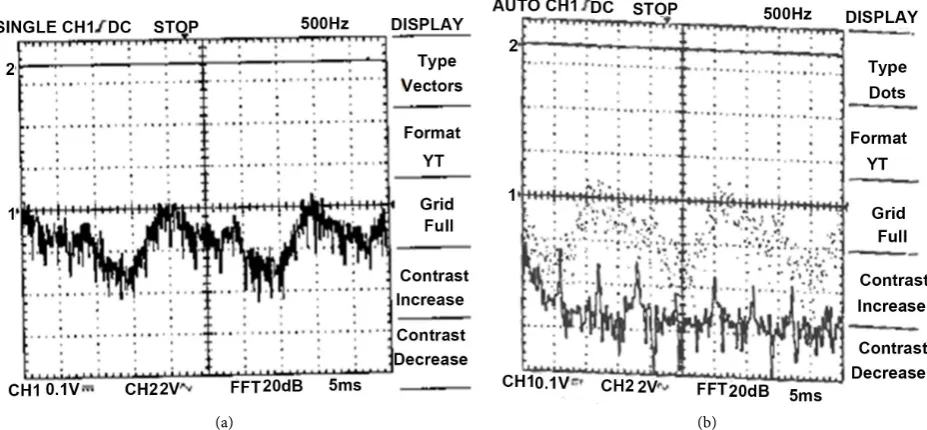
The experimental results, which related to the investigation of different cancer samples, were represented in tables, figures and images. Figures 2-5 show the signal recorded by digital oscilloscope.
Figure 2 shows the tissue signal, ones in the center of the figure represent signal before FT, while the lower ones after FT. Information’s after FT are: fre-quency 1.111 kHz, peak 240 mv, width 0.6 ms, period 0.9 ms and SNR (back-scattered power divided by the noise equivalent bandwidth of the detection) 20 dB.
DOI: 10.4236/ojbiphy.2019.92007 91 Open Journal of Biophysics
[image:4.595.248.502.73.194.2]Figure 1. Block diagram of the system.
Figure 2. The signal recorded by digital oscilloscope for first (BCC) tissue.
(a) (b)
Figure 3. The signal recorded by digital oscilloscope for second (BCC) tissue. (a) In normal ordinate; (b) In Fourier frequency.
[image:4.595.245.508.229.388.2] [image:4.595.68.538.426.647.2]DOI: 10.4236/ojbiphy.2019.92007 92 Open Journal of Biophysics (a) (b)
Figure 4. The signal recorded by digital oscilloscope for third (BCC) tissue. (a) In normal ordinate; (b) In Fourier frequency.
Figure 5 shows the tissue signal, (a) in normal ordinate before FT, while (b) after FT. Information’s displayed on digital oscilloscope for fourth (BCC) sample are frequency 833.3 Hz, peak 268 mv, width 0.6 ms, period 1.2 ms.
From the signals recorded by digital oscilloscope for studied samples we no-tice:
Third tissue has the highest peak, while the first one has the lowest one. Also third tissue has a short period (0.8 ms), which lead to high frequency (Table 1).
From the above results one can see that the optical coherence tomography system (OCTS) can be used to determine the depth resolution and the transverse resolution [26], in longitudinal direction with good performance for different tissues.
According to the above table, longitudinal resolution is higher than transverse resolution for all samples.
Third tissue has the biggest resolution (longitudinal resolution 0.5624 µm, transverse resolution 0.422 µm) and the minimum for fourth tissue.
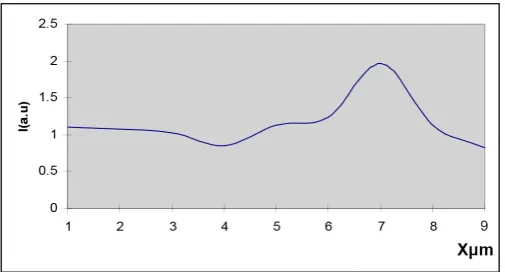
From the variation of the intensity with distance, in order to obtain a spectral tomography of the objects [27] [28].
Optical properties can be determined by fitting linear or logarithm function. Figures 6-9 show this variation, while Table 2 illustrates the optical properties for the samples.
There are considerable difference in the optical properties of various types of tissue and even more significant difference in the same tissue at different wavelength [10]. Figures illustrated the lowest backscattered signal for the fourth.
DOI: 10.4236/ojbiphy.2019.92007 93 Open Journal of Biophysics (a) (b)
[image:6.595.253.508.325.436.2]Figure 5. The signal recorded by digital oscilloscope for fourth (BCC) tissue. (a) In normal ordinate; (b) In Fourier frequency.
Figure 6. Intensity of the backscattered light as a function of the depth
for the First basal cancer.
Figure 7. Intensity of the backscattered light as a function of the depth
for the second basal cancer.
4. Conclusions
[image:6.595.249.509.483.631.2]DOI: 10.4236/ojbiphy.2019.92007 94 Open Journal of Biophysics
Figure 8. Intensity of the backscattered light as a function of the
[image:7.595.248.501.258.350.2]depth for the Third basal cancer.
Figure 9. Intensity of the backscattered light as a function of the
depth for the Forth basal cancer.
Table 1. List the samples results calculated from Figures 2-5.
ΔLB(μm) spatial resolution R R(μm) depth resolution
|Samples
0.2832 0.37967
Basal cancer
0.3329 0.4398
Basal cancer
0.422 0.5624
Basal cancer
0.259 0.368
Basal cancer
Table 2. Samples optical properties.
(a)
Object type Penetration depth (mm) coefficient (mmAbsorption −1) coefficient (mmAttenuation −1) coefficient (mmScattering −1)
Tissue (1) 0.062 12.375 16.129 3.754
Tissue (2) 0.031 30.800 32.258 1.458
Tissue (3) 0.0605 14.000 16.529 2.529
Tissue (4) 0.030 30.130 33.333 3.333
(b)
Object type Reduced scattering coefficient (mm−1) Reduced attenuation coefficient (mm−1) Reduced penetration depth (mm)
Tissue 1 7.504 19.883 0.050294
Tissue 2 2.916 33.716 0.02966
Tissue 3 5.058 19.058 0.05247
DOI: 10.4236/ojbiphy.2019.92007 95 Open Journal of Biophysics 2) (OCTS) technique can be used to get information of internal structure of the tissue, the contents of the tissue cells and its concentration.
3) The optical properties of different tissues can be determined using OCT.
5. Recommendations
Other types of optical tomography techniques can be used to estimate the most efficient one in determination of the optical properties of tissues.
Automatic scanning system can be used to perform good scanning for sam-ples, so that the thickness information of the tissues can be gained with good accuracy.
Acknowledgements
Deep thanks to Cancer Center and National Institute of Laser Enhanced Science, Cairo University, Egypt.
Conflicts of Interest
The authors declare no conflicts of interest regarding the publication of this paper.
References
[1] Alejandro, G.U., Jun, Z., Madeleine, D., Jeong H.C., Victor, G.P. and Lihong, V.W. (2012) In Vivo Diagnosis of Melanoma and Nonmelanoma Skin Cancer Using Ob-lique Incidence Diffuse Reflectance Spectrometry. American Association for Cancer Research.
[2] Elena, S., Brian, J., John, N. and Anna, N.Y. (2006) Optical Properties of Normal and Cancerous Human Skin in the Visible and Near-Infrared Spectral Range. Jour-nal of Biomedical Optics, 11, 064026. https://doi.org/10.1117/1.2398928
[3] Flohil, S.C., de Vries, E., Neumann, H.A., Coebergh, J.W. and Nijsten, T. (2011) In-cidence Prevalence and Future Trends of Primary Basal Cell Carcinoma in the Netherlands. Acta Dermato Venereologica, 91, 24-30.
https://doi.org/10.2340/00015555-1009
[4] Roewert, H.J., Lang, A.B., Stockfleth, E. and Kerl, H. (2007) Epidemiology and Aeti-ology of Basal Cell Carcinoma. British Journal of Dermatology, 157, 47-51.
https://doi.org/10.1111/j.1365-2133.2007.08273.x
[5] Takata, M. and Saida, T. (2005) Early Cancers of the Skin Clinical Histopathological and Molecular Characteristics. International Journal of Clinical Oncology, 10, 391-397.
https://link.springer.com/article/10.1007/s10147-005-0532-7
https://doi.org/10.1007/s10147-005-0532-7
[6] Marc, B., Mariano, S., Makiko, M., Alice, M., Gregor, J. and Veronique, D.M. (2016)
In Vivo Assessment of Optical Properties of Basal Cell Carcinoma and Differentia-tion of BCC Subtypes by High-DefiniDifferentia-tion Optical Coherence Tomography. Bio-medical Optics Express, 7, 2269-2284.
https://www.osapublishing.org/boe/abstract.cfm https://doi.org/10.1364/BOE.7.002269
DOI: 10.4236/ojbiphy.2019.92007 96 Open Journal of Biophysics
Study in Ireland. British Journal of Dermatology, 164, 822-829.
https://www.ncbi.nlm.nih.gov/pubmed/21291423 https://doi.org/10.1111/j.1365-2133.2011.10238.x
[8] Sellheyer, K. (2011) Basal Cell Carcinoma Cell of Origin, Cancer Stem Cell Hypo-thesis and Stem Cell Markers. British Journal of Dermatology, 164, 696-711.
https://www.ncbi.nlm.nih.gov/pubmed/21128907 https://doi.org/10.1111/j.1365-2133.2010.10158.x
[9] Trakatelli, M., Morton, C., Nagore, E., Ulrich, C., Delmarmol, V., Peris, K. and Bas-set, S.N. (2014) BCC Subcommittee of the Guidelines Committee of the European Dermatology Forum, Update of the European Guidelines for Basal Cell Carcinoma Management. European Journal of Dermatology, 24, 312-329.
https://doi.org/10.1684/ejd.2014.2271
[10] Cameron, H.G., Steven, F.B. and Ashely, J.W. (1999) Laser Tissue Interaction, U.S.A.
[11] Lihong, V.W. and Qimin, S. (1999) Sonoluminescence Tomography of Turbid Me-dia. SPIE, Vol. 359, San Jose, California. https://doi.org/10.1684/ejd.2014.2271 [12] Mehreen, A. and Jay, S.D. (2013) Optical Coherence Tomography: Current and
Fu-ture Applications. US National Library of Medicine National Institutes of Health.
Current Opinion in Ophthalmology, 24, 213-221.
https://doi.org/10.1097/ICU.0b013e32835f8bf8
[13] David, T. (2018) What Is Optical Coherence Tomography? American Academy of Ophthalmology.
https://www.aao.org/eye-health/treatments/what-is-optical-coherence-tomography
[14] Thomsen, J.B., Sander, B., Mogensen, M., Thrane, L., Jørgensen, T.M., Jemec, G.B.E. and Andersen, P.E. (2009) Optical Coherence Tomography Technique and Applications. Springer-Verlag Berlin Heidelberg.
https://doi.org/10.1007/978-3-540-68993-5_5
[15] Danielson, B.L. and Whittenberg, C.D. (1987) Guide Wave Reflectometry with Micrometer Resolution. Applied Optics, 26, 2836-2842.
https://www.osapublishing.org/abstract.cfm?uri=ao-26-14-2836
https://doi.org/10.1364/AO.26.002836
[16] Falco, M.D., Lepore, M. and Indovina, P.L. (2000) Difference in Optical Properties of Normal and Tumoral Tissues: A Comparison to Accuracy Limits in Laser Tech-niques for Optical Imaging. Proceedings of SPIE, 4160.
[17] Laubscher, M., Ducros, M., Karamata, B., Lasser, T. and Salathé, R. (2002) Vid-eo-Rate Three-Dimensional Optical Coherence Tomography. Optics Express, 10, 429-435. https://www.osapublishing.org/viewmedia.cfm?uri=oe-10-9-429
[18] Ko, T.H., Witkin, A.J., Fujimoto, J.G., Chan, A., Rogers, A.H., Baumal, C.R., Schu-man, J.S., Drexler, W., Reichel, E. and Duker, J.S. (2002) Ultrahigh-Resolution Opt-ical Coherence Tomography of SurgOpt-ically Closed Macular Holes. Archives of Oph-thalmology, 124, 827-836. https://doi.org/10.1001/archopht.124.6.827
https://www.ncbi.nlm.nih.gov/pmc/articles/PMC1937370/
[19] Hitzenberger, C.K., Kuihavy, M., Lexer, F., Baumgartner, A. and Fercher, A.F. (1998) In Vivo Intraocular Ranging by Wavelength Tuning Interferometery. Pro-ceedings of SPIE, 3251, 47-51.
[20] Choi, E., Kim, Y.-J., Kim, M.J., Lee, C. and Lee, B.H. (2003) OCT Resolution En-hancement Using Long Period Fiber Grating and Erbium-Doped Fiber. Proceedings of SPIE, 4956.
DOI: 10.4236/ojbiphy.2019.92007 97 Open Journal of Biophysics
Tomography System. Proceedings of SPIE, 4160.
[22] Takada, K., Yokohama, I., Chida, K. and Noda, J. (1987) New Measurement System for Fault Location in Optical Waveguide Devices Based on an Interferometric Technique. Applied Optics, 26, 1603-1606.
https://www.ncbi.nlm.nih.gov/pubmed/20454375
https://doi.org/10.1364/AO.26.001603
[23] Fercher, A.F. (1996) Optical Coherence Tomography. Journal of Biomedical Optics, 1, 157-173. https://doi.org/10.1117/12.231361
[24] Dean, P., Dickinson, M.R. and West, D.P. (2003) Optical Coherence Tomography Using a Photorefractive Polymer Composite. Proceedings of SPIE, 4956.
[25] Huang, D., Swanson, E.A., Lin, C.P., Schuman, J.S., Stinson, W.G., Chang, W., Heee, M.R., Flotte, T., Gregory, K., Pulifito, C.A. and Fujimoto, J.G. (1991) Optical Coherence Tomography. Science, 254, 1178-1181.
https://doi.org/10.1126/science.1957169
[26] Fujimoto, J.G. (2001) Optical Coherence Tomography. Applied Physics, 2, 1099-1111. [27] Leitgeba, R., Wojtkowskib, M., Hizenbergera, C.K., Ferchera, A.F., Stickera, M. and
Kowalezykb, A. (2000) Depth Resolved Spectroscopy by Frequency Domain Optical Coherence Tomography. Proceedings of SPIE, 4160, 57-61.
https://doi.org/10.1117/12.407608