Munich Personal RePEc Archive
Financial Harmonization and Financial
Development: An Application of
Europe’s Financial Services Action Plan
Ozkok, Zeynep
St. Francis Xavier University
23 May 2013
1
Financial Harmonization and Financial Development:
An A
pplication of Europe’s Financial Services Action Plan
Zeynep Ozkok
*(2013)
Abstract
The Financial Services Action Plan (FSAP) of the European Commission intends to create an open, secure, integrated financial market across EU member countries. Although recent research has shown a positive impact of the FSAP directives on cross-border lending and industrial growth, the effect on financial development remains to be examined. Using principal component analysis to construct financial, banking sector, bond and stock market development indices, we investigate the impact of financial harmonization policies of the FSAP on financial development in a panel of twenty five EU member states for the period of 1996 – 2007. Taking into account the timing perspective in implementing the FSAP directives across countries we find a positive link between financial harmonization and financial development. The results are shown to be robust to different approaches in constructing the harmonization index and the harmonization difference (relative timing of adoption) variable, and adding further controls and years to account for the recent period.
JEL Codes: F36; F63; G2; O11; O19; K4
Keywords: Financial integration; European Union; FSAP; Legal, regulatory harmonization; Financial development; Principal component analysis
*Corresponding author address: Department of Economics PO Box 5000, Antigonish, NS, B2G 2W5, Canada.
2
1.
Introduction
Financial development is a potential engine for growth. It is the channel through which countries experience increasing levels of efficiency in financial markets and the overall financial system. It
improves the quality of financial intermediaries, frameworks, and activities promoting both growth and welfare within countries. The argument regarding the role of financial development has grown even stronger in recent years. Countries with developed and integrated financial markets are more likely to experience enhanced growth rates. If economic growth is a chain of events, financial development together with legal and institutional development constitutes the first link of this process. Differences in banking sector, stock and bond markets across countries matter in terms of achieving higher growth rates. Financial harmonization thereby can be considered as an essential element in bringing together and accelerating further development of the financial markets.
The European Commission in hopes of harmonizing European countries has taken two important measures over the last two decades. The Euro, the first and well-known measure of integration, has not only grown to be a leading currency in the world’s financial markets, but has also greatly contributed to unifying European financial markets since its establishment back in 1999. Following the success of the Euro in creating a unified financial system, the European Commission has introduced the second, less well-known measure, the Financial Services Action Plan (FSAP). The FSAP aims to harmonize European financial markets through the imposition and adoption of regulatory and legislative frameworks. With
the strategic objectives of ensuring “a single EU market for wholesale financial services”, creating “open
and secure retail markets, and state-of-the-art prudential rules and supervision” and establishing “wider
conditions for an optimal single financial market”, the FSAP intends to harmonize and reduce the costs of cross-border financial intermediation and transactions. (Hartmann et al. 2003, 34; Kalemli-Ozcan et al. 2010 a).
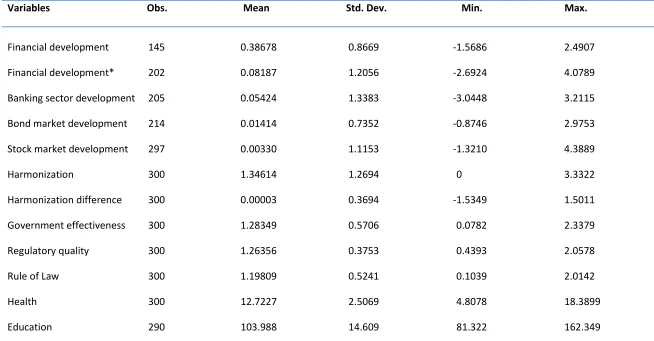
Both the European Union and the European Commission have argued that financial harmonization, by reducing the cost of cross-border financial business, should increase economic growth leading to development of financial markets (FSA 2003; London Economics 2002). Ozkok (2012) has shown that taking into account the relative timing of adoption of the FSAP measures, there is a positive link between financial harmonization and industrial growth. In this paper, we hope to answer how effective given the initial goal of the FSAP of creating an open, secure, integrated financial market, the directives of the FSAP been for financial development across countries. Using principal component analysis to construct financial, banking sector, bond and stock market development indices from most frequently used measures of financial development, we study the effects of financial harmonization policies of the FSAP on financial development in a panel of twenty five EU member states for the period of 1996 – 2007.
3 relative timing of adoption having a negative effect --- holds up. The results are robust to controlling for legal origins of countries, constructing new harmonization and relative timing of adoption measures, and including data for the most recent crisis period.
Our paper is related to different strands of the literature. First is the literature that has studied the effect of various types of integration on growth, volatility and development. Jayaratne and Strahan (1996, 1998) and Strahan (2002) study the impact of branching deregulation and interstate banking on growth. The results reveal that following state-level branching deregulation, real per-capita economic growth across the U.S. states increased significantly. Policy changes that allow for higher integration, better bank monitoring and screening across states are found to be a possible explanation. In a more recent study, De Avila (2003), examining the effects of financial deregulation in Europe, shows that the process of capital control lifting and the harmonization of banking laws have enhanced the growth rates of European economies. Harmonization is found to be beneficial for growth through the increase in the level and efficiency of financial intermediation, whereas the liberalization of capital controls increased growth through improvements in financial intermediation. Similarly in studying the effects of financial integration on financial development Chinn and Ito (2002) and (2006), Baltagi et al. (2007), Demetriades and Law (2006), Demetriades and Andrianova (2005) and Huang (2006) show that financial integration (capital account openness in most cases) contributes to financial development in equity and stock markets for both less developed and emerging market countries. More recently, Ozkok (2010) demonstrates that using index measures for financial openness and financial development in a panel study of developed and emerging market countries one can explain a large part of the variation in financial development across countries and over time. Principal component type indices provide better results in understanding the link between financial openness and financial development.
Second, a limited number of studies examine the role of the FSAP measures. Kalemli – Ozcan et al. (2010 a) analyze the link between financial integration and business cycle synchronization. The authors’ analysis, using bilateral panel instrumental variables to link legislative harmonization policies to output synchronization, depicts a negative relationship for the country-pairs selected in the sample. In an attempt
to examine the Euro’s effect on financial integration Kalemli – Ozcan et al. (2010 b) reveal the legislative-regulatory harmonization policies in financial markets established under the FSAP to be a contributing factor for cross-border lending, despite these policies’ inability to explain the Euro’s impact on financial integration. Ozkok (2012) conveys that there is a positive relationship between financial harmonization induced by the FSAP directives and industrial growth rates across countries controlling for the relative timing of adoption of these directives.
4 The rest of the paper is structured as follows. In the next section we explain in detail our data. Section 3 provides a discussion of the empirical model. Section 4 depicts our results and some robustness checks. Section 5 concludes.
2.
Data
The analysis is based on annual data for 25 European countries over a 12 year period of 1996 – 2007.1The data are obtained primarily from Beck, Demirguc-Kunt, and Levine’s database on Financial Development and Structure (referred as BDL from onwards), the World Bank’s World Development Indicators (WDI), Worldwide Governance Indicators, and Edstats which extracts data from the UNESCO Institute for Statistics.
2.1 Financial Harmonization
The financial harmonization measure of our analysis is based on the directives of the Financial Services Action Plan. The Financial Services Action Plan (FSAP) was launched by the European Union and the European Commission at the end of 1998 as a major 5-year program with the goals of establishing “a single EU wholesale market for financial services, open and secure retail markets, and state-of-the-art prudential and supervisory regulations.” (Kalemli – Ozcan et al. 2010 b, 79).
The European Commission through the establishment of the FSAP aimed to remove barriers to entry into the financial sector, increasing competition, and harmonizing information (Malcolm et al. 2009). However, like any legislative measure, the costs and benefits of the FSAP directives have become a topic of debate over the recent years. Boyfield et al. (2006) state that the benefits involve increasing investment opportunities in securities markets across borders, easing the framework for investment firms, augmenting internalization and stimulating competition between banks. This thereby induces a reduction in the cost of trading and the cost of capital, increases investor confidence, market liquidity, and free flow of capital, allows for more transparency, and greater competition. The costs on the other hand entail compliance costs due to complexity, possibility of creating barriers to entry for smaller firms, further costs that involve execution of the directives, and costs of implementation of these directives across countries. The goal of the European Commission through the FSAP is to form a unified financial market that can act as an essential element for growth, employment and improved competition in the overall European system (European Commission 2005). Financial Services Action Plan (FSAP) thereby should influence growth, and cross border lending across countries as shown in studies by Kalemli – Ozcan et al. (2010 b) and Ozkok (2012). Since the FSAP has been influential on financial activities across countries, it should have a positive impact on the banking sector, bond and stock market and overall level of financial development. The aim of this study thereby is to explore whether this is indeed the case.
1The data are obtained primarily from Beck, Demirguc-Kunt, and Levine’s database on Financial Development and
Structure (referred as BDLfrom onwards), the World Bank’s World Development Indicators (WDI), Worldwide
5 The FSAP consists of 29 legislative acts, 27 directives and 2 regulations in corporate law, banking, payment systems and corporate governance (Kalemli – Ozcan et al. 2010 a). The most important of these measures are the 27 directives, which will be the focus of the remainder of our analysis. The directives amend previous laws, replace out-of-date proposals or offer new legislative measures for the EU member countries. Since the establishment of the FSAP in 1998, the European Commission has passed 21 out of the 27 directives by the end of 2003, with the remaining 6 directives being passed into legislation during the period of 2004 – 2006 (Kalemli – Ozcan et al. 2010 a).
Unlike the EU regulations that are enforceable across countries immediately after their announcement, the FSAP directives are enforceable only after the member states pass legislations that adopt the EU law domestically (Kalemli – Ozcan et al. 2010 a). The implementation stage of the FSAP directives involves the
EU Commission’s proposal on legislative directives and regulations, which then will have to be adopted by
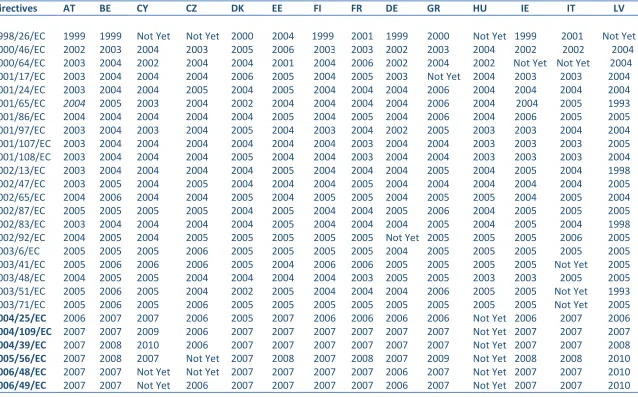
“co-decision” of the Council of Ministers of the Member States and the European Parliament (HM Treasury, The Financial Services Authority, and the Bank of England, 2003). The FSAP directives are incorporated into the national law of each EU member state either through introduction or through amendment of national laws within a time frame of 18 to 24 months of their date of original publication. The implementation process of the FSAP directives works through three stages; transposition of the EU legislation into national law, adjustment for necessary arrangements and ensuring that the newly adopted regulations are working effectively and efficiently. Due to differences across countries in modifying their existing internal institutional structures and frameworks to adopt the EU law (and due to the discretion in when to adopt these directives), the transposition of the FSAP directives may take several years, creating variation in terms of the dates of implementation of these directives in different countries.2 For example, the 1998 Settlement Finality Directive (1998/26/EC) of the FSAP under the securities category was implemented into domestic law in Austria, Belgium, Finland, Germany, Ireland, the Netherlands, Spain and the U.K. within a year of its circulation. However, France, Italy and Luxembourg did not adopt this directive until 2001, while Cyprus, Czech Republic, Hungary, Latvia, Lithuania and Poland had not transposed the directive till the end of our sample period (Kalemli – Ozcan et al. 2010 a, b).3 It is this cross-country variation in the timing of the adoption of different directives which will allow us to identify their effect on growth.
The harmonization indices for EU countries are created using adoption dates of directives in different
countries from the European Commission’s Financial Services Action Plan. Following the methodology by Kalemli – Ozcan et al. (2010 b), we construct country and time-variant and industry-invariant indices of harmonization that summarize the information provided by the 27 FSAP directives. In particular, for each of the 27 directives listed under the FSAP we define a dummy variable that takes on a value of one on and after the date that the country under examination has transposed the directive into national law and a
2 As explained in Ozkok (2012) the European Commission imposes sanctions on member states that do not comply
with the rules and regulations set forward by the Commission. The Member States are therefore obliged to pay penalties for the days of non-compliance. For more information please refer to the European Commission’s Application of the EU Law website, http://ec.europa.eu/eu_law/infringements/infringements_260_en.htm
3 Please refer to Table 3 in the Appendix for further explanation of the directives in the Financial Services Action
6 value of zero otherwise. The sum of all 27 directives forms our next variable, lexi,t (Kalemli – Ozcan et al.
2010 a, b):
𝑙𝑒𝑥𝑖,𝑡 = ∑27𝑘=1𝐷𝑖𝑟𝑒𝑐𝑡𝑖𝑣𝑒𝑠𝑖,𝑡𝑘 (1)
where k represents all 27 directive dummies, i represents the countries, and t represents the years in the sample. Following Kalemli – Ozcan et al. (2010 b), we use the logarithmic transformation of the sum of the directives for countries in constructing the harmonization index given below.
𝐻𝑎𝑟𝑚𝑜𝑛𝑖𝑧𝑎𝑡𝑖𝑜𝑛𝑖,𝑡= ln(1 + 𝑙𝑒𝑥𝑖,𝑡) (2)
Table 1 in the Appendix provides a time-line of adoption of the 27 directives for all countries in our sample, while Table 2 and 3 present detailed descriptions and categories for these directives.
The harmonization index described above takes into account the time varying sum of the directives across countries. We do not believe that this causes a potential problem or bias as countries are provided with a time frame in which they have to implement each directive into their national law. Nevertheless, it is also important and interesting to examine the fraction of the directives transposed each year given the possible number of directives that can possibly have been implemented in that year. We thereby construct another harmonization index that takes into account the fraction of directives implemented per year across countries relative to the possible sum of directives available for that year.4 The fractional harmonization index can then be constructed as a possible robustness check as follows:
𝐻𝑎𝑟𝑚𝑜𝑛𝑖𝑧𝑎𝑡𝑖𝑜𝑛𝑖,𝑡(𝑓𝑟𝑎𝑐𝑡𝑖𝑜𝑛) =∑ 𝐷𝑖𝑟𝑒𝑐𝑡𝑖𝑣𝑒𝑠𝑝𝑜𝑠𝑠𝑖𝑏𝑙𝑒𝑡 𝑙𝑒𝑥𝑖,𝑡 𝑖,𝑡 (3)
where 𝐷𝑖𝑟𝑒𝑐𝑡𝑖𝑣𝑒𝑠𝑝𝑜𝑠𝑠𝑖𝑏𝑙𝑒𝑖,𝑡 represents the number of directives that can be implemented at each possible year and 𝑙𝑒𝑥𝑖,𝑡 is the sum of directives implemented across time per country.5
2.2 Relative timing (speed) of adoption
The relative timing of adoption is an important determinant of the effect of the FSAP directives. As shown in Ozkok (2012) there exist significant differences across EU member countries in the timing of adoption of the FSAP directives and not controlling for this timing would introduce a bias. As expressed previously, the FSAP directives need to be transposed into national law before they become effective. Although this implementation process has to be completed within a specified period of time some countries implement directives earlier in comparison to others.6 The delays in implementation are taken at the country-level and cannot directly affect decision making for other member countries. These differences in timing of
4 We would like to thank Irma Clots-Figueras for pointing out this possibility.
5 We have also experimented using the logarithmic transformation in the numerator of the fractional
harmonization index. The results are similar to those reported in Table 6 in the Appendix.
6 As expressed in Kalemli-Ozcan et al. (2010 b) countries may choose to postpone implementation of certain
7 adoption, however, are highly influential on the overall level of harmonization across countries. For example, if Czech Republic adopts a directive, and no other country adopts the same directive, then we cannot talk about harmonization. In that case Czech Republic would simply bear the cost of adopting the directive, without attaining any benefits from it. With this in mind, we consider whether there is a disadvantage from adopting these directives earlier. In order to check for this possibility, we construct a new variable which we call the harmonization difference:
𝐻𝑎𝑟𝑚𝑜𝑛𝑖𝑧𝑎𝑡𝑖𝑜𝑛𝑑𝑖𝑓𝑖,𝑡 = 𝐻𝑎𝑟𝑚𝑜𝑛𝑖𝑧𝑎𝑡𝑖𝑜𝑛𝑖,𝑡− 𝐻𝑎𝑟𝑚𝑜𝑛𝑖𝑧𝑎𝑡𝑖𝑜𝑛𝑎𝑣𝑒𝑡
where 𝐻𝑎𝑟𝑚𝑜𝑛𝑖𝑧𝑎𝑡𝑖𝑜𝑛𝑖,𝑡 is the harmonization index of country i in year t, and 𝐻𝑎𝑟𝑚𝑜𝑛𝑖𝑧𝑎𝑡𝑖𝑜𝑛𝑎𝑣𝑒𝑡 is the average index of harmonization across countries in year t. The harmonization difference is a measure that depicts how many FSAP directives are adopted by each country relative to the average rate of adoption for all countries per year. Using this variable we can analyze the impact of being an early versus a late adopter on industrial growth.
2.3 Financial Development Indicators
Financial development indicators consist of banking system, stock market and bond market measures. Below we discuss each group of measures and the construction of indices in detail.
Banking sector development indicators:
Five indicators are used to measure the development of the banking sector. These variables are liquid liabilities (% of GDP), private credit by deposit money banks and other financial institutions (% of GDP), the ratio of deposit money bank assets to the sum of deposit money bank assets and central bank assets (in percentages), total bank assets (% of GDP), and domestic credit provided by the banking sector (% of GDP). The annual data is obtained from the Financial Development and Structure Database by BDL and
the World Bank’s WDI.
Liquid liabilities (% of GDP) equals the ratio of liquid liabilities of bank and nonbank financial
intermediaries to GDP (Demirguc-Kunt and Levine 2001). This variable is commonly used as a measure of financial sector development and is a typical measure of financial depth.
Private credit by deposit money banks and other institutions (% of GDP) is an indicator for the overall development in private banking markets (Chinn and Ito 2006). This variable includes financial resources provided to the private sector by deposit money banks and other financial institutions. It measures the level of credit available for the private sector.
The ratio of deposit money bank assets to the sum of deposit money bank assets and central bank assets (in percentages) is used to demonstrate the weight of deposit money bank assets among total assets. It reflects the importance of private lending compared to total lending (Huang 2006).
8 Domestic credit provided by the banking sector (% of GDP) includes credit extended to the private sector and general government, to the nonfinancial public sector in the form of investments in short- and long-term government securities, to banking and nonbank institutions and loans to state enterprises but excludes credit to the central government (World Bank 2012). It is a measure of banking sector depth and financial sector development in terms of size (World Bank 2012).
Stock market development indicators:
Three different variables are used to measure development in stock markets. These variables are stock market capitalization (% of GDP), stock market turnover ratio (in percentages), and stock market total value traded (% of GDP). Annual data is obtained from the Financial Development and Structure Database of BDL.
Stock market capitalization (% of GDP) is equal to the value of listed shares divided by GDP. It is an indicator of the size of the stock market. Stock market turnover ratio (in percentages) is used as the efficiency indicator of stock markets (Demirguc-Kunt and Levine 2001). It is classified as the ratio of the value of total shares traded to stock market capitalization. Stock market total value traded (% of GDP) is equal to the total shares traded on the stock market exchange divided by GDP. This indicator measures the activity or liquidity of the stock markets (Demirguc-Kunt and Levine 2001).
Bond market development indicators:
Private bond market capitalization (% of GDP) and public bond market capitalization (% of GDP) are the two indicators used to measure bond market development. Data is reported annually from the Financial Development and Structure database of BDL.
Private bond market capitalization (% of GDP) is equal to the total amount of outstanding domestic debt securities issued by financial institutions and corporations as a share of GDP. Public bond market capitalization (% of GDP) is equal to the total amount of public domestic securities issued by
governments as a share of GDP. Both of these indicators are used to determine the efficiency of bond markets.
The financial development literature does not use bond market development indicators as potential measures for financial development. Due to their short period of availability bond market indicators may reduce the number of estimations or may create problems in estimations due to their large variability. For these reasons, we also construct financial development indices that exclude the bond market development indicators.
2.4 Creating financial development indices
9 with particular choice of measures. By aggregating different measures of financial development into a single index we summarize the comprehensive nature of the financial markets and bring together different sectors that affect financial development.
The use of principal components and factors models in creating indices have become more common among the researchers particularly in examining the link between financial openness and financial development and growth. Principal components analysis in its simplest form involves a mathematical procedure that helps transform a number of possibly correlated variables into a smaller number of uncorrelated ones. Principal components has two main objectives; reducing the dimensionality of the data set, and identifying new meaningful variables.7Here we use the methodology of Bo and Woo (2008) and apply it to our context following Ozkok (2010). This index calculates weights taking into account the information from all components. According to this methodology the weights for each measure of the index are constructed as follows:
𝑤𝑗 =∑ 𝜆𝑖𝛼𝑗 𝑖 𝑖=𝑝 𝑖=1
∑𝑖=𝑝𝑖=1𝜆𝑖
where 𝜆𝑖(i =1,…,p) is the ith eigenvalue and αi
px1 (i = 1, …, p) is the ith eigenvector of the correlation
matrix Rpxp respectively (Bo and Woo, 2008). The technique used by Bo and Woo (2008) is similar to that
proposed by the United Nations Conference on Trade and Development (UNCTAD) for constructing the Trade and Development Index. Bo and Woo (2008/2010), Nagar and Basu (2002) and Klein and Ozmucur (2002/2003) provide different approaches in creating indices analogous to the Trade and Development Index (TDI) with minor alterations.
The index is then constructed taking into account the relative importance of all indicators:
𝐼𝑛𝑑𝑒𝑥 =∑ ∑ 𝜆𝑖𝛼𝑗
𝑖𝑥 𝑗 𝑖=𝑝 𝑗=1 𝑖=𝑝 𝑖=1
∑𝑖=𝑝𝑖=1𝜆𝑖
= ∑ 𝑤𝑗 𝑗=𝑝
𝑗=1
𝑥𝑗
where 𝑥𝑗(j = 1, …, p) is the jth column of the matrix X and 𝑤
𝑗 is the final weight of the indicator j. All variables that constitute the jth column of the matrix X, x
j, are standardized. The sum of the weights
expressed by the above formula above does not necessarily have to equal unity. This is due to the fact that the principal component analysis in its underlining structure normalizes the mode of each
eigenvector to unity. The weights therefore could be very close to but not always equal to 1 (Bo and Woo 2008).
7 For a more in depth discussion of the principal component analysis please refer to Jackson (1991), Dunteman
10 Following this methodology we construct indices with standardized individual measures for financial openness, banking sector, stock and bond market development, financial development.8 This avoids any potential problem that could arise as a result of using different scales or units of measurement.
2.5 Control Variables
To further examine the relationship between financial harmonization and financial development we introduce a series of variables to control for legal and institutional differences, health care and education. Control variables described in detail below are country and time-variant for the period of 1996 – 2007. The data for the control variables are from the World Bank’s WDI and the Worldwide Governance Indicators, and Edstats.
We employ a series of legal and institutional variables from the World Bank’s Worldwide Governance Indicators dataset. We use three different measures to control for institutional, legal, political and economic factors that may affect the overall level of growth. The three indicators --- government effectiveness, regulatory quality, and rule of law --- are constructed using subjective and perceptions-based data that reflect views of a range of respondents, agencies and organizations. They are measured in a range from -2.5 to 2.5, where higher values correspond to better governance outcomes.9
Secondary school gross enrolment rate (% of population) is used as an indicator that controls for differences in educational attainment across countries. This measure is an important determinant of development. Following the examples of educational attainment indicators from the economic growth literature we use secondary school gross enrollment rate as a control for educational differences across countries.
Public health expenditure (% of government expenditure) is an indicator used for controlling funds provided for the health sector across countries. It consists of recurrent and capital spending from government (central and local) budgets, external borrowings and grants and social (or compulsory) health insurance funds (World Bank 2012).10
Control variables help in further explaining the effect of financial harmonization on financial development as well as banking sector, bond and stock market development. Countries may demonstrate higher levels of financial development relative to others as a result of differences in education, institutions and legal systems, and health systems. The ease in adopting FSAP directives into national law can be induced by the quality of regulatory and legislative institutions. Education could be a factor in establishing human capital which would facilitate faster and simpler implementation of legislative policies. Health expenditure could
8 This method makes use of all eigenvectors and proposes to use weights depending on the eigenvectors and
eigenvalues
.
9Please refer to the Worldwide Governance Indicators (WGI) dataset. 1996 – 2011. World Bank.
http://info.worldbank.org/governance/wgi/index.aspx#home. The institutional quality variables used in our
analysis do not fluctuate widely across time. Due to the relatively small fluctuation structure of these indicators, we take the averages of two consecutive years to replace the missing years’ data for these three legal and institutional variables.
10 The grants also include donations from international agencies and nongovernmental organizations. For further
11 be taken as an indicator of better functioning of countries. There may be different reasons behind financial development however given that we have a sample set of European economies which all have higher levels of economic development and growth in comparison to other world economies we try to capture and control for the main elements that we believe would have a potential influence in our analysis.11
3.
Empirical Model
We measure the effect of financial harmonization on financial development through an empirical model using fixed effects estimation. We follow the literature (Jayaratne and Strahan (1996), (1998), Strahan (2002), Morgan et al. (2004), and Kalemli – Ozcan et al. (2010 a, b)) and use a model which controls for average differences across countries and time in harmonization policies. We estimate the below benchmark empirical model in our estimations:
𝐹𝐷𝑖,𝑡 = 𝜆𝑖+ 𝜃𝑡+ 𝛽1𝐻𝑎𝑟𝑚𝑜𝑛𝑖𝑧𝑎𝑡𝑖𝑜𝑛𝑖,𝑡+ 𝛽2𝐻𝑎𝑟𝑚𝑜𝑛𝑖𝑧𝑎𝑡𝑖𝑜𝑛𝑑𝑖𝑓𝑖,𝑡+ ∑ 𝜏𝑝𝐶𝑜𝑛𝑡𝑟𝑜𝑙𝑠𝑖,𝑡𝑝 5
𝑝=1
+ 𝑣𝑖,𝑡
where the dependent variable in the above equation is the index of financial development12, 𝜆
𝑖 represents country fixed effects, 𝜃𝑡represents time fixed effects, 𝐻𝑎𝑟𝑚𝑜𝑛𝑖𝑧𝑎𝑡𝑖𝑜𝑛𝑖,𝑡 is the index measure created using the FSAP directives, 𝐻𝑎𝑟𝑚𝑜𝑛𝑖𝑧𝑎𝑡𝑖𝑜𝑛𝑑𝑖𝑓𝑖,𝑡 is the relative timing of adoption of the FSAP directives measuring the difference between how much a country implements these directives in response to the average rate of adoption, and 𝐶𝑜𝑛𝑡𝑟𝑜𝑙𝑠𝑖,𝑡 are the three legal and institutional quality variables of government effectiveness, regulatory quality and rule of law, secondary school enrollment rate, and the health expenditure.
In the above equation our main focus is on the coefficient of the harmonization index. We would expect to find a positive and significant coefficient for harmonization which would imply a positive link between financial harmonization and financial development. We convey our main findings for both the empirical model and robustness checks in detail in the next section.
11 We also checked for the robustness of our results including an income variable to account for differences across
our European countries. The inclusion of the logarithm of GDP per capita depicted insignificant coefficients and did not alter the magnitudes or the significances of our other explanatory variables. Similarly including a trade
openness variable to account for the trade across European countries did not add to our regressions. We find its coefficient to be insignificant with no alterations on the signs and significances of other explanatory variables. These results are available upon request.
12 We also use indices of banking sector, bond and stock market developments as dependent variables to analyze
12
4.
Results
4.1 Benchmark Model
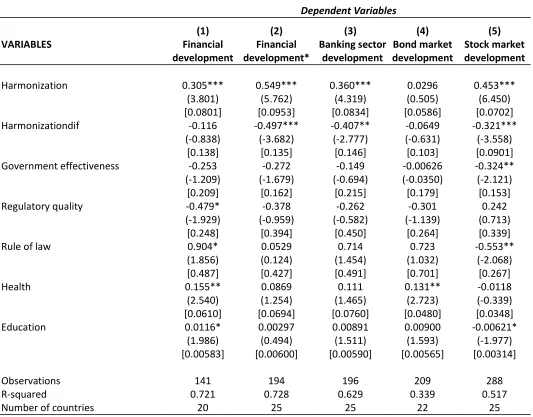
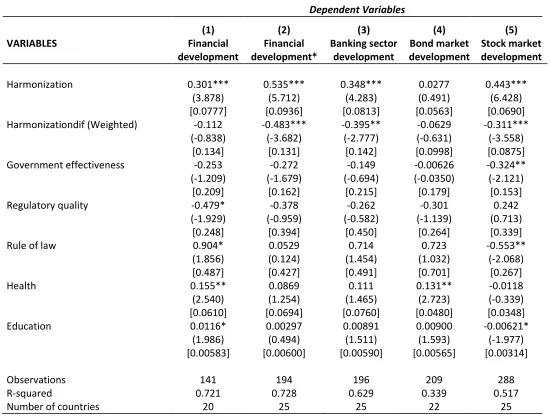
We report our results using 25 EU member countries for the period of 1996 – 2007. In our regressions we use fixed effects estimations with country and time specific effects. The results from Table 5 illustrate the link between the harmonization index and financial development. Previous discussions had conveyed that through the Financial Services Action Plan, European economies would achieve an increase in the real GDP by 1.1% over a decade (FSA 2003; London Economics 2002). Although there is no clear explanation regarding how the FSAP would influence the level of financial development across countries, given its initial goal of creating a unified and integrated European financial market we would anticipate that it would be one of the primary determinants of an increase in financial development both across countries and over time. The results from Table 5 show that this is indeed the case. Controlling for the relative timing of adoption, the financial harmonization index is found to be positive and significant for all dependent variables of development with the exception of the bond market development index. Harmonization difference, or the relative timing of adoption, on the other hand takes on a negative effect implying that being an early adopter does not have a clear benefit in terms of financial development. The relative timing of adoption is shown to have a significantly disadvantageous effect on banking sector, stock market and financial development that excludes the bond market. The goal of unification of financial markets by the FSAP directives can only be mutually beneficial for countries when they all implement these directives.13 Legal and institutional variables take on altering coefficients that are mostly insignificant. Health and education variables are generally positive and partly significant. This shows that health and educational attainment are contributing factors for financial development. In order to examine whether the inclusion of other control variables affect our results particularly for the banking sector we include further controls to our benchmark model. The results are reported below.
4.2 Robustness checks
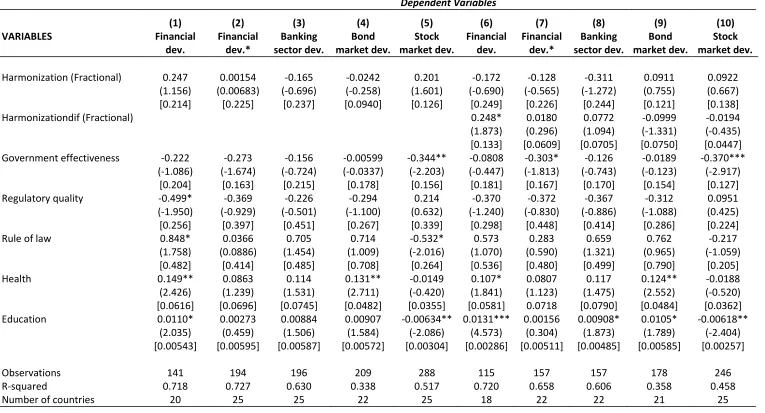
As a first robustness check we examine our results with the harmonization index that takes into account the fraction of directives implemented. Constructing a harmonization index that depends on the fraction of the directives implemented we can observe whether countries adopt the FSAP directives in a timely manner. This index differs from our original measure by taking into account that not every year are newer FSAP directives proposed by the European Commission. As shown in equation (3), we expect this index to convey information regarding the adoption process of the directives rather than the quantity of directives implemented per year. Our results from Table 6 (columns 1 to 5) report no significant relationship between the fractional harmonization index and the banking sector, bond and stock market and overall financial development indices. In order to examine whether the inclusion of a harmonization difference variable using the fractional argument would alter our findings, we construct the relative timing of adoption measure taking into account the fractions of directives as follows:
13 With the inclusion of the harmonization difference measure, the harmonization index acts like an average
13
𝐻𝑎𝑟𝑚𝑜𝑛𝑑𝑖𝑓(𝑓𝑟𝑎)𝑖,𝑡=∑ 𝐷𝑖𝑟𝑒𝑐𝑡𝑖𝑣𝑒𝑠𝑝𝑜𝑠𝑠𝑖𝑏𝑙𝑒(𝑙𝑒𝑥𝑖,𝑡− 𝑙𝑒𝑥(𝑎𝑣𝑒)𝑖,𝑡) 𝑖,𝑡 𝑡
where 𝐷𝑖𝑟𝑒𝑐𝑡𝑖𝑣𝑒𝑠𝑝𝑜𝑠𝑠𝑖𝑏𝑙𝑒𝑖,𝑡 represents the number of directives that can be implemented at each possible year, 𝑙𝑒𝑥𝑖,𝑡 is the sum of directives implemented across time per country and 𝑙𝑒𝑥(𝑎𝑣𝑒)𝑖,𝑡 is the mean of the country and time variant sum of directives.
The findings from columns (5) to (10) of Table 6 are mostly insignificant. The fractional harmonization index is insignificant for all dependent variables, whereas the harmonization difference measure is found to be positively significant for the financial development index that excludes the bond market. Nevertheless the fractional harmonization index should not be regarded as a substitute of the original harmonization index. The results portray that the effect of harmonization most probably does not work through a fractional argument. By using the fraction of directives implemented in the harmonization index we cannot find the positive and significant link that we examine when using the original logarithmic harmonization index.
Another potential concern may stem from the construction of the relative timing of adoption of the FSAP directives across countries. The 25 countries, although being a part of the most powerful economic and political union in the world, differ from each other in terms of growth rates. Taking into account the differences across economies of the 25 EU countries we can construct a variable for relative timing of adoption such that it depends on the overall structure of the economy across countries. The relative timing of adoption measure created depends on the GDP levels. The weights for this variable are calculated as follows:
𝑤𝑒𝑖𝑔ℎ𝑡𝑖,𝑡 =∑ 𝐺𝐷𝑃𝐺𝐷𝑃𝑖 𝑖,𝑡𝑖,𝑡 (4)
where 𝐺𝐷𝑃𝑖,𝑡 is the gross domestic product of country i given in constant 2000 USD from the World
Bank’s World Development Indicators. Similarly the relative timing of adoption measure, or in other words, the harmonization difference can be constructed as:
𝐻𝑎𝑟𝑚𝑜𝑛𝑖𝑧𝑎𝑡𝑖𝑜𝑛𝑑𝑖𝑓𝑖,𝑡 = 𝐻𝑎𝑟𝑚𝑜𝑛𝑖𝑧𝑎𝑡𝑖𝑜𝑛𝑖,𝑡− (∑ 𝑤𝑒𝑖𝑔ℎ𝑡𝑖 𝑖,𝑡× 𝐻𝑎𝑟𝑚𝑜𝑛𝑖𝑧𝑎𝑡𝑖𝑜𝑛𝑖,𝑡) (5)
where 𝐻𝑎𝑟𝑚𝑜𝑛𝑖𝑧𝑎𝑡𝑖𝑜𝑛𝑖,𝑡 is the harmonization index of the FSAP directives that is country and time variant. Using the above methodology each country takes on a weight that depends on the performance of their economy relative to the overall performance of the EU 25.
14 As a third robustness check we reexamine the results by constructing two different harmonization indices. These two indices include the initial twenty-one directives that were put into force by the European Commission before the official completion of the FSAP directives in 2006, and the seven directives that correspond to the banking initiatives of the FSAP (Kalemli – Ozcan et al. 2010 b). By doing so we hope to determine whether the effect of the harmonization process on financial development alters when we consider the initial 21 directives that were put into force long before the end of the FSAP and identify a possible significant link between the banking directives and financial development. The first alternative harmonization index includes twenty one directives excludes the directives implemented prior to 2004. It is constructed as:
𝑙𝑒𝑥𝑟𝑜𝑖,𝑡= ∑21𝑘=1𝐷𝑖𝑟𝑒𝑐𝑡𝑖𝑣𝑒𝑠𝑖,𝑡𝑘 and 𝐻𝑎𝑟𝑚𝑜𝑛𝑖𝑧𝑎𝑡𝑖𝑜𝑛𝑖,𝑡∗ = ln(1 + 𝑙𝑒𝑥𝑟𝑜𝑖,𝑡) (6)
The second alternative to the harmonization index highlights the importance of the 7 banking directives of the FSAP. The banking harmonization index is then formed as:
𝑏𝑎𝑛𝑘𝑙𝑒𝑥𝑖,𝑡 = ∑7𝑘=1𝐷𝑖𝑟𝑒𝑐𝑡𝑖𝑣𝑒𝑠𝑖,𝑡𝑘 and 𝐻𝑎𝑟𝑚𝑜𝑛𝑖𝑧𝑎𝑡𝑖𝑜𝑛𝑖,𝑡∗∗= ln(1 + 𝑏𝑎𝑛𝑘𝑙𝑒𝑥𝑖,𝑡) (7)
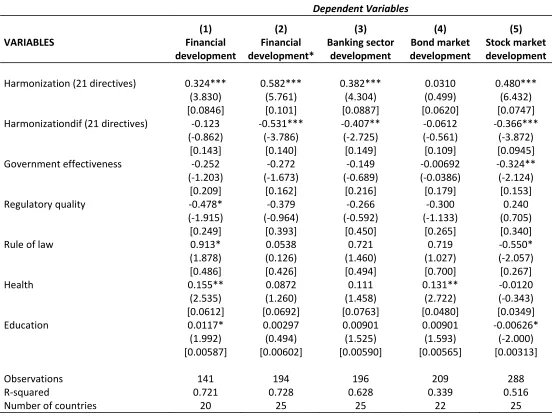
The results from Tables 8 and 9 show that harmonization indices with initial 21 directives, and 7 banking directives have a positive effect on most financial development indices. Harmonization difference has a negative impact implying that being an early adopter is not beneficial for development. This shows that the construction of the harmonization index is crucial, however, excluding some directives does not change the robustness of our benchmark model.
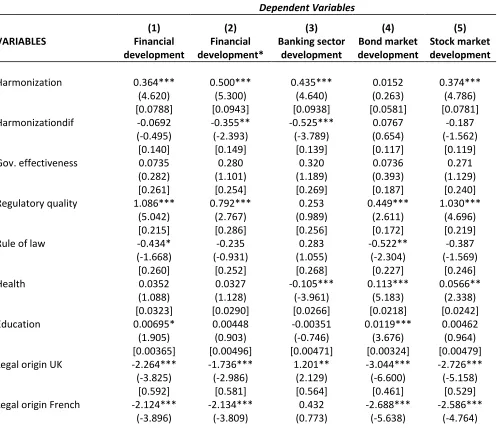
Additionally we check for the robustness of our results when accounting for legal origins. Legal origins refer to the differences across countries in legal systems that are structured according to families of law. Depending on the historical background and development of legal families, characteristics of the legal structures, and distinctive institutions, each country has a different legal tradition. As La Porta et al. present in their series of articles (1997, 1998, and 2008), the most popular legal traditions are the common law and the civil law from which several sub-traditions such as the French, German, socialist and Scandinavian legal origins arise.14 Although for our purpose, there is not much difference between the French, German and British laws in terms of implementing the EU legislation proposed under the FSAP, the way these provisions will be carried out into domestic law, the manner that these directives will be monitored and enforced may show vast differences across member countries. This remains to be a factor too strong to forgo. Together with governmental and institutional factors, health and educational variables, differences in legal origins across countries may highly influence the link between financial harmonization and financial development. Our analysis with the addition of legal origins in Table 10 finds the effect of financial harmonization index to be positive and significant for all development indices with the exception of the bond market development index. Once again, the harmonization difference variable is shown to have a negative coefficient for most development indices. Although the legal origin dummies for the U.K., France, Germany, Socialist regimes, and Scandinavian countries appear to be negatively
14 Please refer to La Porta et al. (2008). Legal origins dummies are obtained from the original La Porta et al. (1998)
15 significant in some regressions, the coefficients alter signs depending on the dependent variables selected. The results correspond to those of the benchmark model of Table 5, demonstrating the robustness of our initial findings.
Additionally, we examine the effects of the recent financial crisis on the link between financial harmonization and financial development. Starting from 2008, the financial crisis has had a wide-spread effect on most European countries. Greece, Portugal, Ireland, Italy, Spain and recently Cyprus have had to deal with increasing levels of unemployment, large declines in growth rates, and worst of all with growing levels of deficits and bankruptcy. The three strongest economies, Germany, France and the UK, have also experienced worsening of financial markets and a damaging slowdown of economic growth. In order to study the impact of the crisis on how the FSAP directives have been implemented across countries, we include the most recent years, for which data is available, in our analysis.15
The recent financial crisis has undermined the degree of integration across countries. As the fear of contagion of the detrimental outcomes of the crisis surges, harmonization and the relative timing of adoption of the FSAP directives could very well be negatively affected. The results from Table 11 show similarities to our benchmark model. Harmonization index is positive and significant for the financial development index that excludes the bond market, and for the banking sector development index.
In order to examine how harmonization has been affected by the recent financial crisis we include interaction terms of the explanatory variables in our model and analyze their behavior once the dataset is extended to include the crisis period. An indicator for the crisis period is initially constructed as a dummy variable that takes on a value of 1 on and after 2008, and a value of 0 otherwise. This term is then multiplied by the explanatory variables to construct interaction terms. The results reported in Table 12 convey a harmonization index that is positive and significant. The harmonization difference measure is similarly found to have a negative coefficient that is significant for most dependent variables. Examining the interaction terms, harmonization has a negative but insignificant coefficient. Figure 1 depicts the harmonization index and the harmonization variable. Similarly the graphs across countries do not convey a clear alteration of the rate of harmonization during 2008 – 2010. The crisis period does not seem to have affected the pace of the harmonization process. This could be the result of the last directives being established in 2006. Although by the end of our sample period there were countries remaining to implement some of the directives under the FSAP, most countries had already transposed majority of the directives into national law. Hence the positive impact of harmonization on financial, banking sector and bond and stock market development indices continues when we control for relative timing of adoption across countries. We have thereby shown that the link between financial harmonization and financial development is positive and robust.
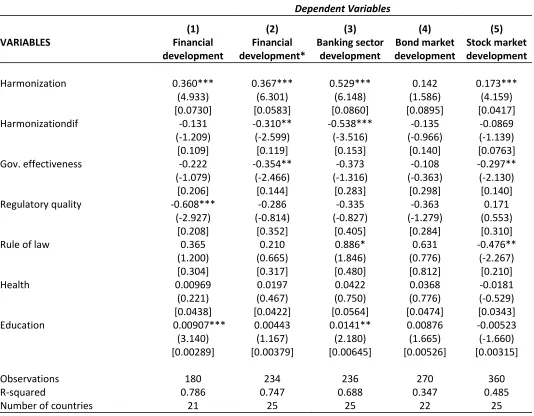
We lastly check to see if using indices for financial development as opposed to individual measures alters our results. Ozkok (2010) depicts that using index measures the link between financial openness and financial development is found to be more significant and positive than what the literature had previously conveyed. Here we employ individual banking, stock market and bond market development indicators to
16 examine whether we lose any information from using principal component style indices for financial development rather than individual measures. The results from Table 13 depict that the harmonization index is positive and mostly significant. The magnitudes of significances depend largely on the dependent variables selected. Comparing our findings to those from Table 5 we find that the index measures for banking sector, bond and stock market and overall financial development provide more significant and more robust (in terms of standard errors) results. We thereby can conclude that we do not lose from indexing financial development measures; quite the opposite; we gain more by doing so.
One final remark is the concern of endogeneity and causality when analyzing the link between financial harmonization and financial development. We have so far argued that our financial harmonization index that stems from the use of Financial Services Action Plan directives is exogenous. The implementation of these directives of the FSAP is originally determined at the level of the European Commission. Although countries do have control over their implementation dates, they have to follow the European
Commission’s deadlines of adoption for these FSAP directives. Therefore, any disobedience with the
timing of the implementation of these financial harmonization policies may result in sanctions that are costly for the member countries. The decision taken at the country level on when to implement each directive depends mostly on the alterations or modifications made to the legal systems, institutions and current regulations rather than being determined by future prospects of growth or development. The expectation for future development is undeniable; the idea behind harmonization just like integration is to achieve overall growth and development as put forward by both the European Commission and the European Union. Nevertheless, given the exogenous source of variation of the FSAP directives at the
Commission’s level, we hereby argue financial harmonization is not adopted with the hope of achieving financial development.
5.
Concluding Remarks
The Financial Services Action Plan (FSAP) was established with the initiative of building an integrated and harmonized financial market among its member states. After the implementation of the Euro, the FSAP directives have constituted a further step in bringing together European countries through legislative and regulatory terms in banking, insurance and securities markets.
18
Acknowledgements
19
REFERENCES
Alexander, K. 2002. Establishing a European Securities Regulator: Is the European Union an Optimal Economic Area for a Single Securities Regulator? Cambridge Endowment for Research in Finance Working Paper No. 7, 1 – 41
Arestis, P., and P. O. Demetriades. 1997. Financial Development and Economic Growth: Assessing the Evidence. Economic Journal, 107 (442): 783 – 799
Aziakpono, J. M. 2007. Effects of Financial Integration on Financial Development and Economic Performance of the SACU Countries. Paper presented at the ECA/ADB African Economic Conference, Addis Ababa, Ethiopia
Baltagi, B., P. Demetriades, and S. H. Law. 2007. “Financial Development, Openness, and Institutions: Evidence from Panel Data.” Paper presented at the IMF Conference on New Perspectives on Financial Globalization, Washington, DC
Baltagi, B., P. Demetriades, and S. H. Law. 2009 “Financial Development, Openness, and Institutions: Evidence from Panel Data.” Journal of Development Economics, 89 (2): 285 – 296
Bankenverband. 2007. Continuing the Integration of European Financial Services Markets. 1 – 30
Beck, T., A. Demirguc-Kunt, and R. Levine. 2000. A New Database on Financial Development and Structure, World Bank Policy Research Working Paper 2146,
http://econ.worldbank.org/WBSITE/EXTERNAL/EXTDEC/EXTRESEARCH/0,,contentMDK:2069616 7~pagePK:64214825~piPK:64214943~theSitePK:469382,00.html (accessed March 8th, 2013)
Berger, A. N. 2003. Global Integration in the Banking Industry, Federal Reserve Bulletin, 451 – 460
Bo, C., and Y. P. Woo. 2008. A Composite Index of Economic Integration in the Asia-Pacific Region. Asia Pacific Foundation of Canada Working Paper
Bo, C., and Y. P. Woo. 2010. Measuring Economic Integration in the Asia-Pacific Region: A Principal Components Approach. Asian Economic Papers, 9 (2): 121 – 143
Boyfield, K., H. Robinson, and L. Mullally. 2006. Selling the City Short? A Review of the EU’s Financial Services Action Plan., Open Europe, 1 – 119,
http://www.openeurope.org.uk/Content/Documents/PDFs/fsap.pdf (accessed: July 15, 2012)
Braumoeller, B. F. 2004. Hypothesis Testing and Multiplicative Interaction Terms. International Organization, 58, 807 – 820
Cameron, A. C., J. B. Gelbach, and D. L. Miller. 2006. Robust Inference with Multi-way clustering. NBER Technical Working Paper 327
Cetorelli, N., and P. Strahan. 2006. Finance as a Barrier to Entry: Bank Competition and Industry Structure in Local U.S. Markets. Journal of Finance, 61 (1): 437 – 461
20 Cetorelli, N., and M. Gambera. 2001. Banking Market Structure, Financial Dependence and Growth:
International Evidence from Industry Data. The Journal of Finance, 56 (2): 617 – 648
Chinn, M., and H. Ito. 2002. Capital Account Liberalization, Institutions and Financial Development: Cross Country Evidence. NBER Working Paper 8967
Chinn, M., and H. Ito. 2006. What Matters for Financial Development? Capital Controls, Institutions and Interactions. Journal of Development Economics, 81 (1): 163 – 192
Claessens, S., and L. Laeven. (2005). Financial Dependence, Banking Sector Competition, and Economic Growth. Journal of the European Economic Association, 3 (1): 179 – 207
De Avila, D. R. 2003. Finance and Growth in the EU: New Evidence from the Liberalization and Harmonization of the Banking Industry. European Central Bank Working Paper 266
De Gregorio, J. 1999. Financial Integration, Financial Development, and Economic Growth.
http://www.econ.uchile.cl/uploads/publicacion/c6b5fc4b-498f-462e-9453-2ae0325e0b2f.pdf
Demetriades, P. O., and S. Andrianova. 2005. Sources and Effectiveness of Financial Development: What We Know and What We Need to Know. UNU – WIDER World Institute for Development
Economic Research Working Papers RP2005/76
Demetriades, P. O., and S. H. Law. 2004 Capital inflows, trade openness and financial development in developing countries. Money Macro and Finance (MMF) Research Group Conference 38
Demetriades, P. O., and S. H. Law. 2006. “Openness, Institutions and Financial Development.” WEF Working Papers 0012
Demirguc-Kunt, A., and R. Levine. 2001. Financial Structure and Economic Growth: A Cross-Country Comparison of Banks, Markets, and Development. Cambridge, Massachusetts: MIT Press
Dunteman, G. H. 1989. Principal Components Analysis. Newbury Park, California: Sage Publications
Ekinci, M., S. Kalemli – Ozcan, and B. Sorensen. 2007. Financial Integration within EU Countries: The Role of Institutions, Confidence and Trust. NBER Working Paper 13440
Enriques, L., and M. Gatti. 2008. Is There a Uniform EU Securities Law After the Financial Services Action Plan? Stanford Journal of Law, Business & Finance, 14 (1): 43 - 83
Europa, Access to European Union Law National Execution Measures. Europa EUR – Lex, http://eur-lex.europa.eu/LexUriServ/LexUriServ.do?uri=CELEX:72006L0049:EN:NOT#FIELD_MT (accessed: April 20, 2013)
Europa. 1999. Financial Services: Commission outlines Action Plan for single financial market. Europa Press Releases RAPID,
http://europa.eu/rapid/pressReleasesAction.do?reference=IP/99/327&format=HTML&aged=1& language=EN&guiLanguage=en (accessed: April 20, 2013)
Europa. 2004. Financial Services Action Plan: good progress but real impact depends on good implementation. Europa Press Releases RAPID,
21 Europa. 2006. Evaluation of Economic Impact of the Financial Services Action Plan. Workshop on the
Methodology, 1 – 30
European Commission. 1999. Financial Services: Implementing the Framework for Financial Markets: Action Plan. Communication of the Commission, 1 – 32
European Commission. 2005. FSAP Evaluation, Part I: Process and implementation. Financial Services Policy and Financial Markets Report,
http://ec.europa.eu/internal_market/finances/docs/actionplan/index/070124_part1_en.pdf
(accessed April 20, 2013)
European Commission. 2010. Transposition of Financial Services Action Plan.
http://ec.europa.eu/internal_market/finances/actionplan/transposition/database/austria_en.ht m (accessed May 1, 2013)
European Commission. 2011. European Financial Stability and Integration Report 2010. European Commission Staff Working Paper
European Commission. 2013. Application to EU Law.
http://ec.europa.eu/eu_law/infringements/infringements_260_en.htm (accessed May 23, 2013)
Eurostat. 2011. Bilateral Exchange rates and Former euro area national currencies exchange rates database, The Statistical Office of the European Union (accessed: May 30, 2011)
Evans, P., I. Hasan, and A. Lozano-Vivas. 2008. Deregulation and Convergence of Banking: The EU Experience. Finnish Economic Papers, 21 (2): 104 – 117
Fisman, R., and I. Love. 2003. Financial Dependence and Growth Revisited. NBER Working Paper Series 9582
Fitzgerald, V. 2006. Financial Development and Economic Growth: A Critical View. Background Paper for World Economic and Social Survey
FSA. 2003. Completing the Financial Services Action Plan.
http://www.fsa.gov.uk/library/communication/speeches/2003/sp131.shtml (accessed May 15, 2013)
FSA. 2010. European. http://www.fsa.gov.uk/about/what/international/european (accessed May 15, 2013)
Gual, J., and D. J. Neven. 1992. Deregulation of the European Banking Industry (1980 – 1991). CEPR Discussion Papers 703
Gual, J. 2003. The Integration of EU Banking Markets Universidad de Navara IESE Banking School Working Paper 504
Guiso, L., T. Jappelli, M. Padula, M. Pagano, P. Martin, and P. O. Gourinchas. (2004). Financial Market Integration and Economic Growth in the EU. Economic Policy, 19 (40): 525 – 577
22 Gupta, N., and K. Yuan. (2009). On the Growth Effect of Stock Market Liberalizations. Review of Financial
Studies, 22 (11): 4715 – 4752
Hartmann, P., A. Maddaloni, and S. Manganelli. 2003. The Euro Area Financial System: Structure, Integration and Policy Initiatives. European Central Bank Working Paper 230
HM Treasury, The Financial Services Authority, and the Bank of England. 2003. The EU Financial Services Action Plan: A Guide. 1 – 24
HM Treasury, The Financial Services Authority, and the Bank of England. 2004. After the EU Financial Services Action Plan: A new strategic approach. 1 – 48
HM Treasury, The Financial Services Authority, and the Bank of England. 2004. The EU Financial Services Action Plan: Delivering the FSAP in the UK. 1 – 48
Hatcher, L. 1994. A Step-by-Step Approach to Using SAS for Factor Analysis and Structural Equation Modeling. Cary, North Carolina: SAS Institute Inc.
Holmstorm, B., and J. Tirole. 1997. Financial Intermediation, Loanable Funds, and the Real Sector. Quarterly Journal of Economics, 112 (3): 663 – 691
Huang, W. 2006. Emerging Markets, Financial Openness, and Financial Development. University of Bristol Economics Discussion Papers 06/588
Jackson, E. 1991. A User’s Guide to Principal Components, New Jersey: John Wiley & Sons, Inc.
Jayaratne, J., and P. Strahan. 1996. The Finance-Growth Nexus: Evidence from Bank Branch Deregulation. Quarterly Journal of Economics, 111 (3): 639 – 670
Jayaratne, J., and P. Strahan. 1997. The Benefits of Branching Deregulation. Federal Reserve Bank of New York Economic Policy Review, 3 (4): 13 – 29
Jayaratne, J., and P. Strahan. 1998. Entry Restrictions, Industry Evolution and Dynamic Efficiency: Evidence from Commercial Banking. Journal of Law and Economics 41 (1): 239 – 274
Jolliffe, I.T. 2002. Principal Component Analysis, New York: Springer-Verlag, Inc.
Kalemli - Ozcan, S., E. Papaioannou, and J. L. Peydro. (2010 a). Financial Regulation, Financial
Globalization and the Synchronization of Economic Activity. European Central Bank Working Paper Series 1221
Kalemli - Ozcan, S., E. Papaioannou, and J. L. Peydro. (2010 b). What Lies Beneath the Euro’s Effect on Financial Integration? Currency Risk, Legal Harmonization, or Trade? Journal of International Economics, 81 (1): 75 – 88
Kezdi, G. 2003. Robust Standard Errors Estimation in Fixed-Effects Panel Models. ECONWPA Econometrics Series
23 Klenow, P. J. 1998. Ideas versus rival human capital: Industry evidence on growth models. Journal of
Monetary Economics, 42: 3 – 23
Kroszner, R. S., and P. Strahan. 1999. What Drives Deregulation? Economics and Politics of the
Relaxation of Bank Branching Restrictions. Quarterly Journal of Economics, 114 (4): 1437 – 1467
La Porta, R., F. Lopez-de-Silanes, A. Shleifer, and R. Vishny. 1997. Legal Determinants of External Finance. Journal of Finance, 52 (3): 1131 – 1150
La Porta, R., F. Lopez-de-Silanes, A. Shleifer, and R. Vishny. 1998. Law and Finance. Journal of Political Economy, 106 (6): 1113 – 1155
La Porta, R., F. Lopez-de-Silanes, A. Shleifer, and R. Vishny. 1999. The Quality of Government. Journal of Law, Economics and Organization, 15 (1): 222 – 279
La Porta, R., F. Lopez-de-Silanes, and A. Shleifer. 2008. The Economic Consequences of Legal Origins. Journal of Economic Literature, 46 (2): 285 – 332
Law, S. H., and W.N.W A. Saini. 2008. The Quality of Institutions and Financial Development. MPRA Paper 12107
Levine, R. 2001. International Financial Liberalization and Economic Growth. Review of International Economics, 9 (4): 684 – 698
London Economics. 2002. Quantification of the Macro-Economic Impact of Integration of EU Financial Markets. Executive Summary of the Final Report to the European Commission – Directorate-General for the Internal Market, 1 – 9
Malcolm, K., M. Tilden, and T. Wilsdon. 2009. Evaluation of the economic impacts of the Financial Services Action Plan. European Commission Internal Market and Services Final Report, 1 – 243
Morgan, D. P., B. Rime, and P. Strahan. 2001. Bank Integration and Business Volatility in the U.S. Federal Reserve Bank Staff Report 129
Morgan, D. P., and P. Strahan. 2003. Foreign Bank Entry and Business Volatility: Evidence from U.S. States and Other Countries. NBER Working Papers – 9710
Morgan, D. P., B. Rime, and P. Strahan. 2004. Bank Integration and State Business Cycles. The Quarterly Journal of Economics, 119 (4): 1555 – 1584
Nagar, A. L., and S. R. Basu. 2002. Weighting Socioeconomic Indicators of Human Development: A Latent Variable Approach. In Ullah A. et al. (eds) Handbook of Applied Econometrics and Statistical Inference. Marcel Dekker, New York
Ozkok, Zeynep. 2010. Financial Dependence and Financial Openness: An Analysis Using Indices. Universidad Carlos III de Madrid Working Paper
Ozkok, Zeynep. 2012. Financial Harmonization and Industrial Growth: Evidence from Europe. Universidad Carlos III de Madrid Working Paper
24 Rajan, R. G, and L. Zingales. 1998. Financial Dependence and Growth. American Economic Review, 88 (3):
559 – 586
Sorensen, B., and H. Ozer-Balli. 2011. Interaction Effects in Econometrics. University of Houston Working Paper
Spiegel, M. M. 2004. Monetary and Financial Integration: Evidence from the EMU. FRBSF Economic Letter 20, 1 – 4
Strahan, P. 2002. The Real Effects of U.S. Banking Deregulation. Wharton Financial Institutions Center Working Paper Series 02 – 39
Thompson, S. B. 2011. Simple formulas for standard errors that cluster by both firm and time. Journal of Financial Economics, 99: 1 – 10
Ullah, A., and D. E. A Giles. 1998. Handbook of Applied Economic Statistics, New York: Marcel Dekker, Inc.
UNCTAD. 2005. Trade and Development Index. Developing Countries in International Trade.
http://unctad.org/en/docs/ditctab20051ch1_en.pdf (accessed May 17, 2013)
UniCredit Group Forum on Financial Cross-Border Groups. 2009. Cross-border banking in Europe: What Regulation and Supervision? UniCredit Group Discussion Paper, 1 – 27
World Bank. 2012. DataBank. 1960 – 2012. World Development Indicators. The World Bank Group.
http://databank.worldbank.org/data/views/variableselection/selectvariables.aspx?source=worl d-development-indicators (accessed January 25, 2014)
25
[image:26.792.81.719.147.544.2]APPENDIX
Table 1: Timing of the FSAP Directives for the EU Member Countries
Directives AT BE CY CZ DK EE FI FR DE GR HU IE IT LV
1998/26/EC 1999 1999 Not Yet Not Yet 2000 2004 1999 2001 1999 2000 Not Yet 1999 2001 Not Yet
2000/46/EC 2002 2003 2004 2003 2005 2006 2003 2003 2002 2003 2004 2002 2002 2004
2000/64/EC 2003 2004 2002 2004 2004 2001 2004 2006 2002 2004 2002 Not Yet Not Yet 2004
2001/17/EC 2003 2004 2004 2004 2006 2005 2004 2005 2003 Not Yet 2004 2003 2003 2004
2001/24/EC 2003 2004 2004 2005 2004 2005 2004 2004 2004 2006 2004 2004 2004 2004
2001/65/EC 2004 2005 2003 2004 2002 2004 2004 2004 2004 2006 2004 2004 2005 1993
2001/86/EC 2004 2004 2004 2004 2004 2005 2004 2005 2004 2006 2004 2006 2005 2005
2001/97/EC 2003 2004 2003 2004 2005 2004 2003 2004 2002 2005 2003 2003 2004 2004
2001/107/EC 2003 2004 2004 2004 2004 2004 2004 2003 2004 2004 2003 2003 2003 2005
2001/108/EC 2003 2004 2004 2004 2005 2004 2004 2003 2004 2004 2003 2003 2003 2004
2002/13/EC 2003 2004 2004 2004 2004 2005 2004 2004 2004 2005 2004 2005 2004 1998
2002/47/EC 2003 2005 2004 2005 2004 2004 2004 2005 2004 2004 2004 2004 2004 2005
2002/65/EC 2004 2006 2004 2004 2005 2004 2005 2005 2004 2005 2005 2004 2005 2004
2002/87/EC 2005 2005 2005 2005 2004 2005 2004 2004 2005 2006 2004 2005 2005 2005
2002/83/EC 2003 2004 2004 2004 2004 2005 2004 2004 2004 2005 2004 2005 2004 1998
2002/92/EC 2004 2005 2004 2005 2005 2005 2005 2005 Not Yet 2005 2005 2005 2006 2005
2003/6/EC 2005 2005 2005 2006 2005 2005 2005 2005 2004 2005 2005 2005 2005 2005
2003/41/EC 2005 2006 2006 2006 2005 2004 2006 2006 2005 2005 2005 2005 Not Yet 2005
2003/48/EC 2004 2005 2005 2004 2004 2004 2004 2003 2005 2005 2003 2003 2005 2005
2003/51/EC 2005 2006 2005 2004 2002 2005 2004 2004 2004 2006 2005 2005 Not Yet 1993
2003/71/EC 2005 2006 2005 2006 2005 2005 2005 2005 2005 2005 2005 2005 Not Yet 2005
2004/25/EC 2006 2007 2007 2006 2005 2007 2006 2006 2006 2006 Not Yet 2006 2007 2006
2004/109/EC 2007 2007 2009 2006 2007 2007 2007 2007 2007 2007 Not Yet 2007 2007 2007
2004/39/EC 2007 2008 2010 2006 2007 2007 2007 2007 2007 2007 Not Yet 2007 2007 2008
2005/56/EC 2007 2008 2007 Not Yet 2007 2008 2007 2008 2007 2009 Not Yet 2008 2008 2010
2006/48/EC 2007 2007 Not Yet Not Yet 2007 2007 2007 2007 2006 2007 Not Yet 2007 2007 2010
26
Sources: Kalemli – Ozcan, S., E. Papaioannou, and J. L. Peydro. (2010 b). What Lies Beneath the Euro’s Effect of Financial Integration? Currency Risk, Legal
Harmonization, or Trade? Journal of International Economics, 81 (1): 75 – 88, European Commission. 2010. Transposition of Financial Services Action Plan.
http://ec.europa.eu/internal_market/finances/actionplan/transposition/database/austria_en.htm, and Europa, Access to European Union Law National Execution Measures, http://eur-lex.europa.eu/LexUriServ/LexUriServ.do?uri=CELEX:72006L0049:EN:NOT#FIELD_MT
Directives LT LU MT NL PL PT SK SI ES SE UK
1998/26/EC Not Yet 2001 2002 1999 Not Yet 2000 2006 2004 1999 2000 1999
2000/46/EC 2005 2002 2002 2002 2003 2002 2004 2006 2002 2002 2002
2000/64/EC 2004 2001 2002 2003 2004 2000 2006 2004 2002 2000 2003
2001/17/EC 2004 2004 2004 2004 2004 2003 2005 2004 2003 2006 2003
2001/24/EC 2005 2004 2004 2005 2004 2006 2005 2004 2005 2006 2004
2001/65/EC 2004 2006 2001 2005 1995 2004 2005 2004 2004 2004 2004
2001/86/EC 2005 2006 2004 2005 2005 2005 2004 2006 2006 2004 2004
2001/97/EC 2004 2004 2003 2001 2001 2004 2006 2002 2003 2005 2004
2001/107/EC 2003 2003 2004 2005 2004 2004 2004 2004 2004 2004 2004
2001/108/EC 2003 2003 2004 2005 2004 2004 2004 2004 2004 2004 2004
2002/13/EC 2004 2004 2004 2003 2004 2003 2004 2004 2004 2004 2004
2002/47/EC 2004 2005 2005 2004 2004 2004 2005 2003 2002 2005 2005
2002/65/EC 2004 Not Yet 2005 2006 2000 Not Yet 2005 Not Yet Not Yet 2004 2004
2002/87/EC 2004 2006 2005 2007 2005 Not Yet 2006 2006 2005 2006 2004
2002/83/EC 2004 2004 2004 2003 2004 2003 2004 2004 2004 2004 2005
2002/92/EC 2004 2005 2006 2005 2004 2006 2005 2004 2006 2005 2005
2003/6/EC 2004 2006 2005 2005 2005 2006 2006 2004 2005 2005 2005
2003/41/EC 2006 2005 2004 2006 1999 2006 2005 2003 2005 2006 2005
2003/48/EC 2005 2005 2004 2004 2005 2005 2005 2006 2004 2005 2005
2003/51/EC 2003 2006 2002 2005 1995 2005 2005 Not Yet 2005 2006 2005
2003/71/EC 2005 2005 2005 2005 2005 2005 2005 2006 2005 2005 2005
2004/25/EC 2007 2006 2006 2007 2009 2006 2007 2006 2007 2006 2006
2004/109/EC 2007 2007 2007 Not Yet Not Yet 2007 Not Yet 2007 2007 2007 2007
2004/39/EC 2008 2008 2007 2007 Not Yet 2007 2007 2007 2007 2007 2007
2005/56/EC 2012 2007 2007 2008 2008 Not Yet Not Yet 2008 2009 2008 2007
2006/48/EC 2011 2007 2007 2007 2010 2007 Not Yet 2007 2008 2007 2007