University of Warwick institutional repository: http://go.warwick.ac.uk/wrap
This paper is made available online in accordance with publisher policies. Please scroll down to view the document itself. Please refer to the repository record for this item and our policy information available from the repository home page for further information.
To see the final version of this paper please visit the publisher’s website. Access to the published version may require a subscription.
Author(s): Eugenio Proto and Daniel Sgroi
Article Title: False Consensus in Economic Agents Year of publication: 2011
Link to published article:
http://www2.warwick.ac.uk/fac/soc/economics/research/workingpapers/ 2011/twerp_968.pdf
False Consensus in Economic Agents
Eugenio Proto and Daniel Sgroi
No 968
WARWICK ECONOMIC RESEARCH PAPERS
False Consensus in Economic Agents
Eugenio Proto
and
Daniel Sgroi
Department of Economics, University of Warwick∗
September 2011
Abstract
In an incentivized experiment we identify a powerful and ubiquitous bias:
in-dividuals regard their own characteristics and choices as more common than is
the case. We establish this “false consensus” bias in terms of happiness, political
stance, mobile phone brand and on the attitude to deference in a hypothetical
restaurant choice, and show that it is not limited to the distribution of hard to
ob-serve characteristics and choices but also to weight and height. We also show that
the bias is not driven by the fact that the tallest, happiest, most left/right-wing,
etc. are more salient.
Keywords: false consensus, saliency, biased beliefs, happiness, politics, height, weight.
JEL classification: D03, C83, D84.
“Let them eat cake”
(Commonly attributed to) Marie Antoinette (1755−1793), Archduchess of
Austria and Queen of France.
1
Introduction
Rational expectations or beliefs have a central role in economics and in how economists
model behavior. Manski (2004) has emphasized how the departure from the assumption
∗The authors thank several colleagues for discussions on related research, especially Dan Benjamin,
of rational expectations can jeopardize our capacity to identify the right model. This
paper identifies a bias which represents such a departure and our results indicate that
this bias is far more wide-ranging than has hitherto been considered. We examine the
accuracy of economic agents’ perceptions of the distribution of certain characteristics or choices, particularly focusing on whether each agent is biased by his or her own position
within the distribution of each characteristic or past choices. Put simply, does a tall
person think the population is full of other tall people? Does a short person think the
population is shorter? Will a happier individual see more happiness present in the world
around her? Will someone who owns one brand of mobile phone believe it to be more
popular than is the case? Will more deferential individuals believe that others are also
more deferential? We address a wide range of possible characteristics and choices ranging
from happiness and political stance, through height, weight, mobile phone choice and
attitudes towards hypothetical restaurant choice. Across all of these we find a strong bias reminiscent of the “false consensus effect”. Crucially the extent of the bias is powerfully
related to the type of the individual in question: a tall person does indeed see the world
as occupied by more tall people than his shorter peers. Similarly with choice, owning
a particular mobile phone carries with it a belief that it is more popular than the true
distribution would imply and a deferential individual will also perceive others to be
deferential.
The “false consensus bias” was first defined in Ross, Greene and House (1977) as
“...the tendency for an individual see their own behavioral choices and judgements as
relatively common and appropriate to existing circumstances, while viewing alternative responses as uncommon, deviant and inappropriate”.1
We analyze the relevance of this bias for economic agents; in a series of
appropri-ately incentivized experiments, we find that the bias extends to cover a broad range of
perceptions, attitudes and behaviors typically investigated in economic theory, such as
political beliefs, consumer choices and information processing. The false consensus bias
represents an important departure from rational expectations. For example, biased
per-ceptions of others’ choices can lead to bias in your own choice when that choice is itself
a function of the choice of others.2 Similarly, bias in the perception of the happiness of
others might bias individuals’ attitudes towards altruism and redistribution. Bias in the
1Ross et al. (1977) article and was soon followed by a series of empirical contributions (see Mullen
et. al, 1985 for a survey).
2This is clear for network goods but extends to any goods or services where quality might be uncertain
perception of the political beliefs of others could change the decision concerning whether
to vote or how to vote. And so the list goes on.
We also explore the role of observability by examining a broad range of characteristics
and choices which encompass the easy to observe (height, weight) through the almost completely unobservable (political stance). Height and weight, perhaps of least interest
to economic theory directly, play a special role as we might think that biases in perception
disappear where the characteristic is easily observed. But our findings show otherwise:
biased perceptions persist even when a characteristic is easily observable.
A powerful confounding effect with a long lineage in psychology and behavioral
eco-nomics is saliency. If extremists have a more vocal presence in society they may be
more salient in memory than justified by their proportion in society. The result is a
biased perception of the distribution of types with fatter tails at the extreme ends of
the distribution. Any study which claims that a taller person believes that others are taller must first deal with the potential confound thateveryone, irrespective of their own
type, perceives taller people to be more ubiquitous than is the case. In our design we
ask our participants to report not only their beliefs regarding their own position and
the overall averages but also the averages for the top and bottom 10%, which gives us
direct information about their perceptions of the tails of each distribution. Apart from
beliefs concerning extreme right-wing political beliefs we found no evidence of saliency.
Moreover, even in political stance there is also a false consensus effect which we can
disentangle from the saliency of extremists.
The fact that the individuals in our experiment hold biased perceptions is a violation of the Bayesian paradigm. Consider for example that these biased perceptions stem
from interacting with a close peer group who all share similar characteristics. In essence,
individuals are grouped following a simple matching process and thereby are exposed
to others with similar characteristics.3. Using the information drawn from a close peer
group is not non-Bayesian, but failing to incorporate the fact that the characteristics are
highly correlated within the group is non-Bayesian. Essentially agents with this bias are
treating correlated observations as independent.
In related work, Engelmann and Strobel (2001) show that when subjects are given
information about other subjects choices, they correctly use their information to assess the distribution of that choice over a randomly selected sample. Hence they argue that
false consensus does not apply as there is no apparent over-weighting of own-choices.
3As has been shown to be the case in numerous recent empirical contributions on homophily, for
However, we find strong evidence of false consensus for freely observable characteristics
such as height and weight among same gender students in the same university, and
moreover many of the characteristics we study are generated not in the laboratory but
through real-life experiences. We would therefore argue against the lack of information as an explanation of the self-centered perception bias on the distributions of characteristics.4
1.1
Overview
The next section details the experimental design and describes the key variables. Section
3 explores the results of the experiment, comparing the perceived and true distributions in
a variety of ways and establishing the powerful and ubiquitous nature of the bias. Section
4 directs our attention to the role of saliency, probably the most important confounding
effect. Section 5 looks at a number of possible psychological and economic explanations
for false consensus, such as availability, self-deception, assortative matching, homophily,
and projection. Section 6 provides some concluding remarks. The full experimental
instructions can be found in the Supplementary Information.
2
Experimental Design and a Description of the Key
Variables
Our data was collected using a series of on-screen tasks and questions presented in a
controlled experiment at the University of Warwick. The full text of the questionnaires
and the accompanying instructions are provided in full in the Supplementary
Informa-tion. The experiment was conducted in a laboratory, however many of the choices and characteristics are drawn from the real-world experiences of our participants as well as
information bestowed upon them in the laboratory. The participants were 154 students
drawn from the university-wide experimental pool of over 1500 subjects.5 The
experi-4The biases we identify may be stronger than those in Engelmann and Strobel partly because they are
built up over many years prior to the experiment and partly because we do not bestow our participants with accurate information, rather we allow them to choose whether to make use of the information that has been readily available to them outside the laboratory. In that sense we would argue that especially for freely observable characteristics what we see is akin to the endogenous development of false consensus over a lifetime rather than artificially induced false consensus within the laboratory. We return to the issue of how false consensus emerges in section 5.
5Ensuring a varied pool of experimental participants selected on as randomized a basis as possible
ment took place in 19 sessions with about 8 student per session, and was conducted on
27 May, 30 May and 29 June 2011.6
Subjects were given a £2.50 show-up fee, plus a bonus of £5 pounds if a randomly
drawn answer was within 10% of the correct answer in rounds 2, 3, 4, 5 and 6 as described below. For example, if participants were asked to state the average height of
the student body in Warwick and this was the randomly allocated bonus question they
received a£5 bonus if and only if their answer was within 10% of the true average.7 The
incentivized payment scheme was fully transparent to all participants and highlighted in
the instructions at the appropriate times in the experiment. The experiment contained
seven separate rounds as described below. Once each round was completed participants
could not go back and change earlier answers, nor did they know the content of later
rounds upon entering answers to earlier rounds. This was important as it prevented any
attempt to retroactively alter their answers to make winning the bonus payment easier. In particular, the nature of the bonus payment was not revealed until round 2 to avoid
strategic play by participants.8 No participant was allowed to participate more than
once.9 The experiment itself typically lasted 20 minutes and the average payment was
a little over £5, producing an hourly rate of around 25 US dollars. The experimental
time-line is summarized below but a full transcript of the instructions and tasks faced
by the participants is provided in the Supplementary Information.
drew from this large pool of potential applicants on a random basis. Participants were recruited without any knowledge of the nature of the experiment and so could not self-select into or out of the experiment. The times and dates of the sessions were varied to avoid discriminating against participants from any demographic, and in the event we had large variety in terms of subject, year-group and gender.
6There was also an earlier non-incentivized pilot experiment which consisted of 120 participants
drawn from the same experimental pool, held on 17 March, 5 May and 11 May, 2010. The main results for this paper will be drawn from the fully-incentivized experiment, though the data from the pilot study will be used when calculating the average height, weight, happiness and political stance of the Warwick student body.
7For our purposes the true average was based on the numbers generated within this experiment and
and from the earlier non-incentivized pilot experiment. For one question, denoted (5e) below the scheme was changed slightly as participants had to select from an interval and so they were told that an answer in the correct interval or the one to either side would be sufficient to win the prize.
8For example, a strategic participant who knew that in round 2 they would be asked for the percentage
of students who were shorter than themselves, would do well to report that they were extremely tall in round 1 to increase their chances of estimating correctly and thereby receive a higher expected payment from the experimental. Since participants did not see the content of round 2 before they had already completed round 1 and since they were not allowed to return to their round 1 answers and adjust them this strategic element was tightly controlled.
2.1
Experimental Time-line
Participants arrive at the laboratory, are registered and taken to a screened computer
terminal where they receive on-screen instructions as detailed in the Supplementary
Information. The participants were informed that everything they do is fully anonymous.
To that end they received randomly generated usernames and passwords to use as logins
for the terminals. After entering usernames and passwords the experiment proper begins
in round 1 by asking participants to report their gender (1a), height (1b), weight (1c),
happiness (1d), political beliefs (1e), and current brand of mobile phone (1f). They are
also given a hypothetical restaurant choice as follows: “Imagine that you have to decide between two restaurants in which to have dinner alone. They are called restaurant A and
B. You have some private information that A is better, but you know that an equally
well-informed colleague has information suggesting that B is better. Would you choose
to eat at A, B or are you indifferent?” (1g).
For (1b) and (1c) they were allowed to enter their heights and weights in metric or
imperial measurements as they wished and this freedom was maintained in all rounds.
For (1d) participants are instructed to use a 7-point Likert scale as follows: “Please
use a 7-point scale where 1 is completely sad, 2 is very sad, 3 is fairly sad, 4 is neither
happy nor sad, 5 is fairly happy, 6 is very happy and 7 is completely happy.” For (1e) they are instructed to use a similar scale: “Please use a 7-point scale where 1 is
far left, 2 is left, 3 is centre left, 4 is centre, 5 is centre right, 6 is right and 7 is far
right.” (1g) might be of special interest to those interested in rational herding and
informational cascade literature (see Banerjee, 1992, and Bikhchandani, Hirshleifer and
Welch, 1992) and essentially asks what participants would do in a situation of theoretical
indifference when processing information. There is no clear wrong answer to (1g) though
“A” points to a measure of confidence in the participant’s private signal over that of
their colleague, whereas “B” perhaps implies a measure of deference towards others (or
a lack of confidence in the individual’s own signal). Once they answered these questions and hit a “submit answers” button they were taken to the round 2 questions.
At this point they were informed that one question would be chosen at random in
round 2 or the later rounds (rounds 3, 4, 5 and 6) as a “prize question” for which they
would receive a bonus payment of£5 if their answer was within 10% of the correct answer.
They were then asked to report the percentage of students at Warwick they thought were
less happy than they were (2a), less right-wing (2b), shorter (2c) and lighter (2d). For
asked to consider the mobile phone brand listed in round 1 and asked what percentage
of students at Warwick they thought also used the same brand of mobile phone as their
main mobile phone. For (2f) they were asked to consider the hypothetical restaurant
choice and report what percentage of their fellow Warwick students they thought chose the same answer that they did (they were reminded of the entirety of the question and
the possible answers).
In round 3 they were asked to report the average height for someone in the 10%
tallest Warwick students of their gender (3a), the average weight for someone who is
in the 10% heaviest Warwick students of their gender (3b), the average happiness for
someone who is in the 10% happiest students at Warwick (3c), and the average political
belief for someone who is in the 10% most right-wing students at Warwick (3d). For (3c)
and (3d) they were asked to use a 7-point Likert scale as before.10
Round 4 was phrased identically to round 3 except that in each case in the four questions they were asked to report the average for the 10% shortest (4a), 10% lightest
(4b), 10% most sad (4c) and 10% most left-wing (4d), again for the population of students
at Warwick, using a 7-point Likert scale for (4c) and (4d), and considering only their
own gender for (4a) and (4b).
Round 5 focussed on averages rather than extremes in the distribution. They were
asked to report the average height (5a) and weight (5b) for a Warwick student of their
gender, and using a 7-point Likert scale the average happiness (5c) and political belief
(5d) for a Warwick student. In question (5e) they were asked to estimate the percentage
of their fellow Warwick students who used each of a selection of mobile phone brands. They were presented with a tabulated list of the most popular brands in the UK, and
they were informed that the list was presented in alphabetical order (except for the
“other” category which was presented last). They were asked to include an entry for
every brand (including “other”). For (5f) they were asked again about the hypothetical
restaurant choice: “Think again about the restaurant question you were asked earlier in
the session. To remind you, you had to decide between two restaurants in which to have
dinner alone. They were called restaurant A and B. You had some private information
that A is better, but you knew that an equally well-informed colleague had information
suggesting that B was better. What percentage of your fellow Warwick students do you
10Notice that some characteristics are well-ordered, such as height and weight, while others are not,
think would have chosen to eat at restaurant A if they were asked the same question?
Remember that the other options were indifferent and B.”
For round 6 the participants were asked to answer a single question designed as
a check on their ability to understand and manipulate expectations and probability: “Consider the following gamble. You have a 20% chance of winning£100, a 40% chance
of winning £10 and a 40% chance of winning £0. If you played this gamble many times
what would you expect to be your average winnings per gamble? (in pounds)”
Round 7 was a final questionnaire and, as is conventional, was not incentivized
(par-ticipants were informed that the incentivized part of the experiment had ended) since
there was no way of checking right or wrong answers. They were asked to report their
age (7a), nationality (7b), degree subject (7c), whether they studied mathematics up to
their final year at school (7d) and also comment on their methods, if any, during the
incentivized parts of the experiment (7e).
As mentioned previously it was impossible for participants to return to earlier rounds
to change their answers, and the nature of rounds was only revealed when those rounds
began. Both measures were important in preventing strategic answers to the round 1
questions as discussed in footnote 8.
2.2
Population Averages
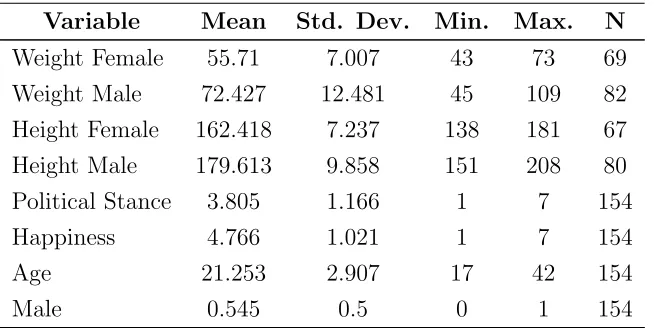
[image:10.612.151.479.519.683.2]We present the main variables in table 1 below.
Table 1: Main Variables
Variable Mean Std. Dev. Min. Max. N
Weight Female 55.71 7.007 43 73 69
Weight Male 72.427 12.481 45 109 82
Height Female 162.418 7.237 138 181 67
Height Male 179.613 9.858 151 208 80
Political Stance 3.805 1.166 1 7 154
Happiness 4.766 1.021 1 7 154
Age 21.253 2.907 17 42 154
The variable “Happiness” is coded from completely sad (1) to completely happy (7)
and taken from the answers to question (1d), and “Political Stance”, from extreme left
(1) to extreme right (7), taken from question (1e). “Weight” is converted to kg from
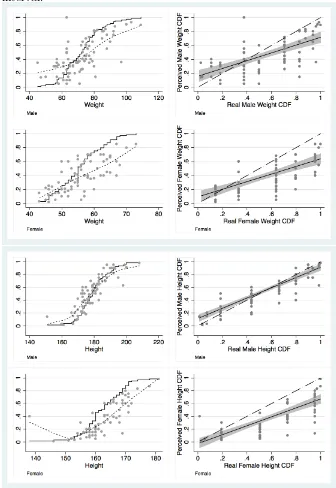
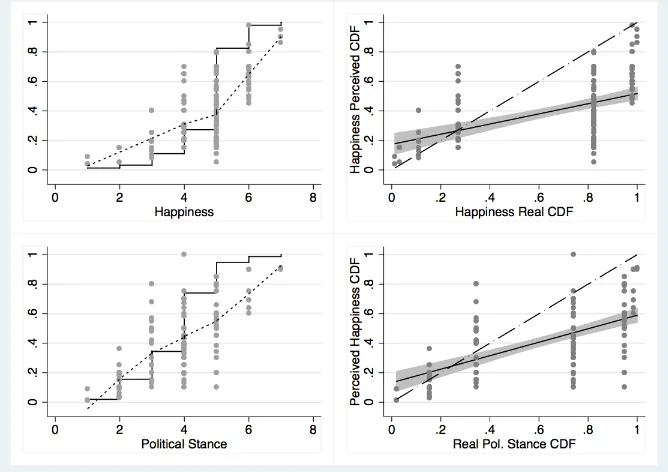
the answers in question (1c) and “Height” to cm from the answers in question (1b). We present the CDF of the 4 above variables in figures 1 and 2. 11 The average answer to
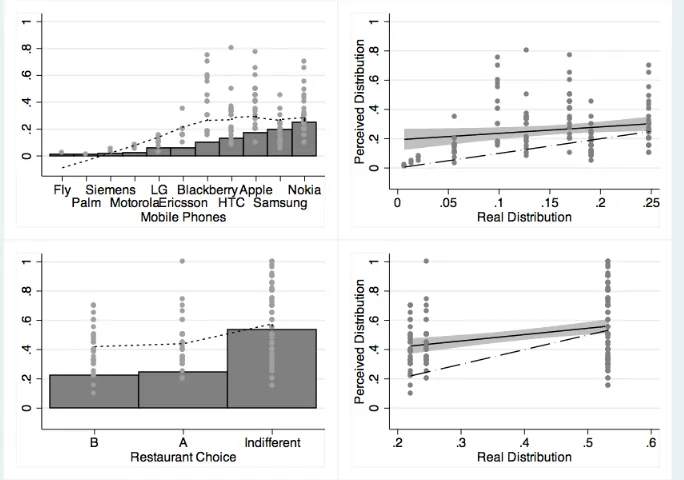
the restaurant choice question (1g) and the mobile choice question (1f) can be read from
the histogram in figure 3.
3
Perceived and Real Distributions
In this section we determine the perceived distributions and compare them with the
true distributions. We asked each participant to report a value x for any of the above mentioned variables (weight, height, happiness and political stance) and then to report
the percentage of individuals with a value less than x. Concerning the choice variables
(mobile phone choice and hypothetical restaurant choice) we asked participants to report
the percentage of individuals who made the same choice. Therefore, for the first group
of variable we will compare a perceived and a real CDF, for the choice variable we will
compare a perceived and a real simple frequencies distributions.
In figure 1 we can compare the real and the perceived CDFs for height and weight,
and in figure 2 the real and perceived CDFs for political stance and happiness. Note
that individuals at the tail of the distribution tend to overestimate the preponderance of those who are like themselves. While individuals more close to the average tend to
correctly estimate their position in the distribution. This is early evidence of a strong
false consensus effect.
Similarly, in figure 3 we can compare the histogram representing the distribution on
mobile phones and attitudes toward how information is processed in the hypothetical
restaurant choice with the perceived distribution.
We note a similar pattern in figures 1 and 2. Individuals who own a less common
mobile phone brand seem to perceive their brand as more popular than it is, while
indi-viduals with the most popular brand tend to correctly estimate its popularity. Similarly, individuals who select “A” or “B” in the hypothetical restaurant choice question seem to
think that their choice is more common than is the case, while individuals who express
11When calculating the population averages we also used the 120 data from the pilot experiment to
indifference, who represent the majority, correctly estimate the share of indifferent.
In essence our subjects think there are more individuals in the same position (or
indeed in a more extreme position) than themselves. So, a very tall person really does
perceive the world as taller. Perhaps more economically significant, someone who has purchased a minority mobile phone believes it to be more popular than is the case. One
remarkable point that stands out is the ubiquitous nature of this bias: only for female
heights is there any deviation from the simple rule that those at extremes do not see
themselves as being as extreme as is the case.12
In particular the solid lines of each the right panel of figures 1, 2 and 3 represent the
interpolating line of the following regression:
ˆ
pci =αc+βcpci + c
i; (1)
where ˆpc
i is the perceived share of individuals with characteristics less than her own (or in the case of the choice variables, exactly equal to her own), andpc
i is the true value in our sample. Given that individuals have an incentive to declare the true value provided
by the incentives within the experiment, they can be seen as affected by a systematic
bias in perception to the extent that the interpolating line of regression 1 is different
from the 45 degree line (the 45 degree line is represented by a dotted line in each of
the right panel of figures 1, 2 and 3). It is important to stress that, although the right panels of figures 1 and 2 seem different to the ones in figure 3, they unveil a qualitatively
similar bias: in both cases less representative individuals perceive themselves as more
representative, while average individuals on average correctly estimate their position.
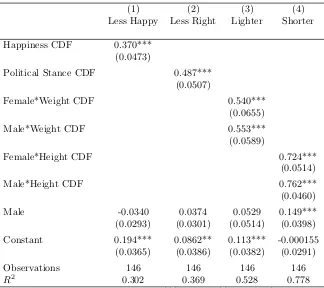
Equivalently, looking at tables 2 and 3, we present the results of regression 1 for
each characteristic or choice. The closer is βc to 0, and the larger is αc, the more do
extreme individuals think they are over-represented in the real distribution. From table
2 and 3 we note that βc < 1 and αc > 0 so extreme types really do see themselves as
over-represented in the population.
12For female heights we find that shorter females seem quite aware that they are short though taller
Table 2: Determinant of the Perceived distributions of Height, Weight, Hap-piness, Political Stance Seemingly Unrelated Regressions
(1) (2) (3) (4)
Less Happy Less Right Lighter Shorter
Happiness CDF 0.370***
(0.0473)
Political Stance CDF 0.487***
(0.0507)
Female*Weight CDF 0.540***
(0.0655)
Male*Weight CDF 0.553***
(0.0589)
Female*Height CDF 0.724***
(0.0514)
Male*Height CDF 0.762***
(0.0460)
Male -0.0340 0.0374 0.0529 0.149***
(0.0293) (0.0301) (0.0514) (0.0398)
Constant 0.194*** 0.0862** 0.113*** -0.000155
(0.0365) (0.0386) (0.0382) (0.0291)
Observations 146 146 146 146
R2 0.302 0.369 0.528 0.778
Standard errors in parentheses. *** p<0.01, ** p<0.05, * p<0.1
Table 3: Determinant of the Perceived distributions of Mobile and Restaurant
ChoicesSeemingly Unrelated Regressions
(1) (2)
Mobile Brand Restaurant Choice
Mobile Phones Distribution 0.434**
(0.202)
Restaurant Choice Distribution 0.521***
(0.111)
Constant 0.194*** 0.298***
(0.0353) (0.0466)
Observations 141 141
R2 0.032 0.134
[image:16.612.157.474.539.687.2]4
The Salience effect
One possibility is that the bias in perception is a spurious effect due to the fact that
extreme positions are often more salient. We might (reasonably) argue that extremists
are more vocal in society or simply stand-out, and hence are more salient in memory.
On that basis saliency would suggest that not only do individuals at the tail-end of
distributions perceive themselves as more common, but everyone along the distribution
would also perceive extreme types to be more common than is the case. This is another
departure from rational expectations, but we are interested in disentangling this effect
from false consensus because the policy implications are quite different.
In order to assess this possibility, for happiness, political stance, weight and height,
we asked our participants to report the average of the top 10% the averages of the bottom 10% together with the total average of each distribution for the population of
students at Warwick University. In short we elicited perceptions across the entirety of
the distribution.13
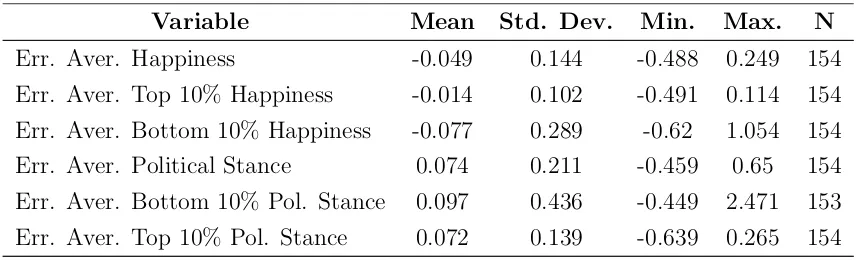
Table 4 presents the errors between perceived averages for happiness and political
stance; tables 5 and 6 present the same errors for weigh and height for female and
male subjects respectively. Regressions in tables 7 and 8 show the correlations between
characteristics and errors. If the constant with respect to the errors in estimating the
bottom and top 10% averages is significant this is evidence of a salience effect, if the errors
[image:17.612.98.526.540.670.2]are positively correlated with the characteristics then this is evidence of false consensus.
Table 4: Errors when Estimating the Averages of
Happi-ness and Political Stance in the Population
Variable Mean Std. Dev. Min. Max. N
Err. Aver. Happiness -0.049 0.144 -0.488 0.249 154
Err. Aver. Top 10% Happiness -0.014 0.102 -0.491 0.114 154
Err. Aver. Bottom 10% Happiness -0.077 0.289 -0.62 1.054 154
Err. Aver. Political Stance 0.074 0.211 -0.459 0.65 154
Err. Aver. Bottom 10% Pol. Stance 0.097 0.436 -0.449 2.471 153
Err. Aver. Top 10% Pol. Stance 0.072 0.139 -0.639 0.265 154
13Notice that simply averaging out the reports could give rise to the idea that perceptions are balanced
Table 5: Errors when Estimating the Averages of Weight
and Height in the Population, Female Subsample
Variable Mean Std. Dev. Min. Max. N
Err. Aver. Weight 0.004 0.078 -0.158 0.193 70
Err. Aver. Bottom 10% Weight -0.015 0.103 -0.224 0.22 70
Err. Aver. Top 10% Weight 0.077 0.161 -0.202 0.556 70
Err. Aver. Height 0.009 0.022 -0.066 0.068 70
Err. Aver. Bottom 10% Height -0.015 0.053 -0.192 0.093 70
Err. Aver. Top 10% Height 0.006 0.034 -0.066 0.121 69
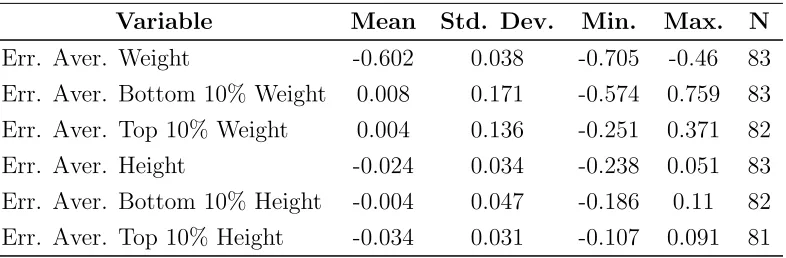
Table 6: Errors when Estimating the Averages of Weight
and Height in the Population, Male Subsample
Variable Mean Std. Dev. Min. Max. N
Err. Aver. Weight -0.602 0.038 -0.705 -0.46 83
Err. Aver. Bottom 10% Weight 0.008 0.171 -0.574 0.759 83
Err. Aver. Top 10% Weight 0.004 0.136 -0.251 0.371 82
Err. Aver. Height -0.024 0.034 -0.238 0.051 83
Err. Aver. Bottom 10% Height -0.004 0.047 -0.186 0.11 82
Err. Aver. Top 10% Height -0.034 0.031 -0.107 0.091 81
For political stance, there is no evidence of a salience effect in force when considering
perceptions of those who are “left wing”: the constant in the regression against errors
for the 10% most left is largely insignificant. For the “right wing” types there is a
significant salience effect and no false consensus. Throughout table 7, we note that errors
in perceived happiness are correlated with own-happiness levels, so happier individuals
[image:18.612.119.512.420.549.2]From table 8 we seem to confirm the existence of false consensus in weight (for
both males and females) and for male height. The only exception, female height, is
not correlated with the corresponding errors and this seems to be due to an interesting
anomaly whereby shorter females seem more aware of their place in the distribution than is the case across all of the other characteristics and choices we examine.
In general we can rule out the existence of a confounding salience effect for all our
variable apart from political stance and even then only for those at the “right-wing”
of the political spectrum. Even here it seems as though false consensus is also present,
though coexisting with salience.
5
The Economic and Psychological Underpinnings
of “False Consensus”.
Our findings have identified a powerful “false consensus effect” and allowed us to control
for the confounding effect of saliency. The notion of “false consensus” has strong links to
other related behavioral research which might point to the reason why a “false consensus”
can emerge.
A possible explanation for false consensus might be due to the availability heuristic
identified by Tversky and Kahneman (1973), according to which individuals put undue
weight on easily available data, and may then draw biased inferences. However, the fact that false consensus applies also when information is freely available seems to rule out
the possibility that availability is the only determinant of false consensus. In effect, our
participants have access to significant, free and easily available information about the
heights and weight of their peers, but still seem to suffer from biased perceptions.
Our results do support recent theoretical work on the ability of individuals to delude
themselves into taking on incorrect beliefs which are self-beneficial (Benabou and Tirole,
2002): in particular we might think that a significant purchasing decision (buying a
mobile phone for example) or view concerning a key characteristic (your height, weight
or political view perhaps) it would be beneficial for an economic agent to believe she is
closer to the average than might be the case.
The bias we observe in our participants may also be related to overconfidence (i.e.
participants may feel that individuals are more similar to themselves than is the case,
thinking of themselves as overly representative) in this sense our work is related to
induced by the desire to send positive signals to others about oneself.
The questions we ask of our participants relate to beliefs and information. A key
as-sumption in information economics is that agents will acquire information when it makes
sense to do so. Observing others is one of the cheapest ways to acquire information and is the key form of learning in the social learning and herding literatures (see Banerjee,
1992, and Bikhchandani, Hirshleifer and Welch, 1992). “False consensus” can be
gener-ated through the fact that individuals associate with and observe those who are similar
to themselves. In this sense our findings support the notion of assortative matching
(fol-lowing Becker, 1973) and the related sociological notion of homophily (see for instance,
McPherson, Smith-Lovin and Cook, 2001), the later being increasingly referred to within
the economics of social networks (see Currarini, Jackson and Pin (2009) and Golub and
Jackson (2011) for recent contributions and Jackson (2010) for a survey).
There is also a link between our work and the work of Loewenstein, O’Donoghue and Rabin (2003) who argue that people exaggerate the degree to which their future
tastes resemble their current tastes and provide a number of applications to economics
stemming from this bias. To some extent our result mirrors this finding if we consider an
individual’s future self to be another individual and then the false consensus bias takes
hold. This is also reminiscent of the large literature on playing games with your future
selves or dynamic inconsistency (see Frederick et al., 2002). The bias we identify may
also be linked to a broad notion of projection bias in the Freudian tradition.14
Our findings also lend some support to Weber’s Law which might suggest the
inter-pretation of the uni-dimensional scale as de facto logarithmic when participants evaluate their position relative to their peers (see Kahneman and Deaton (2010) for a discussion of
this point). A recent empirical paper related in terms of methodology to ours is Oswald
(2008), based on individuals’ perceived and real height and showing that individuals’
reporting function from reality to feelings is concave.
6
Final Remarks about Policy Implications
We will conclude by considering what lessons come from our findings for economics and policy-makers. We would warn policy-makers and survey-designers that the assumption
14This is distinct from the notion of projection bias discussed by Loewenstein, O’Donoghue and Rabin
that beliefs are on average correct seems woefully inadequate in any context where a false
consensus may emerge and our findings indicate that such a context may be far more
wide-ranging than has hitherto been considered. Similarly, economics typically has, at its
core, the belief that economic agents are fully aware of the distribution that corresponds to an unbiased distribution surrounding the truth. This may even be a requirement for
certain core theories to hold. Take for example the centre-piece of auction theory, the
revenue equivalence theorem, which requires that bidders know the true distributions of
valuations. The bias identified in this paper would suggest otherwise: bidders are likely
to think that other’s valuations are more highly correlated with their own than is justified
by the truth. The ramifications of such a bias for any policy decision or economic model
is considerable: with biases across such a wide range of characteristics and choices, it is
easy to see how policies could go badly wrong or models become mis-specified.
Returning to the very start of the introduction, we discussed the important contribu-tion by Manski (2004) in which he highlights how departures from racontribu-tional expectacontribu-tions
can leave economists in some difficulty when seeking to identify the correct model through
revealed preference. The bias identified in this paper represents such a departure and
the ubiquitous nature of our findings suggests that in many behavioral or choice contexts
the false consensus bias may be playing a role in forming expectations. It is therefore
difficult to know whether any decision is taken through an erroneous belief in consensus
or through the reasonable use of private information or preferences. On that basis it is
hard to draw conclusions concerning which model is correct from choices when the choices
themselves may have come from more than one competing model and the paradigm of revealed preference becomes suspect.
To be more specific, consider the example of the ultimatum game used by Manski. In
the game the sharing rule is determined by the proposer’s expectations concerning the
respondent’s behavior. Manski shows that if one departs from the assumption that the
objective probabilities of the respondent’s behavior are known, data cannot identify a
single model for play in the game. The false consensus bias plays a similar confounding
role since it is plausible that the proposer forms his expectation on the basis of his
perception of the distribution of preference for fairness among the group from which the
respondent has been drawn.
In short, for important policy decisions or even in the development of new economic
theory it makes sense to think about whether biased beliefs will render a model inaccurate
or a policy counter-productive, and if so, it makes further sense to think about how to
make greater use of subjective probabilities in survey-based work and our findings lend
strong empirical support to that recommendation.
The apocryphal Marie Antoinette quote given at the start of this paper and the similar
“Why don’t they eat meat?” attributed to an “ancient Chinese emperor” (Titelman, 1996) leaves the reader astonished by the apparent inability of those at the very top of
the wealth distribution to empathize with the common man. While such stories may have
been the staple of pro-revolutionary French historians, and are undoubtedly designed to
incite and to anger, in the light of the findings within this paper they also conjure up
a more abstract notion of an individual who might have some difficulty visualizing the
population at large as anything more than a reflection of the characteristics, choices and
attitudes of themselves. While the obliviousness apparent in the quote is undoubtedly
extreme, it exemplifies the role of “false consensus” which is so prominent in the findings
of this paper.
References
[1] Banerjee, A. V. (1992). “A Simple Model of Herd Behavior”, Quarterly Journal of
Economics 107: 797-817.
[2] Becker, G. S. (1973). “A theory of marriage: part I”, Journal of Political Economy
81: 813-46.
[3] Benabou, R., and Tirole, J. (2002). “Self-confidence and personal motivation.”
Quarterly Journal of Economics 117: 871-915.
[4] Bikhchandani, S., Hirshleifer, D., and Welch, I. (1992). “A Theory of Fads,
Fash-ion, Custom and Cultural Change as Information Cascades”, Journal of Political Economy 100: 992-1026.
[5] Burks, S., Carpenter, J., Goette, L., and Rustichini, A. (2010). “Overconfidence is
a social signaling bias.” Mimeo, University of Minnesota.
[6] Currarini, S., Jackson, M. O., and Pin, P. (2009). “An Economic Model of
Friend-ship: Homophily, Minorities and Segregation.” Econometrica 77, 1003-10045.
[7] Engelmann, D., and Strobel, M. (2000). “The False Consensus Effect Disappears
if Representative Information and Monetary Incentives Are Given”, Experimental
[8] Golub, B., and Jackson, M. (2011). “Network Structure and the Speed of
Learn-ing: Measuring Homophily Based on its Consequences”, Annals of Economics and
Statistics, Forthcoming.
[9] Jackson, M. O. (2010). “An Overview of Social Networks and Economic
Applica-tions.”, in Hand- book of Social Economics, edited by Benhabib, J., Bisin, A. and
Jackson, M. O.
[10] Manski, C. (2004). “Measuring Expectations.” Econometrica 72, 13291376.
[11] McPherson, M., Smith-Lovin, L., and Cook, J. (2001). “Birds of a feather:
Ho-mophily in social networks.” Annual Review of Sociology 27, 415-44.
[12] Mullen, B., Atkins, J.L., Champion, D.S., Edwards, C., Hardy, D., Story, J.E.,
and Venderklok, M. (1985). “The False Consensus Effect: A Meta-Analysis of 115 Hypothesis Tests.” Journal of Experimental SociaI Psychology 21,263-283.
[13] Loewenstein, G., O’Donoghue, T., and Rabin, M. (2003). “Projection Bias in
Pre-dicting Future Utility.” Quarterly Journal of Economics 118, 1209-1248.
[14] Oswald, A. (2008). “On the Curvature of the Reporting Function from Objective
Reality to Subjective Feelings.” Economics Letters 100, 369-372.
[15] Ross, L., Greene, D., and House, P. (1977). “The ’False Consensus Effect’: An
Egocentric Bias in Social Perception and Attribution Processes.”Journal of Exper-imental Social Psychology 13, 279-301.
[16] Titelman, G. Y. (1996) “Dictionary of Popular Proverbs and Sayings”, Random
House USA Inc.
[17] Tversky, A., and Kahneman, D. (1973). “Availability: A heuristic for judging
Supplementary Information: Full Experimental
In-structions
The Supplementary Information presents the on-screen instructions and questions for
the entire experiment in the precise order observed by participants. The “session ID”
box was automatically completed based on their initial login credentials. The questions
marked with a “*” indicate required questions. Once they had answered each required
question they could then proceed by hitting the “submit answers” button at the bottom
of each web-page. After round 7 they were taken to a final page where they were asked
to wait patiently until their fellow participants had finished before receiving payment.
ROUND 1
ID ENTRY Session ID:*
All of your answers will be entirely anonymous. You have been allocated a Session ID
and password, for example your ID might be “48576” or “60306”. This ID and password
are unique to you and will help us link the data you enter across several forms. However
both the session ID and password are entirely anonymous and cannot be used to
deter-mine your personal identity or university ID.
ROUND 1 QUESTIONS
Please answer all of the following questions to the best of your ability and please scroll down through all of the questions until you reach the “SUBMIT ANSWERS” button.
What is your gender?
Your answer:*
What is your height?
The menu includes heights measured metric and imperial measures, so you can choose
the units with which you are most comfortable.
Your answer:*
What is your weight at the moment?
the units with which you are most comfortable.
Your answer:*
How would you rate your happiness at the moment?
Please use a 7-point scale where 1 is completely sad, 2 is very sad, 3 is fairly sad, 4 is
neither happy nor sad, 5 is fairly happy, 6 is very happy and 7 is completely happy.
Your answer:*
How would you rate your political beliefs at the moment?
Please use a 7-point scale where 1 is far left, 2 is left, 3 is centre left, 4 is centre, 5 is
centre right, 6 is right and 7 is far right.
Your answer:*
What is your current brand of mobile phone? If you have more than one enter the
one that you use most often.
Your answer:*
Imagine that you have to decide between two restaurants in which to have dinner alone.
They are called restaurant A and B. You have some private information that A is better,
but you know that an equally well-informed colleague has information suggesting that
B is better. Would you choose to eat at A, B or are you indifferent?
Your answer:*
END OF ROUND 1
Privacy statement
REMINDER: All of your answers today will be entirely anonymous. No data which
personally identifies you is collected on the form. Your answers will only be linked to
your session ID and not to your personal identity or your university ID. When you are
ready to submit your answers please hit the ”SUBMIT ANSWERS” button below.
ROUND 2
ID ENTRY
Session ID:*
All of your answers will be entirely anonymous. You have been allocated a Session ID
and password, for example your ID might be “48576” or “60306”. This ID and password
are unique to you and will help us link the data you enter across several forms. However
both the session ID and password are entirely anonymous and cannot be used to
deter-mine your personal identity or university ID.
VERY IMPORTANT - BONUS PAYMENT EXPLANATION - PLEASE READ!
You will receive a certain £2.50 for showing-up but by answering the next few questions
you have the chance to win a bonus. One of the questions on this page and the ones
to follow will be chosen at random and secretely allocated to be the “prize question”.
If your answer is within 10% of the correct answer to the prize question you will win a
bonus payment of£5.
ROUND 2 QUESTIONS
Please answer all of the following questions to the best of your ability as one of these may be the ”prize question” and please scroll down through all of the questions until
you reach the ”SUBMIT ANSWERS” button.
What percentage of students at Warwick do you think are less happy than you are?
Your answer:*
What percentage of students at Warwick do you think are less right-wing than you?
Your answer:*
What percentage of students at Warwick of your gender do you think are shorter than
you?
Your answer:*
What percentage of students at Warwick of your gender do you think are lighter than
you?
Think again about the mobile phone brand you listed in the last round. What
per-centage of students at Warwick do you think also use the same brand of mobile phone
as their main mobile phone? Your answer:*
Think again about the restaurant question in the last round. To remind you, you had to
decide between two restaurants in which to have dinner alone. They were called
restau-rant A and B. You had some private information that A is better, but you knew that an
equally well-informed colleague had information suggesting that B was better.
What percentage of your fellow Warwick students do you think would have chosen the
same answer as you? Remember that the options were “indifferent”, “A” or “B”.
Your answer:*
END OF ROUND 2
Privacy statement
REMINDER: All of your answers today will be entirely anonymous. No data which
personally identifies you is collected on the form. Your answers will only be linked to
your session ID and not to your personal identity or your university ID. When you are
ready to submit your answers please hit the “SUBMIT ANSWERS” button below.
(SUBMIT ANSWERS BUTTON)
ROUND 3
ID ENTRY Session ID:*
All of your answers will be entirely anonymous. You have been allocated a Session ID
and password, for example your ID might be “48576” or “60306”. This ID and password
are unique to you and will help us link the data you enter across several forms. However
both the session ID and password are entirely anonymous and cannot be used to
deter-mine your personal identity or university ID.
ROUND 3 QUESTIONS
may be the ”prize question” and please scroll down through all of the questions until
you reach the “SUBMIT ANSWERS” button.
What do you think is the average height for someone who is in the 10% tallest War-wick students of your gender?
Your answer:*
What do you think is the average weight for someone who is in the 10% heaviest Warwick
students of your gender?
Your answer:*
What do you think is the average happiness for someone who is in the 10% happiest
students at Warwick?
Please use a 7-point scale where 1 is completely sad, 2 is very sad, 3 is fairly sad, 4 is
neither happy nor sad, 5 is fairly happy, 6 is very happy and 7 is completely happy.
Your answer:*
What do you think is the average political belief for someone who is in the 10% most
right-wing students at Warwick?
Please use a 7-point scale where 1 is far left, 2 is left, 3 is centre left, 4 is centre, 5 is
centre right, 6 is right and 7 is far right.
Your answer:*
END OF ROUND 3
Privacy statement
REMINDER: All of your answers today will be entirely anonymous. No data which
personally identifies you is collected on the form. Your answers will only be linked to
your session ID and not to your personal identity or your university ID. When you are
ready to submit your answers please hit the “SUBMIT ANSWERS” button below.
ROUND 4
ID ENTRY
Session ID:*
All of your answers will be entirely anonymous. You have been allocated a Session ID
and password, for example your ID might be “48576” or “60306”. This ID and password
are unique to you and will help us link the data you enter across several forms. However
both the session ID and password are entirely anonymous and cannot be used to
deter-mine your personal identity or university ID.
ROUND 4 QUESTIONS
Please answer all of the following questions to the best of your ability as one of these
may be the “prize question” and please scroll down through all of the questions until
you reach the “SUBMIT ANSWERS” button.
What do you think is the average height for someone who is in the 10% shortest Warwick
students of your gender?
Your answer:*
What do you think is the average weight for someone who is in the 10% lightest Warwick
students of your gender?
Your answer:*
What do you think is the average happiness for someone who is in the 10% most sad at
Warwick?
Please use a 7-point scale where 1 is completely sad, 2 is very sad, 3 is fairly sad, 4 is
neither happy nor sad, 5 is fairly happy, 6 is very happy and 7 is completely happy.
Your answer:*
What do you think is the average political belief for someone who is in the 10% most
left-wing students at Warwick? Please use a 7-point scale where 1 is far left, 2 is left, 3
is centre left, 4 is centre, 5 is centre right, 6 is right and 7 is far right.
Your answer:*
Privacy statement
REMINDER: All of your answers today will be entirely anonymous. No data which
personally identifies you is collected on the form. Your answers will only be linked to your session ID and not to your personal identity or your university ID. When you are
ready to submit your answers please hit the “SUBMIT ANSWERS” button below.
(SUBMIT ANSWERS BUTTON)
ROUND 5
ID ENTRY
Session ID:*
All of your answers will be entirely anonymous. You have been allocated a Session ID
and password, for example your ID might be “48576” or “60306”. This ID and password
are unique to you and will help us link the data you enter across several forms. However
both the session ID and password are entirely anonymous and cannot be used to deter-mine your personal identity or university ID.
ROUND 5 QUESTIONS
Please answer all of the following questions to the best of your ability as one of these
may be the prize question and please scroll down through all of the questions until you
reach the SUBMIT ANSWERS button.
What do you think is the average height for a Warwick student of your gender?
The menu includes heights measured metric and imperial measures, so you can choose
the units with which you are most comfortable. Your answer:*
What do you think is the average weight for a Warwick student of your gender?
The menu includes weights measured metric and imperial measures, so you can choose
the units with which you are most comfortable.
Your answer:*
What do you think is the average happiness at the moment for a Warwick student?
neither happy nor sad, 5 is fairly happy, 6 is very happy and 7 is completely happy.
Your answer:*
What do you think is the average political belief for a Warwick student?
Please use a 7-point scale where 1 is far left, 2 is left, 3 is centre left, 4 is centre, 5 is
centre right, 6 is right and 7 is far right.
Your answer:*
Please estimate the percentage of your fellow Warwick students who use each of the
following mobile phone brands as their primary mobile phone.
Note that the list is in alphabetical order (except for the “other” category) and you
should insert an entry for each brand (including “other”).
Note concerning payment: if this question is the one that is randomly chosen to be
the payment question then a single brand will be chosen randomly and if you are within
15% of the correct answer you will receive the £5 bonus payment.
(Participants were then presented with a list of mobile phone brands in the
follow-ing order: Apple Iphone, Blackbery, HTC, LG, Motorola, Nokia, Samsung, Siemens,
Sony-Ericson, Other. For each one they were asked to select from a list of 5% intervals,
beginning 0 to 5% and ending with 95 to 100%˙)
Think again about the restaurant question you were asked earlier in the session. To
remind you, you had to decide between two restaurants in which to have dinner alone.
They were called restaurant A and B. You had some private information that A is better,
but you knew that an equally well-informed colleague had information suggesting that
B was better.
What percentage of your fellow Warwick students do you think would have chosen to eat
at restaurant A if they were asked the same question? Remember that the other options were indifferent and B.
Your answer:*
REMINDER: All of your answers today will be entirely anonymous. No data which
personally identifies you is collected on the form. Your answers will only be linked to
your session ID and not to your personal identity or your university ID. When you are
ready to submit your answers please hit the “SUBMIT ANSWERS” button below. (SUBMIT ANSWERS BUTTON)
ROUND 6
ID ENTRY
Session ID:*
All of your answers will be entirely anonymous. You have been allocated a Session ID
and password, for example your ID might be “48576” or “60306”. This ID and password
are unique to you and will help us link the data you enter across several forms. However
both the session ID and password are entirely anonymous and cannot be used to
deter-mine your personal identity or university ID.
ROUND 6 QUESTION
Please answer the following question to the best of your ability as it may be the “prize
question” and please scroll down until you reach the SUBMIT ANSWERS button.
Consider the following gamble. You have a 20% chance of winning £100, a 40% chance
of winning £10 and a 40% chance of winning £0. If you played this gamble many times
what would you expect to be your average winnings per gamble? (in pounds)
Your answer:*
END OF ROUND 6
Privacy statement
REMINDER: All of your answers today will be entirely anonymous. No data which
personally identifies you is collected on the form. Your answers will only be linked to
your session ID and not to your personal identity or your university ID. When you are
ready to submit your answers please hit the “SUBMIT ANSWERS” button below.
ROUND 7
ID ENTRY
Session ID:*
All of your answers will be entirely anonymous. You have been allocated a Session ID
and password, for example your ID might be “48576” or “60306”. This ID and password
are unique to you and will help us link the data you enter across several forms. However
both the session ID and password are entirely anonymous and cannot be used to
deter-mine your personal identity or university ID.
ROUND 7 QUESTIONS
This is the final round. Please answer the questions to the best of your ability and please
scroll down through all of the questions until you reach the “SUBMIT ANSWERS”
but-ton. Note that none of the following questions are possible “prize questions”.
What is your age? (in years)
Your answer:*
What is your nationality? Your answer:*
What is your degree subject?
Your answer:*
Did you study maths up to and including your final year at school? (e.g. to A-level
or IB SL or HL?)
Your answer*
Please comment on the methods you used (if any) during the rounds when you had
the opportunity to win bonus payments.
Your answer:
END OF ROUND 7
REMINDER: All of your answers today will be entirely anonymous. No data which
personally identifies you is collected on the form. Your answers will only be linked to
your session ID and not to your personal identity or your university ID. When you are