http://wrap.warwick.ac.uk/
Original citation:Ghaffari, R., et al. (2011). The analysis of plant’s organic volatiles compounds with electronic nose and pattern recognition techniques. In: Qahwaji, R., Green, R.J. and Hines, E.L. (eds). Applied Signal and Image Processing: Multidisciplinary
Advancements. Hershey, PA, U.S.A., IGI Global, pp. 115 - 126.
Permanent WRAP url:
http://wrap.warwick.ac.uk/42722
Copyright and reuse:
The Warwick Research Archive Portal (WRAP) makes this work of researchers of the University of Warwick available open access under the following conditions. Copyright © and all moral rights to the version of the paper presented here belong to the individual author(s) and/or other copyright owners. To the extent reasonable and practicable the material made available in WRAP has been checked for eligibility before being made available.
Copies of full items can be used for personal research or study, educational, or not-for-profit purposes without prior permission or charge. Provided that the authors, title and full bibliographic details are credited, a hyperlink and/or URL is given for the original metadata page and the content is not changed in any way.
Publishers statement:
Reproduced with kind permission from IGI Global Publishers Ltd.
http://dx.doi.org/10.4018/978-1-60960-477-6.ch007
A note on versions:
The version presented in WRAP is the published version or, version of record, and may be cited as it appears here.
Applied Signal and
Image Processing:
Multidisciplinary
Advancements
Rami Qahwaji
University of Bradford, UK
Roger Green
University of Warwick, UK
Evor Hines
Senior Editorial Director: Kristin Klinger Director of Book Publications: Julia Mosemann Editorial Director: Lindsay Johnston Acquisitions Editor: Erika Carter Development Editor: Joel Gamon
Production Coordinator: Jamie Snavely
Typesetters: Keith Glazewski & Natalie Pronio Cover Design: Nick Newcomer
Published in the United States of America by
Information Science Reference (an imprint of IGI Global) 701 E. Chocolate Avenue
Hershey PA 17033 Tel: 717-533-8845 Fax: 717-533-8661 E-mail: [email protected] Web site: http://www.igi-global.com
Copyright © 2011 by IGI Global. All rights reserved. No part of this publication may be reproduced, stored or distributed in any form or by any means, electronic or mechanical, including photocopying, without written permission from the publisher. Product or company names used in this set are for identification purposes only. Inclusion of the names of the products or com-panies does not indicate a claim of ownership by IGI Global of the trademark or registered trademark.
Library of Congress Cataloging-in-Publication Data
Applied signal and image processing : multidisciplinary advancements / Rami Qahwaji, Roger Green, and Evor Hines, editors.
p. cm.
Includes bibliographical references and index.
Summary: "This book highlights the growing multidisciplinary nature of signal and image processing by focusing on emerging applications and recent advances in well-established fields, covering state-or-the-art applications in both signal and image processing, which include optical communication and sensing, wireless communication management, face recognition and facial imaging, solar imaging and feature detection, fractal analysis, and video processing"-- Provided by publisher.
ISBN 978-1-60960-477-6 (hardcover) -- ISBN 978-1-60960-478-3 (ebook) 1. Image processing. 2. Signal processing. 3. Image analysis. 4. Wireless communication systems. I. Qahwaji, Rami, 1972- II. Green, Roger, 1951- III. Hines, Evor,
TA1637.A69 2011 621.382'2--dc22
2011003448
British Cataloguing in Publication Data
A Cataloguing in Publication record for this book is available from the British Library.
115
Copyright © 2011, IGI Global. Copying or distributing in print or electronic forms without written permission of IGI Global is prohibited.
Chapter 7
DOI: 10.4018/978-1-60960-477-6.ch007
Reza Ghaffari
School of Engineering, University of Warwick, UK
Fu Zhang
School of Engineering, University of Warwick, UK
Daciana Iliescu
School of Engineering, University of Warwick, UK
Evor Hines
School of Engineering, University of Warwick, UK
Mark Leeson
School of Engineering, University of Warwick, UK
Richard Napier
Warwick HRI, University of Warwick, UK
The Analysis of Plant’s Organic
Volatiles Compounds with
Electronic Nose and Pattern
Recognition Techniques
AbsTRACT
116
The Analysis of Plant’s Organic Volatiles Compounds
INTRODUCTION
Engineering systems often comprise a sensory subsystem of one or multiple sensors which col-lect or detect sensory data and produces measure-ment signals. These signals contain a raw data therefore in most cases the direct usage of these sensory signals is impossible, inefficient or even pointless. According to Heijden (2004), this can have several causes:
a. The information in the signals is represented in an inexplicit or ambiguous way making it harder to be recognizable without further processing.
b. The information is often hidden and only available in an encoded form prior to processing.
c. Sensors always produce measurement sig-nals which come with a substantial noise and other complex disturbances therefore needs noise reduction techniques.
This indicates that a sensory signal which has been processed is more precise and more com-plete than information brought forth by empirical knowledge alone (Heijden et al., 2004). For the system to be able to make sensible and accurate decisions, the measurement signals should be used in combination with previous knowledge or pattern. Several techniques and methods have been used to process the measurement signals in order to suppress the noise and disclose the advantageous information required for the task at hand. Pattern Recognition (PR) is one of the most widely used techniques which have been implemented within various engineering systems.
In principal, PR is the scientific discipline whose goal is the classification of objects into categories or classes. These objects can be anything from a simple image, signal or any other type of sensory data, depending on the ap-plication (Theodoridis & Koutroumbas, 2006).
PR techniques have gained their popularity by being the brain behind the recent Handwritten Character Recognition and Speech Recognition tools built in various machines and software such as Navigation and Call Center Systems. They are designed to mainly do complex feature selection, classification or data clustering.
There have been several sub-categories for PR techniques based on their characteristics, learning method and mathematical algorithms. However, PR techniques are normally based on three basic and well-known approaches: (a) Sta-tistical (b) Structural and (c) Neural. Moreover, PR learning methods are often grouped into two more general categories although a combination of both can be used: (1) Supervised learning and (2) Unsupervised learning. Supervised learning is one of the most commonly undertaken analyses of the PR problems in which the learning phase will be adjusted according to a target dataset. In unsupervised learning, however, the classifier will not have any information regarding the subsets (classes or categories) of the sample data.
In PR approach, supervised learning is often associated to classification whereas unsuper-vised learning is mostly used for data clustering purposes. Several mathematical algorithms and optimisation techniques were used previously to enhance the performance of the classic PR methods and customise it for a specific application. The performance of the PR techniques is often rated by their ability in correct classification/clustering of provided training data samples. High process-ing power and memory capabilities of the recent computers allow PR algorithms to analyse the samples in fraction of a second and provide reli-able solution depending on the application.
117
The Analysis of Plant’s Organic Volatiles Compounds
CAsE sTUDY
As mentioned earlier, we will use PR techniques to investigate a dataset acquired by an array of sensors (i.e. Electronic Nose). We will then analyse the sensor responses collected by EN to discriminate the Organic Volatile Compounds (VOCs) released from the healthy and artificially infected tomato plants.
The main purpose of this study is to evaluate and recognize the ability of EN (Bloodhound model ST214, Scensive Technologies Ltd., Normanton, UK) in diagnosing the diseases and subsequently discriminate between healthy plants from the infected one in a timely manner.
Plant’s VOC
Plants naturally release VOCs under normal conditions (Baldwin, 2002), but they also emit a diverse range of VOCs in response to either physical and biotic stress or infection (Holo-painen, 2004). These compounds combat the infection directly, attract natural biological control agents and function as signals to induce indirect defence responses (Kessler, 2001). The VOC profile emitted from plants usually changes in response to environmental and ecological factors, and by examining the change of such profiles a non-destructive means of plant health evaluation could be offered (Kant et al., 2009). Investigat-ing the visual appearance of the plant part (i.e. leaf surface) by image processing techniques (Cameron & Smith, 2009; Parsons et al., 2009) and examining the Volatile Organic Compounds (VOCs) of plant and pathogen (Moalemiyan et al., 2007; Schütz, 1996) are two options which might produce an attractive means of rapid and non-destructive plant diagnosis testing. These need to feed information to knowledge-led decision support software to advise growers of options for intervention and control.
Pests and Diseases
Plant diseases can have several symptoms and may occur in a number of ways but manifest mainly via infections by fungi, virus and bacterial infection (Agrios, 2004). Two very common diseases in tomato plants, powdery mildew and spider mites will be investigated in this study.
Recent reports of powdery mildews invading Europe from other continents emphasises the need for accurate identification of the disease as well as a method to control it in the shortest period of time (Braun, 2009).
Spider mites on the other hand, are the most common mites attacking commercial plants and are considered to be one of the most economically important diseases which threaten the tomato plants. This mite has been reported to be infest-ing over 200 species of plants around the world. A number of vegetable plants such as tomatoes, squash, eggplant and cucumber are subject to spider mite infestations and damage (Helbert, Hodges & Sapp, 2007).
Electronic Nose (EN)
EN is developed to mimic the human olfactory system and was evolved dramatically as differ-ent types of sensor arrays were built in to it to make it suitable for specific odors and applica-tions. EN was introduced in 1982 by Dodd and Persaud from the Warwick Olfaction Research Group, UK and several applications of EN were investigated (Gardner, Hines, & Pang, 1996). The EN technology has been used in a variety of applications, including food and fruit quality measurements (Peris & Escuder-Gilabert, 2009), animal disease diagnosis (Dutta, Morgan, Baker, Gardner, & Hines, 2005), automotive industry (Kalman, Löfvendahl, Winquist, & Lundström, 1999) and plant health monitoring (Baratto, et al., 2005).
118
The Analysis of Plant’s Organic Volatiles Compounds
precision at a potentially low cost. Nowadays, most EN devices have built in PR system or a mean of data processing algorithm (i.e. PCA) which will increase the portability as well as the performance of such devices for diverse range of applications. The EN’s portability, cost of running and simplicity to operate make it an attractive solution compare to other alternatives such as Gas chromatography-mass spectrometry (GC-MS).
Later in this chapter, we will investigate the response of EN sensors and consequently its capacity in classifying plants VOCs.
Experimental setup
In order to replicate the greenhouse environment, we used disinfected clear glass boxes to house one plant each. Three clean glass boxes (150cm * 50cm * 50cm) simulated the greenhouse environment. A control healthy plant was kept healthy through-out the experiment. Humidity and temperature were logged at all times with the interval set at 10 minutes between each reading. Clean air was filtered and pumped into each box to create posi-tive pressure inside the boxes which decreased the possibility of cross contamination between the boxes as well as maintaining environmental parameters constant throughout the experiment. The light system was precisely controlled by a timer to make sure that the plants had 16 hours of artificial daylight. Each plant was watered daily. Prior to sampling, air inflow was switched off for 3 hours to allow volatile concentration around the plants to build up. Individual box tubes were connected to the EN to take readings of volatile concentrations. Sampling tubes kept separated to reduce the possibility of cross contamination. A solution of butan-2-ol (2% in distilled water) was used as a reference sample and also acted as a sensor wash to regenerate sensor surfaces.
A various range of algorithms have been pro-posed by researchers and applied on EN generated dataset such as Principle Component Analysis (PCA), Linear Discriminant Analysis (LDA).
Artificial Neural Network (ANN) techniques such as Multi-Layer Perceptron (MLP), Learning Vector Quantization (LVQ), Radial Basis Function (RBF) and Probabilistic Neural Network (PNN) are also among the favorite analysis algorithms. For clustering purposes, Self-Organizing Map (SOM), K-Means Clustering, Fuzzy C-Mean clustering and Support Vector Machine (SVM) are often employed.
TECHNIQUEs AND
METHODOLOGIEs
Data Pre-Processing
During the experiment, the EN continuously re-corded the responses from its array of 13 sensors and the data was saved as a data matrix. The data comprised of the profile of the VOC determined by the EN at the following time intervals: 7 s ab-sorption, 0 s pause, 20 s desorption and 5 s flush. The key dataset parameters were determined and extracted from the measurements: (a) Divergence (b) Absorption (c) Desorption and (d) Area; thus forming a 52 component (13×4) matrix.
These values later formed the final dataset. Four days within the dataset was selected: 4 days post infection (DPI), 6 DPI, 8 DPI and 9 DPI. All the data processing and analysis were performed in MATLAB® environment and PRTools toolbox was employed for some of the analysis.
These datasets were normalized by subtracting the mean value using Equation 1.
X'=X−X (1)
Each dataset is a matrix of 60 x 52. Next, the four datasets are divided into two sets one for training (60% of data), and the other for validation and testing purposes (40% of data).
119
The Analysis of Plant’s Organic Volatiles Compounds
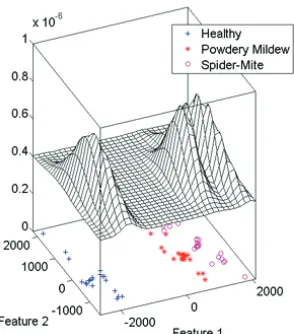
will later enable us to have a better understand-ing of the dataset characteristics. Figure 1 (left) is a graphical representation of the probability densities of the sensory data generated by EN on 6 DPI after normalization. The probability densities exposed are estimates obtained from the pre-processed sensory samples.
In Figure 1 (right) a simple, single-link den-drogram was constructed using hieratical cluster-ing to visualize the possible clusters within the dataset. The dendrogram demonstrates a large gap in distances which indicates that the two feature clusters are far apart from each other. Some minor sub-clusters are also visible within the dataset. Nevertheless, in this case, it is rather complicated to estimate the actual number of clusters from the figures. We can conclude that there are differ-ences within the dataset though. A more intelligent clustering techniques in necessary and will be applied later to reveal the actual number of clus-ters inside the dataset.
Linear and Quadratic
Discriminate Analysis
As a statistical technique, LDA is one of the most widely used classification procedures (Hai &
[image:8.612.329.462.141.306.2]Wang, 2006). The method maximizes the variance between categories and minimizes the variance within categories by means of a data projection from a high dimensional space to a low dimen-sional space (Zhang, 2008; Yongwei, 2009). In other words, LDA simply looks for a sensible rule to discriminate between sample points by forming linear functions of the data maximizing the ratio of the between-group sum of squares to the within-group sum of squares (Zhang, 2007).
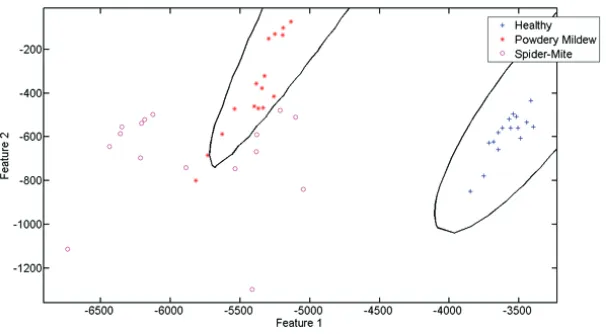
Figure 2 shows two scatter diagram and the linear decision boundaries separating the clusters. The linear discriminant function was able to clas-sify the dataset with 95% success rate. However, the performance enhances when the function em-ployed the lease Square (LS) error classifier. The LS classifier’s performance reached 97% (Figure 2- Right). It is clear that LDA coupled with LS function attempted to adjust the decision boundar-ies so more sample points can be accommodated into the correct classes. However, the classification is still linear and can only show good degree of a classification if the dataset is spreadable.
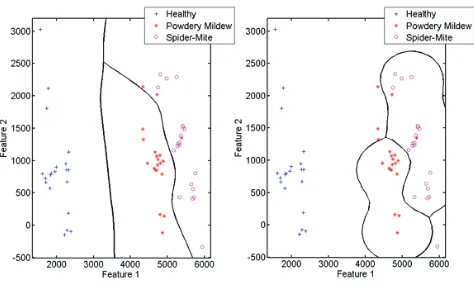
[image:8.612.168.315.145.312.2]To enhance the classification, the same data-set was analysed with Quadratic Discriminant Analysis (QDA). QDA which uses quadratic decision function was added to the classifier to
120
The Analysis of Plant’s Organic Volatiles Compounds
decrease the error rate. QDA was able to cor-rectly classify the data with an excellent 98% success rate. Figure 3 illustrates the Quadratic decision boundaries which is categorizing the classes. Each class represents a status of the plant (i.e. Healthy, Powdery-Mildew infected and Spi-der Mite infested)
Nearest Neighbour Classification
K-nearest neighbor (KNN) is a non-parametric classical classification technique widely used in pattern recognition problems. KNN classifier method is used for performing general, non-parametric classifications (Wu, 2002). KNN as a fast, reliable and flexible method is a popular
approach to perform the classification task in EN enabled applications.
Briefly, in the learning phase of KNN algo-rithms the presented training dataset will be stored until a new instance of k is encountered, then a set of similar training instances is retrieved from memory and used to make a local approxima-tion of the target funcapproxima-tion (García-Laencina, 2009). Subsequently, to classify a new pattern, the Euclidean distance between the new pattern and each pattern in the training set is computed. The Euclidean distance metric is given by the following equation:
di =
∑
nj= (x1j −y1j)2 [image:9.612.177.418.141.253.2]1 (2)
Figure 2. 6 DPI - Left: 95% correct classification with linear discriminant Analysis - Right: 97% Clas-sification with LDA and least squared error classifier
[image:9.612.147.450.554.721.2]121
The Analysis of Plant’s Organic Volatiles Compounds
where d is the Euclidean distance between the calculated attributes x and the data points yi,
with n variables (Zhang, 2008). Usually in KNN algorithms, the Euclidean distance is used for finding the Nearest Neighbor, but for strongly correlated variables, it is also recommended to use correlation-based measures (Berrueta, 2007).
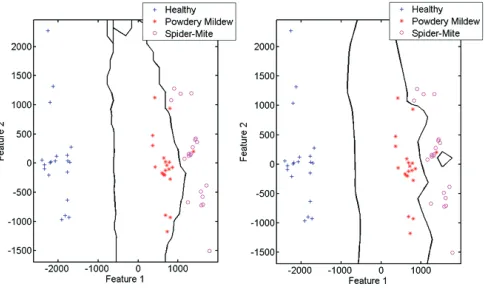
In this case, the initial value of K was set to 1. However, the best results were obtained when K = 9. Normally, increasing the value of K improves the classification performance, because of vari-ous spreads of data belonging to varivari-ous classes. However, k should not exceed the optimum value (Ciosek, 2006; Dragovic, 2007).
Figure 4 illustrates the K-Nearest result when
k is equal to 1 (left) and when k is equal to the optimum value which is 9 (right). It is evident that K-Nearest performed better with the optimal
k value with the error rate of 0.02%.
Artificial Neural Network (ANN)
Among statistical classification methods, ANNs are generally considered as the most promising PR routine to process the sensory signals from a chemical sensor array of ENs (Fu, 2007). ANNs are able to build a non-linear multivari-ate model of a presented training dataset (Nils Paulsson, 2000). They can recognize patterns
within vast datasets and then generalize those patterns into advantageous information (Yu & Wang, 2007). ANN algorithms are multipurpose and with appropriate training and customization, a single technique could solve several problems and become adopted for different environments (Escuder-Gilabert, 2009).
Initially, an ANN network needs to be created with suitable input and output layers. The neurons and weights are then initialized and adjusted ready for the learning phase. The numbers of inputs and outputs layers of the system are often determined by the system features. The final stage of learn-ing is the network testlearn-ing and validation. Testlearn-ing procedure will test the accuracy of the trained NN model in discriminating and hence classify-ing the samples.
The EN data from sensor responses were used to train the ANN for the purpose of comparing and identifying the correct class that each sample belongs to. Once the weights have been adjusted using the samples in the training and target ma-trix, the network can be used to predict the class membership of unknown samples.
[image:10.612.195.437.127.272.2]RBF and Parzen classifier based network were trained and tested for this case study. RBF net-works are relatively suitable to be used with EN generated data because they have advantages at convergence rate, probability of reaching global
122
The Analysis of Plant’s Organic Volatiles Compounds
points and local sensitivity compared to other techniques such as MLP (Daqi, Shuyan & Yan, 2004). In this study, a RBF network was formed with the following profile: the network consisted of two layers: a hidden radial basis layer and an output linear layer and contained 2 bias vectors. The SPREAD constant was set as an initial value of 1.0. The spread value did not change throughout the simulation and training.
Finally, the testing is performed using the test-ing data set which contained 40% of the original dataset. In later stages, in order to get better train-ing results, the testtrain-ing dataset size was increased. The decision boundaries are illustrated in Figure 5. Parzen classifier was able to achieve 94% cor-rect classification while RBF was only successful when classifying 88% of the dataset.
K-Means Clustering
The k-means algorithm has been publicized to be effective in producing respectable clustering results for many practical applications includ-ing EN. As an unsupervised clusterinclud-ing method, K-Means follow the following four steps before it reaches the optimum decision: (1) Randomly Assign each sample to one of the clusters k = 1,... K. (2) Calculate the means of each of the pre-defined clusters with the following formula:
mk
k
i z C
N i kz
= 1
∑
∈ (3)(3) Considering the N data points, it reassign each object zi to the cluster with the closest mean mk. and (4) Repeat step 2 until the means of the clusters do not change anymore (Heijden et al., 2004).
The four datasets were subjected to k-means technique so the differences between clusters could be investigated based on each DPI. This algorithm managed to clarify three categories especially in the 6 DPI dataset allocated to the healthy, powdery mildew and spider mite infected plants. The centroids are visibly separated favor-ably (Figure 6).
support Vector Machine (sVM)
In the last decade, a new classification and regres-sion technique called SVM which is based on Statistical Learning Theory (SLT) and has been proposed in the wide machine learning field and have been successfully applied to a number of problems ranging from face identification and text categorization to bioinformatics and data mining (Pardo & Sberveglieri, 2005).
[image:11.612.179.416.137.287.2]The SVM, as a supervised classification technique, has been broadly used to process and
123
The Analysis of Plant’s Organic Volatiles Compounds
analyze the EN datasets (Pardo et al., 2005; Du & Sun, 2005). The objective of the classifier is to find optimal hyperplane for separating clusters in the non-linearly separable context (Distante, Ancona, & Siciliano, 2003).
In this study, the SVM with two kernels was applied on a 6 DPI dataset. As well as polynomial kernels, the Gaussian kernel has been employed.
[image:12.612.332.529.125.379.2]Our SVM was able to classify the dataset with 89% performance rate when a polynomial kernel was used. With the Gaussian kernel however, a 98% classification was achieved. SVM has shown a great ability in discriminating between healthy and diseased tomato plants. Figure 7 illustrated the perfect decision boundaries separating healthy and diseased plants.
[image:12.612.205.438.581.716.2]Figure 6. K-means clustering: 4, 6, 8 and 9 days post infection
124
The Analysis of Plant’s Organic Volatiles Compounds
DIsCUssIONs AND CONCLUsION
In this chapter, we attempted to evaluate the EN’s capability in discriminating plants VOC samples and analyzing it by several PR methods.
Statistical and ANN based methods were ap-plied on 4 datasets gathered by the EN and their performances were reviewed. LDA and QDA managed to separate the samples with 97% and 98% success rate respectively. The ANN based classifiers were capable of discriminating the dataset with the relatively lower performance. Two ANN based network were constructed and trained using a Parzen and RBF algorithms. RBF managed to classify the 6 DPI dataset with 88% correct classification while Parzen classi-fier categorised the dataset with a slightly better performance (94%). The modest performance of ANN classifier is partially due to the small size of training dataset.
It was evident that the methods have all ex-posed a better performance when classifying 6 DPI and 8 DPI datasets. From these results, we can conclude that Powdery Mildew and Spider-Mites infected tomato plants can be discriminated from the healthy plant by 6 DPI. It is also clear that the powdery mildew disease had a major effect on the VOCs emitted from the plant. After 6 days of infection there were no gross visual changes on the leaves either from powdery mildew or spider mite plants. However, EN was able to discriminate between them.
SVM and QDA managed to discriminate between the healthy and infected plant with the highest performance rate (98%) and can be a perfect choice to be integrated with EN.
This chapter attempted to explain the capa-bilities of few supervised and unsupervised PR techniques in classifying a sensory dataset. Each technique offers a unique ability in categorizing the data but clearly they all have their own draw-backs. When designing an automated system, it is crucial to evaluate the overall performance of PR algorithm before being integrated into the
proposed system. Reliability, classification rate and speed are few parameters that engineers need to consider prior to system development. Some PR techniques demand a high processing power which may decrease their popularity when the hardware resources are limited. On the other hand, few PR techniques require extensive pre-processing procedure as well as rapid calibration which make them an unsuitable candidate for an automated system. In overall, a fully computer-ized PR enabled system such as EN diagnosis tool can be improved by optimisation techniques widely available for every method discussed in this chapter.
In conclusion, we believe that PR classifiers and EN provides an attractive means of dis-crimination between healthy and diseased tomato plants. Nevertheless, due to the modest number of samples, further sampling and enhancement of methods can increase the classification rate as well as the overall performance of the system.
ACKNOWLEDGMENT
This project is co-funded by the European Com-mission, Directorate General for Research, within the 7th Framework Programme of RTD, Theme 2 – Biotechnology, Agriculture & Food.
REFERENCEs
Agrios, G. (2004). Plant pathogens and disease: General introduction. In Encyclopedia of Micro-biology (3rd ed.). (pp. 613-646).
André Kessler, I. T. (2001). Defensive function of herbivore-induced plant volatile emissions in nature. Science, 291, 2141–2144. doi:10.1126/ science.291.5511.2141
Baratto, C., Faglia, G., Pardo, M., Vezzoli, M., Boarino, L., & Maffei, M. (2005). Monitoring plants health in greenhouse for space missions.
125
The Analysis of Plant’s Organic Volatiles Compounds
Berrueta, L. A., Alonso-Salces, R. M., & Heberger, K. (2007). Supervised pattern recognition in food analysis. Journal of Chromatography. A, 196–214. doi:10.1016/j.chroma.2007.05.024
Braun, R. C. (2009). Conidial germination patterns in powdery mildews. Mycological Research, 113(5), 616–636. doi:10.1016/j.my-cres.2009.01.010
Camargo, A., & Smith, J. S. (2009). An image-processing based algorithm to automatically identify plant disease visual symptoms. Biosys-tems Engineering, 102(1), 9–21. doi:10.1016/j. biosystemseng.2008.09.030
Ciosek, P., & Wroblewski, W. (2006). The analysis of sensor array data with various pattern rec-ognition techniques. Sensors and Actuators. B, Chemical, 114(1). doi:10.1016/j.snb.2005.04.008 Daqi, G., Shuyan, W., & Yan, J. (2004). An elec-tronic nose and modular radial basis function net-work classifiers for recognizing multiple fragrant materials. Sensors and Actuators. B, Chemical,
97, 391–401. doi:10.1016/j.snb.2003.09.018 Distante, C., Ancona, N., & Siciliano, P. (2003). Support vector machines for olfactory signals recognition. Sensors and Actuators. B, Chemi-cal, 30–39. doi:10.1016/S0925-4005(02)00306-4 Dragovic, S., & Onjia, A. (2007). Classification of soil samples according to geographic origin using gamma-ray spectrometry and pattern recognition methods. Applied Radiation and Isotopes, 65(2). doi:10.1016/j.apradiso.2006.07.005
Du, C.-J., & Sun, D.-W. (2005). Pizza sauce spread classification using colour vision and support vector machines. Journal of Food Engineering,
66(2). doi:10.1016/j.jfoodeng.2004.03.011 Dutta, R., Morgan, D., Baker, N., Gardner, J. & Hines, E. (2005). Identification of Staphylococ-cus aureus infections (MRSA, MSSA and C-NS) in hospital environments: Electronic nose based approach.
Escuder-Gilabert, M.P. (2009). A 21st century technique for food control: Electronic noses. Garcia-Laencina, P. J., Sancho-Gomez, J. L., Figueiras-Vidal, A. R., & Verleysen, M. (2009). K nearest neighbours with mutual information for simultaneous classification and missing data im-putation. Neurocomputing, 72(7-9). doi:10.1016/j. neucom.2008.11.026
Gardner, J.W., Hines, E. & Pang, C. (1996). De-tection of vapours and odours from a multisensor array using pattern recognition: self-organising adaptive resonance techniques.
Hai, Z., & Wang, J. (2006). Electronic nose and data analysis for detection of maize oil adulteration in sesame oil. Sensors and Actuators. B, Chemical,
119(2). doi:10.1016/j.snb.2006.01.001
Heijden, F. v., Duin, R., Ridder, D. d., & Tax, D. (2004). Classification, parameter estimation and state estimation. The Netherlands: John Wiley & Sons Ltd.doi:10.1002/0470090154
Holopainen, J. K. (2004). Multiple functions of inducible plant volatiles. Trends in Plant Science,
9(11), 529–533. doi:10.1016/j.tplants.2004.09.006 Ian, T., & Baldwin, A. K. (2002). Volatile signal-ing in plant–plant–herbivore interactions: What is real? Current Opinion in Plant Biology, 5(4), 351–354. doi:10.1016/S1369-5266(02)00263-7 Jun Fu, G. L. (2007). A pattern recognition method for electronic noses based on an olfactory neural network. Sensors and Actuators. B, Chemical, 489–497.
126
The Analysis of Plant’s Organic Volatiles Compounds
Moalemiyan, M., Vikram, A., & Kushalappa, A. C. (2007). Detection and discrimination of two fungal diseases of mango (cv. Keitt) fruits based on volatile metabolite profiles using GC/MS. (pp. 117–125).
Pardo, M., & Sberveglieri, G. (2005). Classifica-tion of electronic nose data with support vector machines. Sensors and Actuators. B, Chemical, 730–737. doi:10.1016/j.snb.2004.12.005
Parsons, N. R., Edmondson, R. N., & Song, Y. (2009). Image analysis and statistical modeling for measurement and quality assessment of ornamen-tal horticulture crops in glasshouses. Biosystems Engineering, 104(2), 161–168. doi:10.1016/j. biosystemseng.2009.06.015
Paulsson, N., Larsson, E. & Winquist, F. (2000).
Extraction and selection of parameters for evalu-ation of breath alcohol measurement with an electronic nose.
Peris, M., & Escuder-Gilabert, L. (2009). A 21st century technique for food control: Electronic nos-es. Analytica Chimica Acta, 638(1). doi:10.1016/j. aca.2009.02.009
Schütz, S., Weißbecker, B., & Hummel, H. E. (1996). Biosensor for volatiles released by dam-aged plants. Biosensors & Bioelectronics, 11(4), 427–433. doi:10.1016/0956-5663(96)82738-2
Theodoridis, S., & Koutroumbas, K. (2006). Pat-tern recognition. Academic Press.
Wang, Y., Wang, J., Zhou, B., & Lu, Q. (2009). Monitoring storage time and quality attribute of egg based on electronic nose. Analytica Chimica Acta, 650(2).
Yingquan, W. (2002). Improved k-nearest neigh-bor classification. Pattern Recognition, 35(10). Zhang, H., Chang, M., Wang, J. & Ye, S. (2008).
Evaluation of peach quality indices using an electronic nose by MLR, QPST and BP network.
Zhang, H., & Wang, J. (2007). Discrimination of LongJing green-tea grade by electronic nose.
Sensors and Actuators. B, Chemical, 122(1). Zhang, H., & Wang, J. (2007). Detection of age and insect damage incurred by wheat, with an elec-tronic nose. Journal of Stored Products Research,