Abstract—To improve the accuracy of SAR sea ice image classification, a new semi-supervised sea ice segmentation is proposed. Different initial label field and feature field of MRF energy function have important impacts on the final segmentation results. The initial label field of energy function is semi-supervised by sea ice recognition result. And the feature field is improved by extracting GLCM feature .The optimal energy function of the MRF model is obtained by simulated annealing method. The weighting parameter of the feature field is taken as a function of the annealing temperature. The influence of feature field on the classification result will auto-adjust to the annealing temperature. Finally, the three classes result of sea ice is accurately and boundaries distinct.
Experiments demonstrate that the proposed algorithm is able to successfully segment various SAR sea ice images and achieve improvement over existing published methods including the SA MRF, GMM, and K-means clustering.
Index Terms—synthetic aperture radar, Sea Ice segmentation, Markov Random Field, GLCM, semi-unsupervised.
I. INTRODUCTION
MAGE segmentation is a fundamental process in digital in image processing. It has been widely used in all aspects of image processing, such as image recognition, target detection, feature extraction and so on. Image segmentation transforms the original image into a more abstract and compact form, making it easier to analyze and understand the original image.
Thousands of different types of image segmentation algorithm has been proposed so far. e.g., thresholding methods, clustering methods, Statistical segmentation methods[1] and so on , as for Statistical segmentation methods,the Markov random field (MRF) is the most widely used statistically based image model. Using MRF models for image segmentation has a number of advantages. First, the Manuscript received March 6th, 2017; revised March 14th, 2017. This work was supported National Natural Science Foundation of China (No.
61501228), Natural Science Foundation of Jiangsu (No. SBK2014043002), Aeronautical Science Foundation of China (No. 20152052029)..
Y.Kong Author is with the Electronic and Information Engineering Department,Nanjing University of Aeronautics and astronautics, NUAA,China(e-mail:[email protected]).
X.Fei Author is with the Electronic and Information Engineering Department,Nanjing University of Aeronautics and astronautics, NUAA,China(e-mail: [email protected]).
F.Ge Author is with the Electronic and Information Engineering Department,Nanjing University of Aeronautics and astronautics, NUAA,China(e-mail:[email protected]).
S.Xing Author is with the Department of Electronic and Computer Engineering, University of Calgary, UC, Canada (e-mail:
H.Leung Author is with the Department of Electronic and Computer Engineering, University of Calgary, UC, Canada (e-mail:
number of model parameters is small. Second, the model has strong spatial restraint ability and can get better segmentation result. Third, the model is easy to combine with other methods.
This paper discusses a MRF based segmentation approach to segment synthetic aperture radar (SAR) sea ice image.
There are various MRF based segmentation models have been developed, MRF model is gradually improved from single MRF to dual MRF, multi-scale MRF model. The MRF model describes the structural features of images by constructing a spatial context model (Li, 2009)[2], and is widely used in SAR sea ice image segmentation. The traditional pixel-level MRF segmentation computation is large, iterative optimization is very easy to be trapped into the local minimum because of speckle noise. Yang and Clausi construct regional adjacency graphs(RAG) on the basis of the initial segmentation for regional-level MRF segmentation, the RAG is achieved by edge penalty and regional growth, which makes the algorithm more suitable for SAR image segmentation[3]. However, this algorithm cannot utilize the sea ice texture information, segmentation accuracy is poor.
Huawu Deng, David A. Clausi uses image intensity to discriminate ice from water and uses texture features to identify different ice classes. In order to seamlessly combine image spatial relationships with various image features, a novel Bayesian segmentation approach is developed and applied. This new approach uses an auto-adjust parameter to weight the two components of MRF model[4]. In paper[5], using gray level co-occurrence matrix (GLCM) to compute textural features of regions of interest considered for each class, MRF model is employed to model the feature matrix obtained, the labels are estimated through maximum a posteriori(MAP) estimation criterion using iterated conditional modes(ICM) algorithm.
The rest of the paper is organized as follows. Section 2 discusses fundamental of the MRF based segmentation model and Section 3 discusses how to improve the segmentation model. Section 4 presents experiments of applying the segmentation model with the new implementation scheme to segment SAR sea ice image. At last, we give a conclusion of the paper in the Section 5.
II. MRFIMAGEMODEL
MRF segmentation model takes fully consideration of the spatial structure of image, it can effectively describe the local statistical characteristics of the image. Usually, a two-dimensional random field X={x(i, j)∈S} satisfies the condition of positive probabilities and Markov-chain, which is called Markov random field, where X represents the set of pixels.
Semi-supervised Segmentation of Sea Ice SAR Image Using IGLCM-MRF Model
Yingying Kong, Xuanjia Fei, Fen Ge, Shiyu Xing, Henry Leung, Fellow, IEEE
I
In MAP-MRF framework, the problem of image segmentation is transformed into the optimization problem of objective function by the maximum a posteriori probability estimation and MRF model. The observation model defines the relation between the intensity data or feature f and the image labels y. According to the Bayes rule, the segmentation problem is formulated as
P F f Y y P Y y
P Y y F f
P F f
(1) P(Y=y | F=f) is the posterior probability of image label Y=y condition on the intensity data F=f. Where P(Y = y) is a prior probability of Y=y and is used to describe the label distribution of a segmented result only, which is normally referred to as the region labeling component. P(F=f | Y=y)denotes the probability distribution of y conditioned on X and functions to fit the feature data, which is thus referred to as the feature modeling component. P(F = f)is the probability distribution of F=f. When the image is known, P(F = f)is a fixed value, So the MAP estimate can be expressed as Y*arg maxy
P F
f Y y P Y
y
, where θ represented all type labels, Yis the estimated value of Y. P(Y= y) can be obtained from the MRF model, P(F=f | Y=y) is obtained by the feature field model. In the literature, agreement exists on the gamma distribution being suitable for the description of the class-conditional density function of SAR data. Taking the logarithmic on both sides of the equation, the class-conditional density function are modeled as Y*arg miny
E F
f Y| y
E Y
y
.III. SEMI-SUPERVISEDSEAICESEGMENTATIONON SA-MRF
A. Improve GLCM-MRF Model(IGLCM-MRF)
The maximum probability of posterior probability is equivalent to minimize the energy function. And the energy function is non-convex. So the simulated annealing (SA) method can be used to obtain the minimum value.
The energy function of the MRF model can be expressed as:
R FE y E E (2) Where ER is label field energy. EF is feature field energy. α is a weighting parameter used to determine how much ER and EF
individually contribute to the entire energy.
MRF-based segmentation model is very easily trapped in local maxima, in the paper[4],a implementation scheme is proposed to solve this problem by making the weighting parameter vary during unsupervised segmentation. For the simulated annealing algorithm, the paper proposes a method to change the weighting parameter by annealing temperature.
The expression is as follows:
0i T i
(3) Where T0·τi is the temperature of the ith iteration process, b=1/M, M is the dimension of the feature space.
Simulated Annealing algorithm simulates the annealing process of solid matter in physics. When the temperature changes from high to low, it can update the state of energy function randomly, which is beneficial to get the global
optimal solution. The specific steps of simulated annealing algorithm used in energy function optimization are as follows:
(1) Determine the number of sea ice type, assign initial labels to each pixel;
(2) Calculate the mean μ and standard deviation σ2 of each type based on the label field;
(3) For the result of ith iteration of the image, E(i, s) (s stands for a segmented result) denotes the energy value of any point in the image, if it satisfy the formula (4), the label of the pixel is updated to m , change all the pixels in the image to get the result of ith iteration.
,
,
k log E i s E i m T (4) Where, Tk=T0·τi, 0<τ<1, ξ is a uniformly distributed random variables [0,1] .
(4)The global energy difference of the adjacent two iterations is set to the convergence condition. If the energy difference is small enough, the iteration is stopped, or turn to step 2 continue the iteration.
B. Initial MRF Label Field And Feature Field Energy Setting
In this paper, ER the initial label energy was obtained by a recognition method. Extraction SIFT features I={x1,x2,...xm} of image I(M×N). The visual dictionary is D={μ1,μ2,...μk}. the Euclidean distance between xi and{μ1,μ2,...μk} is separately calculated. Then featurexi is renewed with the nearest μi. The SIFT feature set can be replaced by the set of μi ,while the image feature set I can be expressed by visual words D.
Specific steps are as follows:
(1)Extract SIFT features of three sea ice images as training samples;
(2)Clustering the SIFT features of all the sample images.
The clustering centers are obtained to set dictionary;
(3) The number of visual words between training samples and test samples is counted and normalized, and the three class image can be expressed as the K dimension eigenvector.
(4) According the classification rule of SIFT-clustering, the support vector machine based on RBF kernel function is decided to achieve the image classification,
The energy of the pairwise the multilevel logistic (MLL) model is as follows:
,
s
R i s s t
s t N
E y y y y
(5)Where δ(ys, yt)=-1 if ys=yt , δ(ys, yt)=1 if ys≠yt, β is usually a constant which can be specified a priori. In this paper, β is changed βi(ys). i denotes iterate times. Specially, the initial label filed was used in β0(ys). And Ns represents the neighborhood centered on [6]. ER(y) denotes the energy of local image regions.
EF is feature field energy, which set by a new method by gray-level co-occurrence matrix (GLCM). To determine ice concentrations, the pixel intensity feature is the only necessary feature. However, to segment multiple ice images, preferred results are obtained fusing the intensity and the GLCM features.
In this paper, we calculate GLCM with the window size is 7×7, chose three uncorrelated quadratic statistics based on
GLCM: entropy, contrast and correlation, to describe the texture features, together with the intensity feature to form a four-dimensional feature matrix F=[fk]=[ f1, f2, f3, f4], k=1,2,...Generally, the feature field distribution can be modeled by a Gamma function. Gamma distribution is generally used to describe the intensity distribution of SAR image, and usually is applied in SAR image segmentation and detection, but in the feature field, the each kind of features is approximate independents. According law of large numbers, the feature field distribution is more close to Gauss distribution. So EF( f ) is rewrite as follow:
2
2 2
1 2 2
k k
s m
k
s k k
m m
p F f Y m f
(6)
4
, 1
log
m
k
F s m
S Y y k
E f p f y
(7) Where μkm and σkm represent the class mean and standard deviation. In the image feature spare S, fks means the k class feature component.
Finally, the energy function of the MRF model can be changed as:
R FE y E E
,
s
i s s t F
s t N
y y y i E f
(8)
IV. EXPERIMENTALRESULTS A. Parameter Settings
Figure 1 (a) is an Arctic sea ice image, the image size is 300 300 pixels, gray level is 256, the image contains three types of sea ice, gray for the thick ice, white for the ice, black for open water. The study using simulation Figure 1 (b) is the corresponding artificial interpretation image.
a b Fig.1 Sea ice image
Parameter τ are generally selected by experience 0.95 and 0.98 to control the annealing speed. The initial temperature T0
is 5,10,20. Figure 2 is the corresponding to the segmentation results for different initial temperature T0 and parameters τ, Table 1 is the corresponding segmentation accuracy.
It can be seen from the segmentation results that when the initial temperature T0 is low, the weighting coefficient α is relatively small, the final segmentation accuracy is low, with the initial temperature increases, the image segmentation accuracy also increases, there is litter difference when T0=10 and T0=20, thus, in order to take into account the algorithm operation speed and image segmentation accuracy, we select T0=10,τ=0.95.
T0 5,0.95 T010,0.95 T020, 0.95
0 5, 0.98
T T0 10,0.98 T020,0.98
Fig.2 Simulated Annealing Segmentation Results TABLE I
Simulated Annealing Parameter Setting
Initial
Parameter 0 5
T T 0 10 T 0 10
0.95 96.71% 97.29% 97.16%
0.98
96.50% 97.26% 97.11%
B. MRF Label Field Extraction
The image to be segmented is shown in Fig.3, the image size is 1800 4400 pixels, and image resolution is.1m1m.
Fig.3 Arctic sea ice image
In the image segmentation study based on MRF model, K-means algorithm is simple and computationally fast, so it is widely to obtain initial label field. Since the pixel values of most speckle noise in the SAR image are close to the broken ice, it is easy to divide the speckle noise and broken ice into one class by K-means.
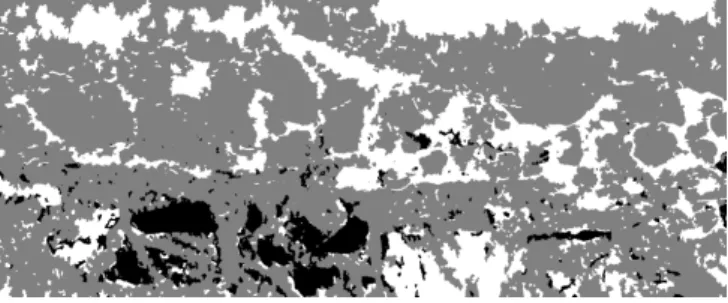
Fig.4 Regional Sea Ice Type
In this paper, the new setting method of initial label field is used for ice classification. Firstly, we choose eighty samples, extract 36410 features by SIFT, then K-means clue 80 main features. Secondly, the
processed data will be training data of SVM. Then the original image can be classified by 3 classes, the frozen ice, broken ice, open water. Finally, the result of sea ice type recognition is used as the initial label field (as shown in Fig. 4). Then estimate the energy function of the label field and feature field and segment the image.
C. Segmentation of Multiple Ice Imagery
In order to verify the validity of the IGLCM-MRF (Improved Gray-Level Co-occurrence Matrix) segmentation algorithm, select three representative images of the each types of sea ice: open water, frozen ice and broken ice. The image is segmented by K-means method, Gaussian mixture model (GMM) algorithm, SA-MRF segmentation algorithm[4] and IGLCM-MRF. The segmentation result is shown in Figure 5.
a. Checkerboard image
b. k-means c. GMM
d. SA-MRF e. IGLCM-MRF Fig.5 Comparison of Different Segmentation Algorithms
TABLE II
Comparison of Segmentation Accuracy
Algorithm k-means GMM SA-MRF IGLCM-MRF Accuracy 94.20% 94.53% 97.28% 99.66%
The K-means and GMM belong to the clustering method, and the final segmentation results are similar. The segmentation accuracy of the two algorithms is relatively high.
But in the frozen ice and broken ice area, because the speckle noise is more serious, the segmentation result is not good. For the SA-MRF algorithm, the segmentation accuracy of the frozen ice has been greatly improved, only the broken ice area has many errors due to the complex texture and speckle noise.
In the segmentation result of IGLCM-MRF are nearly no incorrect points. In Table 2, the accuracy of each algorithm is
analyzed. The segmentation accuracy of IGLCM-MRF is highest, and it can accurately distinguish the sea ice in the image.
While SA-MRF model only changed initial label field by regional sea ice type, the result segmentation shows in Figure 6. Compared with original image, it can be found that the noise in the upper part of the image is obviously suppressed.
The edge of frozen ice and broken ice is more obvious. But there are still many points of error in the place with serious noise, need to be removed.
Fig.6 MRF Segmentation Based on Regional Sea Ice Type Figure 7 is the sea ice distribution image obtained by IGLCM-MRF segmentation result. Comparing with original image by visual sense, the result is reliable and distinct.
Fig.7 Sea Ice Distribution based on IGLCM-MRF
V. CONCLUSION
This paper mainly studies the segmentation of sea ice SAR images, and proposes a new MRF model by changed energy function. The two key factors for MRF image segmentation algorithm are label field and feature field. The K-means classification result is usually used as the initial label field, however, for the SAR images processed by this paper, K-means classification result are badly affected by speckle noise, and the accuracy of segmentation is low. Using regional sea ice types as the initial label field can reduce misclassification caused by the scattered noise. Secondly, we extract GLCM features SAR images to construct the feature field, make full use of the texture information of the image.
The energy function of MRF model can be obtained according to the initial label field and feature field. Finally, the simulation results are compared with others model. The algorithm has stronger anti-noise performance, and the edge preserving ability is stronger.
.
ACKNOWLEDGMENT
The data used in this study and technical guidance were kindly provided by David G. Long of Brigham Young
University, Provo, UT 84.
REFERENCES
[1] Shaffrey C W, Nick G. Kingsbury, and Ian H. Jermyn. "Unsupervised image segmentation via Markov trees and complex wavelets,"
International Conference on Image Processing. 2002, Proceedings.
DBLP, Vol. 3. pp.801-804, 2002.
[2] Li S Z. “Markov random field modeling in image analysis,” Springer Science & Business Media, 2009.
[3] Yang, Xuezhi, and David A. Clausi. "Evaluating SAR sea ice image segmentation using edge-preserving region-based MRFs," IEEE International Conference on Image Processing, vol.5, pp.1721-1724.
2012.
[4] Deng, Huawu, and David A. Clausi. "Unsupervised segmentation of synthetic aperture radar sea ice imagery using a novel Markov random field model," IEEE Transactions on Geoscience and Remote Sensing vol.43, no.3, pp. 528-538, 2005.
[5] Mridula, J., Kundan Kumar, and Dipti Patra. "Combining glcm features and markov random field model for colour textured image segmentation," IEEE International Conference on Devices and Communications, pp.1-5, 2011.
[6] S.Geman and D. Geman, “Stochastic relaxation, Gibbs distributions, and the Bayesian restoration of images,” IEEE Trans. Pattern Anal.
Machine Intell, vol.6, no.6, pp.721–741, Jun. 1984.