Pulses, being an important source of proteins, are the major constituent of diet in India, where the consumption of animal protein except milk is still considered a religious and social taboo. However, there is a growing recognition that production alone does not solve the food problem, food grains must be preserved in edible, nutritionally adequate condition until they can be distributed and con-sumed by those who need it. Pulse grains such as redgram and greengram are important sources of proteins and lipids and also natural isoflavinoid antioxidants such as daidzein, genistein and their glucosides daidzin and genistin, which can protect them against oxidation (Lapcik et al. 1999) for human consumption as well as animal feed. During
storage these pulses suffer a great deal of damage due to storage moulds and insects, and the most serious results of such damage appear to be both quantitative and qualitative losses. Lipid oxidation is one of the major causes of quality deterioration in natural foods, oxidative deterioration is a large economic concern in the food industry because it affects many quality characteristics such as flavour, colour, texture, and the nutritive value of foods (Chaiyasit et al. 2007). Lipid related changes during storage revealed a decline in phospholip-ids and polyunsaturated fatty acphospholip-ids (Priestly & leoplod 1983a,b). The role of fungi in changes occurring during storage is great and the most frequently reported among these changes were an
Effect of Storage on Redgram
(
Cajanus cajan
/L./
Millsp)
and Greengram
(
Vigna radiata
/L./
Wilczek) with Particular
Reference to Lipid Composition
Mysore Ranganayaka GoPiNath1, Kari SaMbiah2 and Siddapura Ramachandra NiRaNjaNa1
1Department of Studies in applied botany & biotechnology, University of Mysore, Manasagangotri, Mysore, Karnataka, india; 2Department of biochemistry and Nutrition,
Central Food technological Research institute, Mysore, Karnataka, india
Abstract
Gopinath M.R., Sambiah K., NiranjanaS.R. (2011): Effect of storage on redgram (Cajanus cajan /L./ Millsp)
and greengram (Vigna radiata /L./ Wilczek) with particular reference to lipid composition. Plant Protect. Sci., 47: 157–165.
The effects of storage on the lipid composition of three redgram (TTB-7, BRG-1, and ICP-8863) and three
greengram (PUSA BISAKI, KDM-1, and CHINA MOONG) varieties were studied. Environment variables such
as temperature and relative humidity were recorded during storage period. Moisture content was found to increase along with the percent incidence of storage insects. The incidence of storage moulds and insects was recorded in all the samples; results showed that storage moulds belonged to aspergillus species and the insect
Callosobruchus chinensis infested the stored samples. The total fat, triglycerides, phospholipids, free fatty acids and peroxide value were evaluated in the control and in samples stored for three and six months. Results showed that storage depleted total fat (1.94–1.75 g), triglycerides (1.46–1.07 g), whereas phospholipids (0.06–0.21g), free fatty acids (0.002–0.01 g) and peroxide values (2.14–4.46 meq) increased. The fatty acid content of palmitic (26.03–23.56%), stearic (7.4–5.46%), linoleic (56.2–45.2%) and linolenic acids (6.9–4.7%) decreased, but oleic acid content increased (8.3–21.6%) in all the varieties during storage.
increase in free fatty acids, peroxide value and a decrease in total fat, seed germination (Goodman 1950; Doworth & Christensen 1968; Fletcher 1968; Mbata & Osuji 1983; Mbata 1986). Others (Millner & Geddes 1946a,b; Goodman 1950; Modgil & Mehta 1996; Ojimelukwe et al. 1999) reported the nutritive changes caused by infestation by storage insects. Very few reports were available with respect to redgram and greengram varieties, which are extensively used in India for various food preparations; hence the present study was carried out to understand the effect of storage moulds and insects on lipid composition during storage of redgram and greengram varieties.
MAtERiAL And MEthodS
Collection of samples. Infestation-free samples comprising the redgram variety TTB-7 (Turk Tugari Bangalore),BRG-1 (Bangalore Redgram), ICP-8863 (International Crops Pulses) and greengram varieties PusaBisaki, KDM-1 (Karnataka Dharwad Moong) and China Moong (5 kg each sample) were procured from National Seed Project of Banga-lore and Dharwad Agricultural Universities. The samples were stored in cotton bags for six months (June–December 2004), allowed for natural infes-tation under temperature and relative humidity of laboratory conditions. All the chemicals used in this study were of analytical grade and the solvents were distilled before their use.
Monitoring of environment variables dur-ing storage. Durdur-ing the storage period the actual weather data on mean maximum and minimum temperature (°C) and relative humidity (%) of the storage room were recorded on all the days. Relative humidity (%) was recorded with wet and dry bulb hygrometer (psychrometer) following the method of Buck (1981).
Determination of moisture content by high constant temperature oven method. Seeds were pulverized and the known amount (5 g) of seeds was taken and the working sample was evenly distributed over the surface of the container. The weight of the container and its cover was recorded before and after filing the sample. The oven was maintained at a temperature of 130–133°C, the sample was dried for 1 hour. At the end of the prescribed period the container was covered and placed in a desiccator to cool for 30–45 minutes. After 1 hour the sample was cooled in a desiccator
and the weight was noted down. The percentage loss in weight was calculated according to ISTA (Anonymous 2003).
Moisture content (%) = (M2 – M3) × 100 (M2 – M1) where:
M1 – weight of the empty dish (g)
M2 – weight of dish + powdered seed material (before drying) (g)
M3 – weight of dish + powdered seed material (after drying) (g)
Screening for moulds. Screening was done by the standard blotter method (Anonymous 1996). About 400 seeds were plated on blotters well soaked in water, incubated at 22°C for 7 days under 12 h alternating cycles of light and darkness. After incubation, each seed was examined for the growth of fungi under different magnifications of a stereomicroscope. The identification of fungi was based on habit characters of fruiting bodies, spores and conidia observed under a compound microscope.
Screening for insects. Insect count was obtained by counting the number of adults (both dead and live) in 100 g of seed material using ethyl ether as anaesthesia and sieving out insects from the seed sample (Tripathy et al. 2001).
Extraction of total lipids. Total lipids were ex-tracted by the method adopted by Bhattacharya and Raha (2002): lipids from redgram and green-gram seeds were extracted with hexane (60–80°C) in the Soxhlet extractor for eight to twelve hours and oil content was expressed as dry weight basis.
Triglyceride composition. Triglyceride content was determined by using the method of Fletcher (1968). Tripalmitin (Sigma Chemicals,Perth, Aus-tralia) was used as a standard.
Phospholipid composition. Phospholipid con-tent was determined by the method describedby Stewart(1980) using phosphatidyl choline as a standard.
Free fatty acid content. Free fatty acids were determined by the method of Lisker et al.(1985). Estimation was done titrimetrically, and the amount of free fatty acids was quantified using the standard graph of oleic acid.
Peroxide value. The peroxide value was deter-mined by the method described by Stine et al. (1953). Ferrous iron was used as a standard.
by Morrison and Smith (1964). Fatty acid methyl esters were analysed using a Shimadzu 14-B gas chromatograph fitted with silica capillary column (30 m × 0.24 mm, Konick, Spain), while the injection port and detector temperature was maintained at 230°C and 240°C, respectively. The column tem-perature was at 220°C with nitrogen as a carrier
with the flow rate of 1 ml/minute. Individual fatty acids were identified by comparison with fatty acid methyl esters procured from Nechek prep. USA.
Statistical analysis. Statistical analysis of all the parameters was performed with the SPSS 10.0 software package (SPSS, Chicago, USA). Tukey’s multiple comparison tests were used to compare the differences between the means by least significant differences at a 5% level of probability.
RESuLtS
In 2004 (June–December) the maximum mean temperature was recorded in the month of
Sep-tember (32.1°C) followed by July (31.2°C), October (30.8°C), June (29.8°C), August (29.6°C), Decem-ber (29.5°C), and NovemDecem-ber (28.1°C). The mean relative humidity was maximum in the month of October (81.6%) followed by September (80.2%), July (79.8%) and November (77.5%), whereas June and August (76.4%) recorded the same percentage of relative humidity during storage (Table 1).
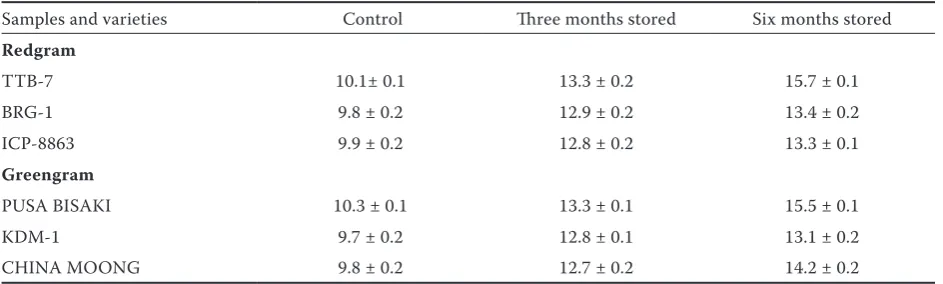
Moisture content in the samples was found to be the highest in varieties PUSA BISAKI (10.3%) followed by TTB-7, ICP-8863, CHINA MOONG, BRG-1, and KDM-1. At the end of three-month storage all the samples recorded an increase in the percentage of moisture content and the highest percentage was found in varieties TTB-7 and PUSABISAKI (13.3%) followed by BRG-1, ICP-8863, KDM-1 and CHINA MOONG. After six-month storage the maximum moisture content was found in the variety TTB-7 followed by PUSABISAKI, CHINA MOONG, BRG-1, ICP-8863,and KDM-1(Table 2).
[image:3.595.64.532.101.247.2]The initial evaluation of fresh greengram samples revealed a minimum incidence of storage fungi Table 1. Atmospheric temperature and relative humidity in laboratory during storage period
Month Temperature (°C) Relative humidity (%) maximum minimum mean maximum minimum mean
June 29.8 18.9 25.3 98 39 76.4
July 31.2 18.7 24.6 96 41 79.8
August 29.6 18.6 24.2 96 42 76.4
September 32.1 19.2 25.6 95 29 80.2
October 30.8 19.0 29.2 96 24 81.6
November 28.1 16.7 23.8 97 34 77.5
December 29.5 12.4 21.6 92 25 74.8
Table 2. Moisture content (%) in redgram and greengram during storage
Samples and varieties Control Three months stored Six months stored
Redgram
TTB-7 10.1± 0.1 13.3 ± 0.2 15.7 ± 0.1
BRG-1 9.8 ± 0.2 12.9 ± 0.2 13.4 ± 0.2
ICP-8863 9.9 ± 0.2 12.8 ± 0.2 13.3 ± 0.1
Greengram
PUSA BISAKI 10.3 ± 0.1 13.3 ± 0.1 15.5 ± 0.1
KDM-1 9.7 ± 0.2 12.8 ± 0.1 13.1 ± 0.2
CHINA MOONG 9.8 ± 0.2 12.7 ± 0.2 14.2 ± 0.2
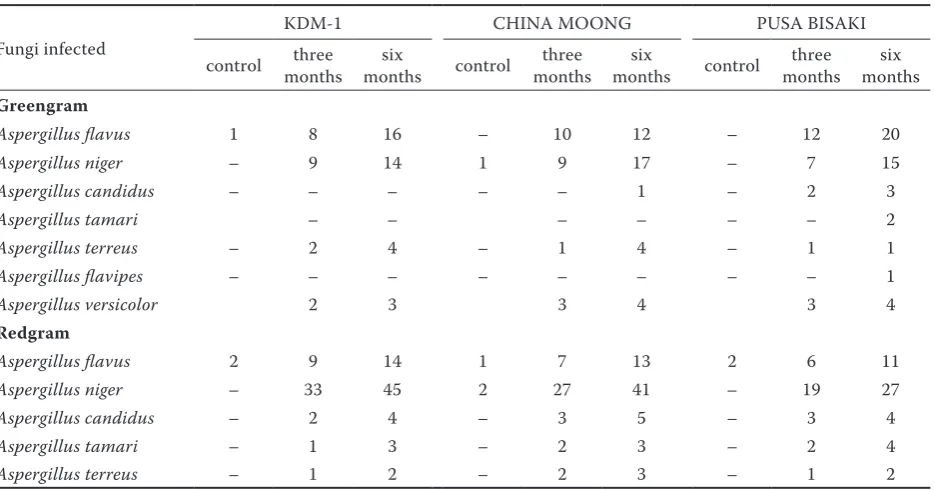
[image:3.595.63.535.595.737.2]a. flavus 1% and a. niger 1%. In samples stored for three months a gradual increase of the storage fungal spectrum was observed. aspergillus flavus recorded the highest incidence ranging from 8% to 12% followed by a. niger 70% to 9%, a. versicolor 2% to 3%, a. candidus 2%. At the end of six-month storage the density of storage fungi of aspergillus species increased, when the incidence of a. flavus ranged from 12% to 20%, followed by a. niger 14–7%, a. candidus 1–3%, a.tamarii 2%, a. versicolor 3–4%, a. terreus 1–4% and a. flavipes 1% (Table 3).
The incidence of storage fungi found at a lower frequency among a. flavus incidence ranged from 1% to 2% followed by a. niger 2% in fresh samples
of redgram samples. Mycofloral analyses of sam-ples stored for 3 months revealed a. niger found predominantly ranging from 19% to 33%, followed by a. flavus 6–9%, a. tamarii 1–2%, a. candidus 2–3%, and a. terreus 1–2%. At the end of 6-month storage, the incidence of storage fungi of the spe-cies aspergillus completely dominated. a. niger incidence ranged from 27% to 45% followed by a. flavus 11–14%, a. candidus 4–5%, a .tamarii 3–4%, and a. terreus 2–3% (Table 3).
[image:4.595.66.534.100.345.2]The initial screening results did not record any incidence of storage insects. At the end of three-month storage, the varieties TTB-7 and PUSA BISAKI were found to be infested by the insects Table 3. Storage mycoflora incidence (%) in green gram and red gram samples during storage
Fungi infected
KDM-1 CHINA MOONG PUSA BISAKI
control monthsthree monthssix control monthsthree monthssix control monthsthree monthssix
Greengram
aspergillus flavus 1 8 16 – 10 12 – 12 20
aspergillus niger – 9 14 1 9 17 – 7 15
aspergillus candidus – – – – – 1 – 2 3
aspergillus tamari – – – – – – 2
aspergillus terreus – 2 4 – 1 4 – 1 1
aspergillus flavipes – – – – – – – – 1
aspergillus versicolor 2 3 3 4 3 4
Redgram
aspergillus flavus 2 9 14 1 7 13 2 6 11
aspergillus niger – 33 45 2 27 41 – 19 27
aspergillus candidus – 2 4 – 3 5 – 3 4
aspergillus tamari – 1 3 – 2 3 – 2 4
aspergillus terreus – 1 2 – 2 3 – 1 2
Data based on four replicates of 100 seeds of each variety
Table 4. Incidence of storage insects in redgram and greengram samples
Samples/varieties Total number of insects/100g sample (%) Insect infested control three months stored six months stored
Greengram
KDM-1 – – 03
Callosobruchus chinensis
CHINA MOONG – – 02
PUSA BISAKI – 9 97
Redgram
BRG-1 – – 02
Callosobruchus chinensis
TTB-7 – 25 70
ICP-8863 – – 03
[image:4.595.63.535.593.737.2]Callosobruchus chinensis at 25% and 9%, respec-tively, whereas no incidence was found in the other varieties. At the end of six-month storage the variety PUSA BISAKI (97%) recorded a maximum population of insects followed by TTB-7 (70%), CHINA MOONG, ICP-8863 (3%), BRG-1 and CHINA MOONG (2%) (Table 4).
Variation in the lipid composition of redgram varieties was determined in both control and stored samples of redgram and greengram varieties. The total lipid content was significantly (P≤ 0.05)
re-duced in TTB-7 variety from 1.64 g to 1.55 g and 1.5 g under storage. Whereas in BRG-1variety it
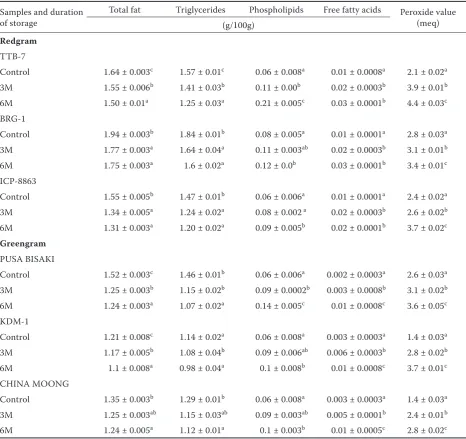
[image:5.595.64.531.281.720.2]decreased from 1.94 g to 1.74 g and in ICP-8863 it was reduced from 1.54 g to 1.31 g in stored samples. There was a significant reduction in triglyceride content in stored varieties of redgram, the maximum decrease was in var. TTB-7 from 1.57g to 1.41g and 1.25 g in three and six months respectively, however in var. BRG-1 it was reduced from 1.84 g to 1.64 g and 1.60 g during storage. In ICP-8863 variety a significant difference between the control (1.47 g) and samples stored for three months (1.24 g) was recorded whereas there was no significant difference between samples stored for three and six months (Table 5).
Table 5. Lipid composition of redgram and greengram varieties during storage
Samples and duration of storage
Total fat Triglycerides Phospholipids Free fatty acids Peroxide value (meq) (g/100g)
Redgram
TTB-7
Control 1.64 ± 0.003c 1.57 ± 0.01c 0.06 ± 0.008a 0.01 ± 0.0008a 2.1 ± 0.02a
3M 1.55 ± 0.006b 1.41 ± 0.03b 0.11 ± 0.00b 0.02 ± 0.0003b 3.9 ± 0.01b
6M 1.50 ± 0.01a 1.25 ± 0.03a 0.21 ± 0.005c 0.03 ± 0.0001b 4.4 ± 0.03c
BRG-1
Control 1.94 ± 0.003b 1.84 ± 0.01b 0.08 ± 0.005a 0.01 ± 0.0001a 2.8 ± 0.03a
3M 1.77 ± 0.003a 1.64 ± 0.04a 0.11 ± 0.003ab 0.02 ± 0.0003b 3.1 ± 0.01b
6M 1.75 ± 0.003a 1.6 ± 0.02a 0.12 ± 0.0b 0.03 ± 0.0001b 3.4 ± 0.01c
ICP-8863
Control 1.55 ± 0.005b 1.47 ± 0.01b 0.06 ± 0.006a 0.01 ± 0.0001a 2.4 ± 0.02a
3M 1.34 ± 0.005a 1.24 ± 0.02a 0.08 ± 0.002 a 0.02 ± 0.0003b 2.6 ± 0.02b
6M 1.31 ± 0.003a 1.20 ± 0.02a 0.09 ± 0.005b 0.02 ± 0.0001b 3.7 ± 0.02c Greengram
PUSA BISAKI
Control 1.52 ± 0.003c 1.46 ± 0.01b 0.06 ± 0.006a 0.002 ± 0.0003a 2.6 ± 0.03a
3M 1.25 ± 0.003b 1.15 ± 0.02b 0.09 ± 0.0002b 0.003 ± 0.0008b 3.1 ± 0.02b
6M 1.24 ± 0.003a 1.07 ± 0.02a 0.14 ± 0.005c 0.01 ± 0.0008c 3.6 ± 0.05c
KDM-1
Control 1.21 ± 0.008c 1.14 ± 0.02a 0.06 ± 0.008a 0.003 ± 0.0003a 1.4 ± 0.03a
3M 1.17 ± 0.005b 1.08 ± 0.04b 0.09 ± 0.006ab 0.006 ± 0.0003b 2.8 ± 0.02b
6M 1.1 ± 0.008a 0.98 ± 0.04a 0.1 ± 0.008b 0.01 ± 0.0008c 3.7 ± 0.01c
CHINA MOONG
Control 1.35 ± 0.003b 1.29 ± 0.01b 0.06 ± 0.008a 0.003 ± 0.0003a 1.4 ± 0.03a
3M 1.25 ± 0.003ab 1.15 ± 0.03ab 0.09 ± 0.003ab 0.005 ± 0.0001b 2.4 ± 0.01b
6M 1.24 ± 0.005a 1.12 ± 0.01a 0.1 ± 0.003b 0.01 ± 0.0005c 2.8 ± 0.02c
Phospholipid contents were determined in all the redgram samples during storage, and a significant increase in all the stored varieties of redgram was recorded. In TTB-7 variety phospholipid content increased from 0.06 g to 0.11 g and 0.21 g in the stored samples, in BRG-1 it varied from 0.08 g to 0.11 g and 0.12 g, whereas in ICP-8863 it increased from 0.06 g to 0.08 g and 0.09 g during storage (Table 5).
The free fatty acids and peroxide value deter-mined in redgram varieties during storage show a significant increase in the fatty acid level of var. TTB-7 from 0.01 g to 0.02 g and 0.03 g, in BRG-1 it increased from 0.01 g to 0.02 g and 0.03 g in the control, 3- and 6-month storage whereas in var. ICP-8863 it increased from 0.01 g to 0.02 g and 0.03 g. The peroxide value significantly increased in all the varieties of redgram, in TTB-7 it increased from 2.14 meq to 4.4 meq, in BRG-1 it increased from 2.8 meq to 3.4 meq, and in ICP-8863 from 2.4 meq to 3.71 meq (Table 5).
Variations in the lipid composition of greengram varieties during storage were determined. Total lipids in greengram varieties showed a significant reduction (P ≤ 0.05) in samples stored for three
and six months when compared to the control. The total lipids of PUSA BISAKI were depleted from 1.52 g to 1.25 g and 1.24 g, in KDM-1 they varied from 1.21 g to 1.17 g and 1.1 g, whereas in CHINA MOONG they decreased from 1.35 g to 1.25 g and 1.24 g during storage. The total trig-lyceride content was significantly reduced in all greengram varieties, inPUSA BISAKIit was from 1.46 g to 1.15 g and 1.07 g, however inKDM-1 it decreased from 1.14 g to 1.08 g and 0.98 g and in CHINA MOONG it was reduced from 1.29 g to 1.15 g and 1.12 g in stored samples (Table 6).
The phospholipid level was significantly in-creased in all stored varieties of greengram samples, in PUSABISAKI it increased from 0.06 g to 0.09 g and 0.14 g during storage, in var. KDM-1 from 0.06 g to 0.09 g and 0.10 g and in CHINA MOONG it increased from 0.06 g to 0.09 g and 0.10 g in the control and in samples stored for three and six months, respectively (Table 7).
[image:6.595.306.527.114.710.2]Total free fatty acids and peroxide values of stored greengram varieties were determined in greengram and redgram during storage. Among all the samples a significant increase of free fatty acid content was recorded in var. PUSA BISAKI from 0.002 g to 0.01 g and 0.03 g, whereas in KDM-1 it increased from 0.003 g to 0.006 g and 0.01 g and
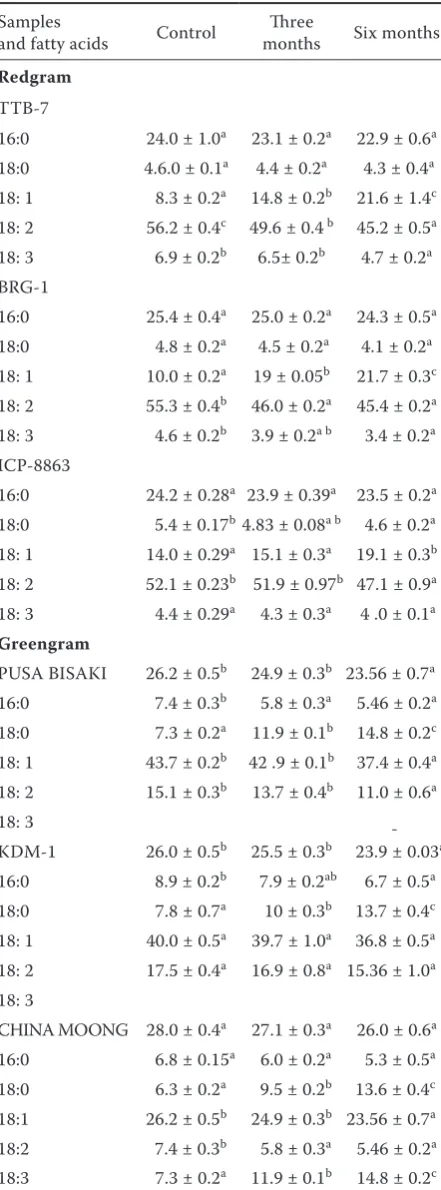
Table 6. Fatty acid compositions in redgram varieties during storage
Samples
and fatty acids Control monthsThree Six months
Redgram
TTB-7
16:0 24.0 ± 1.0a 23.1 ± 0.2a 22.9 ± 0.6a
18:0 4.6.0 ± 0.1a 4.4 ± 0.2a 4.3 ± 0.4a
18: 1 8.3 ± 0.2a 14.8 ± 0.2b 21.6 ± 1.4c
18: 2 56.2 ± 0.4c 49.6 ± 0.4 b 45.2 ± 0.5a
18: 3 6.9 ± 0.2b 6.5± 0.2b 4.7 ± 0.2a
BRG-1
16:0 25.4 ± 0.4a 25.0 ± 0.2a 24.3 ± 0.5a
18:0 4.8 ± 0.2a 4.5 ± 0.2a 4.1 ± 0.2a
18: 1 10.0 ± 0.2a 19 ± 0.05b 21.7 ± 0.3c
18: 2 55.3 ± 0.4b 46.0 ± 0.2a 45.4 ± 0.2a
18: 3 4.6 ± 0.2b 3.9 ± 0.2a b 3.4 ± 0.2a
ICP-8863
16:0 24.2 ± 0.28a 23.9 ± 0.39a 23.5 ± 0.2a
18:0 5.4 ± 0.17b4.83 ± 0.08a b 4.6 ± 0.2a
18: 1 14.0 ± 0.29a 15.1 ± 0.3a 19.1 ± 0.3b
18: 2 52.1 ± 0.23b 51.9 ± 0.97b 47.1 ± 0.9a
18: 3 4.4 ± 0.29a 4.3 ± 0.3a 4 .0 ± 0.1a Greengram
PUSA BISAKI 26.2 ± 0.5b 24.9 ± 0.3b 23.56 ± 0.7a
16:0 7.4 ± 0.3b 5.8 ± 0.3a 5.46 ± 0.2a
18:0 7.3 ± 0.2a 11.9 ± 0.1b 14.8 ± 0.2c
18: 1 43.7 ± 0.2b 42 .9 ± 0.1b 37.4 ± 0.4a
18: 2 15.1 ± 0.3b 13.7 ± 0.4b 11.0 ± 0.6a
18: 3
KDM-1 26.0 ± 0.5b 25.5 ± 0.3b 23.9 ± 0.03a
16:0 8.9 ± 0.2b 7.9 ± 0.2ab 6.7 ± 0.5a
18:0 7.8 ± 0.7a 10 ± 0.3b 13.7 ± 0.4c
18: 1 40.0 ± 0.5a 39.7 ± 1.0a 36.8 ± 0.5a
18: 2 17.5 ± 0.4a 16.9 ± 0.8a 15.36 ± 1.0a
18: 3
CHINA MOONG 28.0 ± 0.4a 27.1 ± 0.3a 26.0 ± 0.6a
16:0 6.8 ± 0.15a 6.0 ± 0.2a 5.3 ± 0.5a
18:0 6.3 ± 0.2a 9.5 ± 0.2b 13.6 ± 0.4c
18:1 26.2 ± 0.5b 24.9 ± 0.3b 23.56 ± 0.7a
18:2 7.4 ± 0.3b 5.8 ± 0.3a 5.46 ± 0.2a
18:3 7.3 ± 0.2a 11.9 ± 0.1b 14.8 ± 0.2c
in CHINA MOONG from 0.003 g to 0.005 g and 0.01 g in the control and in samples stored for three and six months. Peroxide value increased in PUSA BISAKI from 2.6 meq to 3.1 meq and 3.6 meq, whereas in KDM-1 it increased from 1.4 meq to 2.8 meq and 3.7 meq and in CHINA MOONG it increased from1.4 meq to 2.4 meq and 2.8 meq (Table 7).
The fatty acids detected by GLC analysis were palmitic, stearic, oleic, linoleic, and linolenic ac-ids. In TTB-7 samples no significant difference in a reduction in stearic acid and palmitic acid was observed whereas linoleic and linolenic ac-ids were significantly reduced during storage. In BRG-1 variety, a significant decrease in linoleic and linolenic acids was found out and in ICP-8863 a significant decrease in stearic acid and linoleic acid was determined whereas there was no sig-nificant reduction in palmitic acid and linolenic acid (Table 8).
The fatty acid composition of greengram varie-ties during storage was analysed: among them, in PUSA BISAKI the contents of palmitic, stearic, linoleic and linolenic acid were significantly re-duced during storage whereas the oleic acid con-tent was significantly increased during six- month storage. In the KDM-1 variety fatty acid contents of palmitic and stearic acids were significantly re-duced and a significant increase in oleic acid was found out. In var. CHINA MOONG, a significant reduction was observed only in linoleic acid fol-lowed by a significant increase in the oleic acid content (Table 9).
diSCuSSion
The study shows that significant changes can occur in redgram and greengram samples during six-month storage with respect to lipid composi-tion. We can conclude from the present investi-gation that the fungi are mainly responsible for deterioration of grains by excessive moisture, which is in tune with earlier studies (Pitt & Hocking 2009). Earlier work showed that the lipase activity of storage fungi of aspergillus sp. and Fusarium sp. increased the free fatty acid level (Kakde & Chavan 2011; kamimura et al. 2001; Burkert et al. 2004). A widely used chemical index of de-terioration is the increase of fat acidity in stored seeds. It has been suggested that fat acidity arises from the action of seed lipases (Fsatnaught et
and they shed more light on the fate of lipid con-stituents in detail during storage. According to a previous report (Pearce & Abdel Samad 1980), oleic acid is not susceptible to the attack of lipoxy-genase when compared to other polyunsaturated fatty acids. This might be the reason for an increase in the percentage of oleic acid with respect to the total fatty acid percentage during storage.
The results of the study show that storage en-hances the role of the lipolytic activity of grains, which results in a decrease of total lipids and triglycerides, and in an increase in phospholipids, free fatty acids and peroxide values. In the total fatty acid composition, palmitic, stearic, linoleic, linolenic acids were decreased while oleic acid was increased. The investigation clearly indicates the effect of storage on the activation and deactiva-tion of seed lipases in biodeterioradeactiva-tion of lipids during storage.
References
Anonymous (1996): International Rules for Seed Testing Association. Seed Science and Technology, 29: 335. Anonymous (2003): International Rules for Seed
Test-ing. Moisture Content Determination. International Seed Testing Association, Chapter 9: 3–4.
Bernal Lugo I., Leopold A.C. (1992): Changes in soluble carbohydrates during seed storage. Physiologia Plantarum, 98: 1207–1210.
Bhattacharya K., Raha S. (2002): Deteriorative changes of maize, groundnut and soybean seeds by fungi storage. Mycopathologia, 55: 135–141.
Buck A.L. (1981): New equations for computing vapor pressure and enhancement factor. Journal of Applied Meterology, 20: 1527–1532.
Burkert T.F., Maugeri F.M., Rodrigues M.I. (2004): Optimization of extracelluar lipases production by
Geotrichum sp. using factorial design. Bioresources Technology, 910: 77–84.
Chaiyasit W., Elias R.J., McClements D.J., Decker E.A. (2007): Role of physical structures in bulk oils on lipid oxidation. Critical Reviews in Food Science and Nutrition, 47: 299–317.
Dhingra O.D., Jham G.N., Rodrigues F.A., Silva G.J. jr., Costa M.L.N. (2009): Fumigation with essential oil of mustard retards fungal growth and accumulation of ergosterol and free fatty acid in stored shelled ground-nuts. Journal of Stored Products Research, 45: 24–31. Doworth C., Christensen C.M. (1968): Influence of
moisture content and storage time upon changes in
the fungus flora, germinability and fat acidity values of soybean. Phytopathology, 58: 1457–1459.
Fastnaught C.E., Berglund P.T., Dudgeon A.L., Had-ley M. (2006): lipid changes during storage of milled hul-less barley products. Cereal Chemistry, 83: 424–427. Fletcher M.J. (1968): A colorimetric method for
es-timating serum triglycerides. ClinicaChimica Acta,
22: 393–397.
Goodman J.J. (1950): Adaptive production of amylase and lipase by three species of fungi. Science, 112: 176–179.
Kakde R.B., Chavan A.M. (2011): Extracelluar lipase enzyme production by seed-borne fungi under the influence of physical factors. International Journal of Biology, 3: 94–100.
Kamimura E.S., Medieta O., Rodrigues M.I., Maugeri F. (2001): Studies on lipase-affinity adsorp-tion using response-surface analysis. Biotechnology and Applied Biochemistry, 33: 153–159.
Lisker N.A., Ben-Efraim A., Henis Y. (1985): Fungi grow-ing on stored soybeans and their significance in lipid break down. Annals of Applied Biology, 107:117–126. Lapčík O., Hill M., Černý I., Lachman J.,
Al-Ma-harik N., Adlercreutz H., Hampl R. (1999): Im-munoanalysis of isoflavonids in Pisum sativum and
Vigna radiata. Plant Science, 148: 111–119.
Mbata G.N. (1986). The susceptibility of variety of
groundnuts to infestation by tribolium castaneum
during storage. Tropical Science, 26: 187–194. Mbata G.N. Osuji F.N. (1983): Some aspects of the
biology of Plodia interpuctella (Huber) (Lepidoptera:
Pfryalidae), a pest of stored groundnuts in Nigeria. Journal ofStored Product Research, 19: 141–151. Millner M., Geddes W.F. (1946a): Grain storage
stud-ies. III. The relationship between moisture content, mold growth and respiration of soybeans. Cereal Chemistry, 23: 225–247.
Millner M., Geddes W.F. (1946b): Grain storage stud-ies. IV. Biological and chemical factors involved in spontaneous heating of soybeans. Cereal Chemistry,
23: 449–470.
Modgil R., Mehta U. (1996): Effect of graded levels of insect infestation on the chemical composition of bengalgram. Journal of Food Science and Technology,
33: 393–396.
Morrison W.R., Smith L.M. (1964): Preparation of fatty acid methyl esters and dimethylacetals from lipids with boron fluoride-methanol. Journal of Lipid Research,5: 600–608.
Ojimelukwe P.C., Onweluzo J.C., Okechukwu E. (1999): Effects of infestation on the nutrient content and physicochemical properties of two cowpea varie-ties. Plant Food for Human Nutrition, 53: 321–332. Patro K.C., Sahoo P. (2001): Effect of different levels
of Callosobruchus chinensis (L.) infestation on dete-rioration pigeon pea and greengram seeds. Legume Research, 24: 109–111.
Pearce R.S., Abdel Samad I.M. (1980): Change in fatty acid content of polar lipids during ageing of seeds of peanut (arachis hypogea L.). Journal of Experimental Botany, 31: 1283–1290.
Pitt J.I., Hocking A.D. (eds) (2009): Fungi and Food Spoilage. 3rd Ed. Springer, New York: 417
Priestly D.A., Leopold A.C. (1983a): Lipid changes during natural aging of soybean seeds. Physiologia Plantarum,59: 467–470.
Priestly D.A., Leopold A.C. (1983b): Lipid changes during natural aging of soybean seeds. Physiologia Plantarum, 59: 467–470.
Sharma S., Gambir S., Munshi S.K. (2007): Changes in lipid and carbohydrates composition of germinat-ing soybean seeds under different storage conditions. Asian Journal of Plant Sciences, 6: 502–507.
Stewart J.C.M. (1980): Colorimetric determination of phospholipids with ammonium ferrothiocyanate. Analytical Biochemistry, 104: 10–14.
Stine C.M., Harland H.A., Coulter S.T., Jenness R.A. (1953): Modified peroxide test for peroxide test for detection of lipid oxidation in dairy products. Journal of Dairy Research, 37: 202–208.
Tripathy M.K., Sahoo Das B.C., Mohanty S. (2001): Efficacy of botanicals oils, plant powders and extracts against Callosobruchus chinensis (Linn) attacking blackgram. Legume Research, 24: 82–86.
Vick B.A., Zimmerman D.C. (1976): Lipoxygenase and hydroperoxide lyase in germination in watermelon seedlings. Plant Physiology, 57: 780–788.
Received for publication December 29, 2010 Accepted after corrections July 7, 2011
Corresponding author:
Dr.Mysore Ranganayaka Gopinath, University of Mysore, Department of Studies in Applied Botany