© 2019, IRJET | Impact Factor value: 7.211 | ISO 9001:2008 Certified Journal
| Page 5793
SEISMIC ANALYSIS OF G+6 FRAME BUILDING USING ETABS
VIJAYALAXMI V HADADI
1, SUDHA S MARERA
2, SWATHI T
3, MEGHANA S B
41
VIJAYALAXMI V HADADI, Student, Dept. of Civil Engineering
2
SUDHA S MARERA, Student, Dept. of Civil Engineering
3
SWATHI T, Student, Dept. of Civil Engineering
4
MEGHANA S B, Student, Dept. of Civil Engineering
5
CHAITRA M N, Assistant Professor, Dept. of Civil Engineering, S. T. J. Institution of technology, Karnataka, India
6
D S MAGANUR, H.O.D, Dept. of Civil Engineering, S. T. J. Institution of technology, Karnataka, India
---***---Abstract –
Seismic Analysis of any type of structure is animportant consideration while working in high earthquake prone areas. With the help of seismic analysis, the structure can be designed and constructed to withstand the high lateral moment if earth crust during an earthquake. Any type of basic or highly advanced structure which may be under static or dynamic conditions can be evaluated by using ETABS.ETABS is a coordinated and productive tool for analysis and designs which range from simple 2D frames to modern high rises which makes it one of the best structural software for building software for building systems. A G+6 storey building of different shaped frame structures is considered for this study.
Key Words:ETABS-2015, Seismic Analysis, Time Period, Story Drift, Base Shear, Story Stiffness.
1. INTRODUCTION
The main aim is to generate and perform linear static analysis of 4 different shapes of structure: Rectangular, H-Shaped, C-H-Shaped, L-Shaped and to compare their results for Time period, Base shear, Story drift, Story stiffness. It is expected that these structures will sustain all the loads and deformations of normal construction and have adequate durability and resistance to seismic effects.
Generally structural designers are prone to use linear static analysis which is also known as first order analysis to compute the response of a structure such as design force, moments and displacements resulting from loads acting on the structure. In case of first order analysis only the small deflections moments are considered. Additional effect due to the deformation of the structure under vertical loads are neglected.
2. MODELLING OF RCC FRAME
We have considered a 3D RCC frame with the dimensions for 4 different shapes. These shapes have same area. The 4 shapes are as follows:
1. Rectangular plan 2. H-shaped plan 3. C-shaped plan 4. L-shaped plan
(a) (b)
[image:1.595.300.566.509.728.2]
(c) (d)
Fig 1: Plan (a) Rectangular shaped (b) H-shaped (c) C- shaped (d) L-shaped of the building.
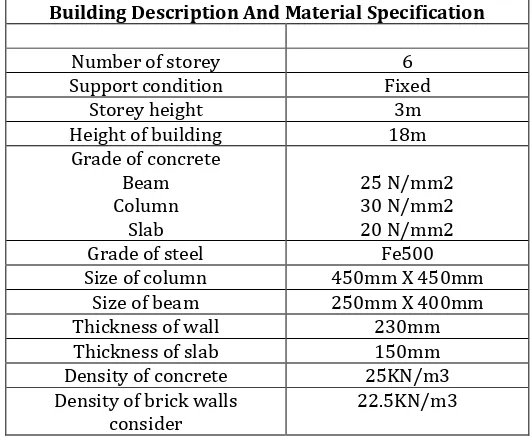
Table 1
Building Description And Material Specification
Number of storey 6
Support condition Fixed
Storey height 3m
Height of building 18m
Grade of concrete Beam Column
Slab
25 N/mm2 30 N/mm2 20 N/mm2
Grade of steel Fe500
Size of column 450mm X 450mm
Size of beam 250mm X 400mm
Thickness of wall 230mm
Thickness of slab 150mm
Density of concrete 25KN/m3
Density of brick walls
© 2019, IRJET | Impact Factor value: 7.211 | ISO 9001:2008 Certified Journal
| Page 5794
3. LOADING
The structures are acted upon by different loads such as dead load, live load, earthquake load.
1. Self-weight of structure comprises of weight of the beam, column and slab of the structure.
2. Dead load of the structure consists of wall load, parapet wall load and floor load according to IS 875 – part 1.
I. Wall load = (weight unit of brick masonry * thickness of wall * height of wall)
= 22.5kN/m3 * 0.23m * 3m = 15.525kN/m3.
II. Wall load (parapet wall at top floor)
= (weight unit of brick masonry * thickness of wall * height of wall)
= 22.5kN/m3 * 0.115m * 1.5m = 3.88KN/m.
3. Live load: It consists of floor load which is taken as 3KN/m2 and roof load as 1.5kN/m2 according to IS 875 part-2.
4. Seismic load: The different seismic parameters are taken as follows, IS 1893 part 1 : 2002
1. Seismic zone : II (Z=0.10)
2. Soil type : II
3. Importance factor : 1 4. Response reduction factor: 3 5. Dumping : 5%
4. LOADING COMBINATION
The structural systems were subjected following load combinations as per provisions of IS 1893-2002 (Part I),
Clause 6.3.1, that deals with “Criteria for Earthquake Resistant Design of Structures”.
Analysis is carried out for gravity loads using partial safety factor as 1.5. The followingLoads have been considered in the structural analysis and design as per IS code 456-2000.
1. D-Dead load
2. LL- live load 3. EQ- Earthquake
Table 2
LOAD COMBINATIONS REMARKS
1.5(DL+LL) * DL - Dead load of the structure
* LL - Live load of the structure * EQX - Earthquake load
along X direction * EQY - Earthquake load
along Y direction 1 1.5(DL ± EQX)
1.5(DL ± EQY) (0.9DL ± 1.5EQX) (0.9DL ± 1.5EQY) 1.2(DL+LL±EQX) 1.2(DL+LL±EQY)
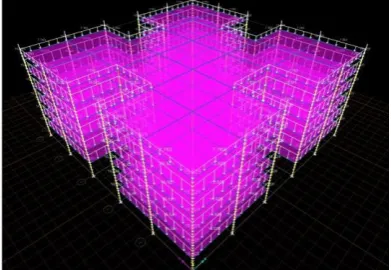
[image:2.595.333.535.119.248.2]5. MODELLING IN ETABS
[image:2.595.336.532.276.411.2]Fig 2: 3-D view of 6-storeys Rectangular shape building
[image:2.595.337.531.435.570.2]Fig 3: 3-D view of 6-storeys H-shape building
[image:2.595.338.531.596.735.2]Fig 4: 3-D view of 6-storeys C-shape building
© 2019, IRJET | Impact Factor value: 7.211 | ISO 9001:2008 Certified Journal
| Page 5795
6. RESULTS AND DISCUSSIONS
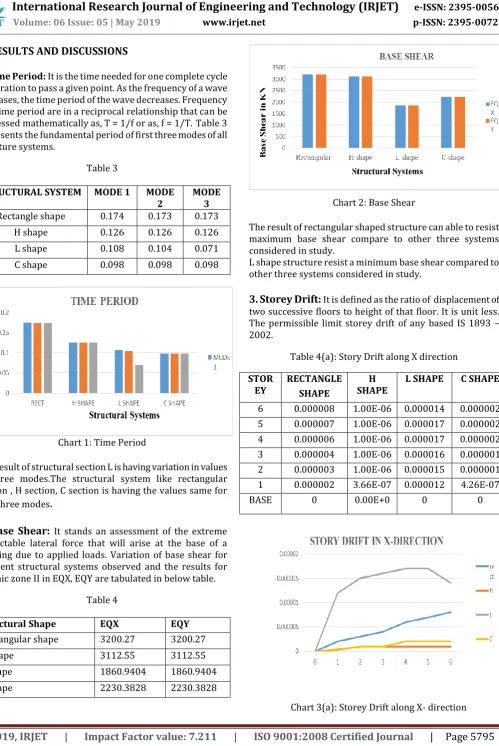
[image:3.595.59.559.49.796.2]1. Time Period:
It is the time needed for one complete cycle
of vibration to pass a given point. As the frequency of a wave increases, the time period of the wave decreases. Frequency and time period are in a reciprocal relationship that can be expressed mathematically as, T = 1/f or as, f = 1/T.Table 3 represents the fundamental period of first three modes of all structure systems.Table 3
STRUCTURAL SYSTEM MODE 1 MODE
2 MODE 3
Rectangle shape 0.174 0.173 0.173
H shape 0.126 0.126 0.126
L shape 0.108 0.104 0.071
C shape 0.098 0.098 0.098
Chart 1: Time Period
The result of structural section L is having variation in values in three modes.The structural system like rectangular section , H section, C section is having the values same for first three modes
.
[image:3.595.304.564.54.248.2]2. Base Shear:
It stands an assessment of the extreme predictable lateral force that will arise at the base of a building due to applied loads. Variation of base shear for different structural systems observed and the results for seismic zone II in EQX, EQY are tabulated in below table.Table 4
Structural Shape EQX EQY
Rectangular shape 3200.27 3200.27
H shape 3112.55 3112.55
L shape 1860.9404 1860.9404
C shape 2230.3828 2230.3828
Chart 2: Base Shear
The result of rectangular shaped structure can able to resist maximum base shear compare to other three systems considered in study.
L shape structure resist a minimum base shear compared to other three systems considered in study.
3. Storey Drift:
It isdefined as the ratio of displacement of two successive floors to height of that floor. It is unit less. The permissible limit storey drift of any based IS 1893 – 2002.Table 4(a): Story Drift along X direction
STOR
EY RECTANGLE SHAPE SHAPE H L SHAPE C SHAPE
6 0.000008 1.00E-06 0.000014 0.000002 5 0.000007 1.00E-06 0.000017 0.000002 4 0.000006 1.00E-06 0.000017 0.000002 3 0.000004 1.00E-06 0.000016 0.000001 2 0.000003 1.00E-06 0.000015 0.000001 1 0.000002 3.66E-07 0.000012 4.26E-07
BASE 0 0.00E+0 0 0
[image:3.595.34.300.232.500.2]
© 2019, IRJET | Impact Factor value: 7.211 | ISO 9001:2008 Certified Journal
| Page 5796
The results of structural system L section can able to resistmaximum storey drift compared to other three structures. H shaped structure resist a Minimum storey drift compared to the other three structures.
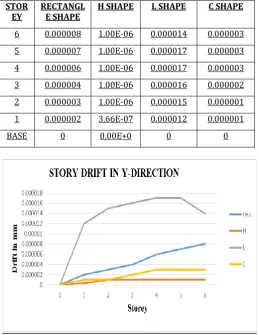
Table 3(b): Storey Drift along Y-direction
STOR
EY RECTANGLE SHAPE H SHAPE L SHAPE C SHAPE
6 0.000008 1.00E-06 0.000014 0.000003
5 0.000007 1.00E-06 0.000017 0.000003
4 0.000006 1.00E-06 0.000017 0.000003
3 0.000004 1.00E-06 0.000016 0.000002
2 0.000003 1.00E-06 0.000015 0.000001
1 0.000002 3.66E-07 0.000012 0.000001
BASE 0 0.00E+0 0 0
Chart 3(b): Storey Drift along Y-direction
The results of structural system L section can able to resist maximum storey drift compared to other three structures. H shaped structure resist a Minimum storey drift compared to the other three structures.
4. Storey Stiffness: The storey stiffness of a storey is a generally defined has ratio of to storey drift. storey shear
Table 4(a): Storey Stiffness along X-direction
STOR
EY RECTANGLE SHAPE
H SHAPE L
SHAPE C SHAPE
6 10214568 48002694
7 23246957 311052534 5 20024831 92498855
0 32408146 543893206 4 30203010 13113731
14 38911094 763504459
3 45802246 18769980
99 44831417 1125486771 2 74930868 29361404
59 49684829 1855317010 1 12127123 48396955
11 61624446 3152826453
Chart 4(a): Storey Stiffness along X-direction
Storey stiffness value is maximum in X direction. H shape structure is increases as compared to all other shapes like rectangle shape, L shape, C shape.
Table 4(b): Storey Stiffness along Y-direction
STOREY RECTANG LE SHAPE
H SHAPE L SHAPE C SHAPE
6 10189065
3 480026947 23246957 167633354
5 20017632
5 924988550 32408146 314326710
4 30203455
0 1311373114 38911094 442522783
3 45814791
7 1876998099 44831417 633080494
2 75007356
0 2936140459 49684829 976377911
1 12165228
71 4839695511 61624446 1472863079
[image:4.595.277.564.54.336.2] [image:4.595.34.294.175.511.2]© 2019, IRJET | Impact Factor value: 7.211 | ISO 9001:2008 Certified Journal
| Page 5797
Storey stiffness value is maximum in Y direction. H shape [image:5.595.326.543.92.277.2]structure is increases as compared to all other shapes like rectangle shape, L shape, C shape.
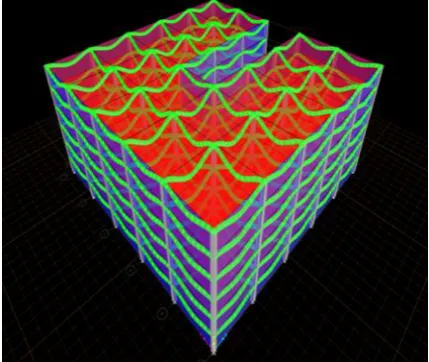
Fig 6: 3D view of Rectangular Section after Seismic analysis
[image:5.595.47.279.138.309.2]Fig 7: 3D view of H-Section after Seismic Analysis
[image:5.595.55.270.350.543.2]Fig 8: 3D view of C-Section after Seismic Analysis
Fig 9: 3D view of L-Section after Seismic Analysis
7. CONCLUSIONS
1. Analysis was done by using ETABS software successfully verified manually as per IS456:2000 and IS 1893-2002 (Part I), Clause 6.3.1, that deals with “Criteria for Earthquake Resistant Design of Structures”.
2. Calculation by both manual work as well as software analysis gives almost same result.
3. Usage of ETABS software minimizes the required for analysis design.
4. The plan configurations of structure has significant impact on the seismic response of structure in terms of displacement, story drift, story shear, time period.
5. As the result, in X and y direction the story displacement/drift is increased in L structure as compared with other structure like rectangular, H –shape, and C shape and it is observed that the storey drift for the stories are found to be within the permissible limits.
6. In X and Y direction the story stiffness is increased in L structure as compared with other structure like rectangular, H –shape, and C shape.
7. Base shear in X and Y direction is same for all structures like rectangular, H –shape, and C shape, with increase in load.
8. Story stiffness valve is maximum in X and Y direction of H shape structure compared to other structure.
REFERENCES
[1] Pamela Jennifer J P, Jegidha. K. J and Sureshbabu. S
[image:5.595.54.269.573.754.2]© 2019, IRJET | Impact Factor value: 7.211 | ISO 9001:2008 Certified Journal
| Page 5798
[2]ETABS – 02 Introductory Tutorial Steel: Watch & Learnfrom YouTube published on 23rd April 2013.
[3]IS 1893-1 (2002): Criteria for Earthquake Resistant Design of Structure, Part 1: General Provisions and Buildings [CED 39: Earthquake Engineering].
[4]IS 456 (2000): Plain and Reinforced Concrete - Code of Practice [CED 2: Cement and Concrete]
[5] Milind V. Mohod, “Effect of shaped and plan configuration on seismic response of structure,”International Journal of Scientific & Technology Research, Volume 4, Issue on 09 September 2015.
[6]Mohammed Rizwan Sultan, “Dynamic analysis of multi-storey building for different shapes,” International Journal of Innovative Research in Advanced Engineering (IJIRAE), Volume 2, Issue on August 2015.
[7]Sameer Pardeshi, “Study of seismic analysis and design of multi storey symmetrical and asymmetrical building,” International Research Journal of Engineering and Technology (IRJET), Volume 3, Issue on 01 January 2016.
BIOGRAPHIES
VIJAYALAXMI V HADADI Student,
Dept. of civil Engineering S T J I T Ranebennur
SUDHA S MARERA Student,
Dept. of civil Engineering S T J I T Ranebennur
SWATHI T Student,
Dept. of civil Engineering S T J I T Ranebennur
MEGHANA S B Student,
Dept. of civil Engineering S T J I T Ranebennur
CHAITRA M N Assistant professor, Dept. of civil engineering S T J I T Ranebennur
D S MAGANUR