4-Bromothiobenzamide
Mahmood-ul-Hassan Khan,aShahid Hameed,a* Tashfeen Akhtaraand Jason D. Masudab
a
Department of Chemistry, Quaid-i-Azam University, Islamabad 45320, Pakistan, andbDepartment of Chemistry, Saint Mary’s University, Halifax, Nova Scotia, Canada B3H 3C3
Correspondence e-mail: [email protected]
Received 14 May 2009; accepted 14 May 2009
Key indicators: single-crystal X-ray study;T= 296 K; mean(C–C) = 0.004 A˚; Rfactor = 0.035;wRfactor = 0.087; data-to-parameter ratio = 21.6.
The title compound, C7H6BrNS, crystallizes with two
mol-ecules in the asymmetric unit. The dihedral angles between the aromatic ring and the thioamide fragment are 23.6 (4) and 20.5 (3) in the two molecules. In the crystal, there are intermolecular N—H S hydrogen-bonding interactions between the amine group and the S atoms.
Related literature
For the uses of thioamides, see: Akhtar et al. (2006, 2007, 2008); Jagodzinskiet al.(2003). For the biological activity of thioamides, see: Weiet al.(2006); Klimesovaet al.(1999). For the synthesis of thioamides, see: Kaboudinet al.(2006); Cava et al. (1985). For related crystal structures, see: Khan et al. (2009); Jianet al.(2006); Manaka & Sato (2005).
Experimental
Crystal data
C7H6BrNS Mr= 216.10 Monoclinic,P21=c a= 19.6325 (11) A˚
b= 10.6101 (6) A˚
c= 7.8859 (5) A˚ = 100.078 (1)
V= 1617.31 (16) A˚3 Z= 8
MoKradiation = 5.26 mm1
T= 296 K
0.210.170.09 mm
Data collection
Bruker APEXII CCD diffractometer
Absorption correction: multi-scan (SADABS; Bruker, 2008)
Tmin= 0.384,Tmax= 0.620
12968 measured reflections 3911 independent reflections 2706 reflections withI> 2(I)
Rint= 0.025
Refinement
R[F2> 2(F2)] = 0.035 wR(F2) = 0.087
S= 1.03 3911 reflections
181 parameters
H-atom parameters constrained
max= 0.82 e A˚
3
min=0.78 e A˚
3
Table 1
Hydrogen-bond geometry (A˚ ,).
D—H A D—H H A D A D—H A
N2—H2A S2i 0.86 2.73 3.583 (2) 172 N2—H2B S1ii
0.86 2.65 3.500 (2) 173 N1—H1A S1iii
0.86 2.78 3.605 (3) 160 N1—H1B S2ii 0.86 2.71 3.523 (2) 158
Symmetry codes: (i)x;yþ1 2;zþ
1
2; (ii)x;yþ1;zþ1; (iii)x;yþ 3 2;zþ
1 2.
Data collection:APEX2(Bruker, 2008); cell refinement:SAINT (Bruker, 2008); data reduction:SAINT; program(s) used to solve structure:SHELXS97(Sheldrick, 2008); program(s) used to refine structure: SHELXL97 (Sheldrick, 2008); molecular graphics: ORTEP-3 for Windows(Farrugia, 1997); software used to prepare material for publication:SHELXTL(Sheldrick, 2008).
The authours thank the HEC, Pakistan, for a Ph.D. fellowship awarded to MuHK under the indiginous Ph.D. Program. JDM thanks Saint Mary’s University for funding.
Supplementary data and figures for this paper are available from the IUCr electronic archives (Reference: BT2956).
References
Akhtar, T., Hameed, S., Al-Masoudi, N. A. & Khan, K. M. (2007).Heteroat. Chem.18, 316–322.
Akhtar, T., Hameed, S., Al-Masoudi, N. A., Loddo, R. & La Colla, P. (2008).
Acta Pharm.58, 135–149.
Akhtar, T., Hameed, S., Lu, X., Yasin, K. A. & Khan, M. H. (2006).X-ray Struct. Anal. Online,22, x307–x308.
Bruker (2008).APEX2,SAINTandSADABS. Bruker AXS Inc., Madison, Wisconsin, USA.
Cava, M. P. & Levinson, M. I. (1985).Tetrahedron,41, 5061–5087. Farrugia, L. J. (1997).J. Appl. Cryst.30, 565.
Jagodzinski, T. S. (2003).Chem. Rev.103, 197–227.
Jian, F. F., Zhao, P., Zhang, L. & Zheng, J. (2006).J. Fluorine Chem.127, 63–67. Kaboudin, B. & Elhamifar, D. (2006).Synthesis Stuttgart, pp. 224–226. Khan, M.-H., Hameed, S., Akhtar, T. & Masuda, J. D. (2009).Acta Cryst.E65,
o1128.
Klimesova, V., Svoboda, M., Waisser, K. K., Kaustova, J., Buchta, V. & Kra’lova, K. (1999).Eur. J. Med. Chem.34, 433–440.
Manaka, A. & Sato, M. (2005).Synth. Commun.35, 761–764. Sheldrick, G. M. (2008).Acta Cryst.A64, 112–122.
Wei, Q.-L., Zhang, S.-S., Gao, J., Li, W.-H., Xu, L.-Z. & Yu, Z.-G. (2006).
Bioorg. Med. Chem.14, 7146–7153. Acta Crystallographica Section E
Structure Reports Online
supporting information
Acta Cryst. (2009). E65, o1333 [doi:10.1107/S1600536809018273]
4-Bromothiobenzamide
Mahmood-ul-Hassan Khan, Shahid Hameed, Tashfeen Akhtar and Jason D. Masuda
S1. Comment
Thioamides are biologically active compounds, possessing a wide spectrum of activities (Klimesova et al., 1999; Wei et
al., 2006). They have enormous practical and synthetic applicability and their importance and impact as synthetic
intermediates is continuously growing (Jagodzinski et al., 2003). Thioamides are generally synthesized using Lawesson's
reagent (Cava et al., 1985) or phosphorus penta sulfide (Kaboudin et al., 2006). In this article, we wish to report the
crystal structure of 4-bromobenzothioamide, which was synthesized by treating 4-bromobenzonitrile with 70% sodium
hydrogen sulfide hydrate and magnesium chloride hexahydrate (Manaka & Sato, 2005) in continuation of our previous
work on the synthesis and biological screenings of five membered heterocycles (Akhtar et al., 2006, 2007, 2008).
The hydrogen bonding interactions between the nitrogen and sulfur atoms (3.500 (2)Å to 3.605 (3) Å) are in the range
of those seen in p-trifluoromethylbenzothioamide where the corresponding interactions are between 3.3735Å and
3.5133Å (Jian et al., 2006) and in the analogus chloride compound where the N···S distances are 3.3769 (15)Å and
3.4527 (15)Å (Khan et al., 2009).
S2. Experimental
The slurry of 70% sodium hydrogen sulfide hydrate (21.98 mmol) and magnesium chloride hexahydrate (10.99 mmol)
was prepared in DMF (40 mL). 4-Bromobenzonitrile (11.0 mmol) was added to the slurry and the mixture stirred at room
temperature for 2 h. The resulting mixture was poured into water (100 mL) and the precipitated solid collected by
filtration. The product obtained was resuspended in 1 N HCl (50 ml), stirred for another 30 min, filtered and washed with
excess water. The recrystallization of the product from chloroform afforded the crystals of 4-bromobenzothioamide
suitable for X-ray analysis.
S3. Refinement
The hydrogen atoms were placed in geometrically idealized positions of 0.93Å (aromatic C—H) and 0.86Å (amide N—
Figure 1
Molecular structure of 4-bromobenzothioamide showing displacement ellipsoids at the 50% probability level (for non-H
atoms).
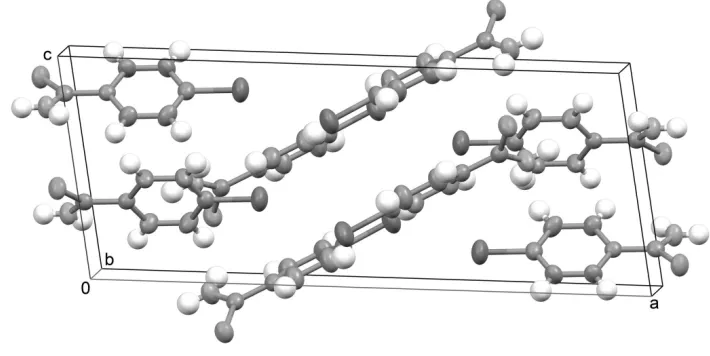
Figure 2
Packing diagram of 4-bromobenzothioamide. Displacement ellipsoids are shown at the 50% probability level (for non-H
atoms).
4-Bromothiobenzamide
Crystal data
C7H6BrNS Mr = 216.10 Monoclinic, P21/c
Hall symbol: -P 2ybc a = 19.6325 (11) Å b = 10.6101 (6) Å c = 7.8859 (5) Å β = 100.078 (1)° V = 1617.31 (16) Å3
F(000) = 848 Dx = 1.775 Mg m−3
Mo Kα radiation, λ = 0.71073 Å Cell parameters from 3900 reflections θ = 2.2–26.9°
µ = 5.26 mm−1 T = 296 K Block, yellow
[image:3.610.125.480.324.502.2]Data collection
Bruker APEXII CCD diffractometer
Radiation source: fine-focus sealed tube Graphite monochromator
φ and ω scans
Absorption correction: multi-scan (SADABS; Bruker, 2008) Tmin = 0.384, Tmax = 0.620
12968 measured reflections 3911 independent reflections 2706 reflections with I > 2σ(I) Rint = 0.025
θmax = 28.3°, θmin = 2.1° h = −25→25
k = −13→14 l = −10→10
Refinement
Refinement on F2
Least-squares matrix: full R[F2 > 2σ(F2)] = 0.035 wR(F2) = 0.087 S = 1.03 3911 reflections 181 parameters 0 restraints
Primary atom site location: structure-invariant direct methods
Secondary atom site location: difference Fourier map
Hydrogen site location: inferred from neighbouring sites
H-atom parameters constrained w = 1/[σ2(F
o2) + (0.0372P)2 + 0.7786P]
where P = (Fo2 + 2Fc2)/3
(Δ/σ)max = 0.001
Δρmax = 0.82 e Å−3
Δρmin = −0.78 e Å−3
Special details
Geometry. All e.s.d.'s (except the e.s.d. in the dihedral angle between two l.s. planes) are estimated using the full covariance matrix. The cell e.s.d.'s are taken into account individually in the estimation of e.s.d.'s in distances, angles and torsion angles; correlations between e.s.d.'s in cell parameters are only used when they are defined by crystal symmetry. An approximate (isotropic) treatment of cell e.s.d.'s is used for estimating e.s.d.'s involving l.s. planes.
Refinement. Refinement of F2 against ALL reflections. The weighted R-factor wR and goodness of fit S are based on F2,
conventional R-factors R are based on F, with F set to zero for negative F2. The threshold expression of F2 > σ(F2) is used
only for calculating R-factors(gt) etc. and is not relevant to the choice of reflections for refinement. R-factors based on F2
are statistically about twice as large as those based on F, and R- factors based on ALL data will be even larger.
Fractional atomic coordinates and isotropic or equivalent isotropic displacement parameters (Å2)
x y z Uiso*/Ueq
Br2 0.315314 (16) 0.36346 (4) 0.36641 (5) 0.07035 (13)
Br1 0.538072 (18) 0.69050 (5) 1.27120 (5) 0.08477 (16)
S2 −0.04123 (4) 0.26135 (7) 0.39188 (10) 0.05003 (18)
S1 0.21328 (4) 0.52885 (7) 0.75427 (10) 0.05230 (19)
N2 −0.03383 (11) 0.4881 (2) 0.2688 (3) 0.0473 (6)
H2A −0.0119 0.5515 0.2367 0.057*
H2B −0.0780 0.4916 0.2623 0.057*
C1 0.23831 (13) 0.6495 (2) 0.8875 (3) 0.0412 (6)
C9 0.07643 (12) 0.3842 (2) 0.3369 (3) 0.0342 (5)
C12 0.21855 (13) 0.3743 (3) 0.3549 (3) 0.0429 (6)
C10 0.10919 (14) 0.4633 (2) 0.2364 (4) 0.0459 (6)
H10A 0.0831 0.5200 0.1618 0.055*
C14 0.11668 (14) 0.3004 (3) 0.4448 (3) 0.0474 (7)
H14A 0.0956 0.2466 0.5131 0.057*
C5 0.44606 (15) 0.6804 (3) 1.1491 (4) 0.0558 (8)
C13 0.18748 (14) 0.2945 (3) 0.4535 (4) 0.0515 (7)
H13A 0.2137 0.2366 0.5260 0.062*
C11 0.18020 (15) 0.4589 (3) 0.2457 (4) 0.0498 (7)
H11A 0.2018 0.5127 0.1785 0.060*
N1 0.19425 (12) 0.7375 (2) 0.9174 (3) 0.0554 (6)
H1A 0.2082 0.7985 0.9867 0.067*
H1B 0.1517 0.7338 0.8675 0.067*
C2 0.31088 (13) 0.6623 (2) 0.9781 (3) 0.0408 (6)
C6 0.40650 (16) 0.7873 (3) 1.1197 (4) 0.0622 (8)
H6A 0.4250 0.8654 1.1563 0.075*
C3 0.35274 (15) 0.5562 (3) 1.0060 (4) 0.0549 (7)
H3A 0.3351 0.4783 0.9659 0.066*
C7 0.33903 (15) 0.7780 (3) 1.0352 (4) 0.0540 (7)
H7A 0.3119 0.8502 1.0162 0.065*
C4 0.42000 (16) 0.5644 (3) 1.0919 (4) 0.0639 (9)
H4A 0.4475 0.4926 1.1110 0.077*
Atomic displacement parameters (Å2)
U11 U22 U33 U12 U13 U23
Br2 0.03962 (17) 0.0895 (3) 0.0834 (3) 0.00005 (15) 0.01476 (15) 0.00159 (19) Br1 0.04511 (19) 0.1196 (4) 0.0842 (3) −0.00878 (19) −0.00386 (16) −0.0108 (2) S2 0.0434 (4) 0.0390 (4) 0.0685 (5) −0.0063 (3) 0.0120 (3) 0.0056 (3) S1 0.0465 (4) 0.0459 (4) 0.0626 (5) −0.0022 (3) 0.0043 (3) −0.0081 (3) N2 0.0398 (12) 0.0358 (12) 0.0667 (15) 0.0016 (9) 0.0101 (11) 0.0030 (11) C1 0.0427 (14) 0.0402 (14) 0.0415 (14) 0.0002 (11) 0.0096 (11) 0.0055 (11) C9 0.0400 (13) 0.0271 (12) 0.0358 (13) −0.0022 (10) 0.0076 (10) −0.0035 (10) C12 0.0405 (14) 0.0435 (15) 0.0448 (15) −0.0022 (12) 0.0078 (11) −0.0071 (12) C10 0.0485 (15) 0.0347 (14) 0.0566 (17) 0.0078 (12) 0.0150 (12) 0.0086 (12) C14 0.0444 (15) 0.0515 (17) 0.0459 (15) −0.0021 (12) 0.0067 (12) 0.0152 (13) C5 0.0392 (15) 0.078 (2) 0.0497 (17) −0.0057 (15) 0.0057 (12) −0.0030 (15) C8 0.0428 (13) 0.0305 (13) 0.0375 (13) −0.0018 (10) 0.0065 (10) −0.0057 (10) C13 0.0420 (15) 0.0607 (18) 0.0499 (16) 0.0040 (13) 0.0023 (12) 0.0138 (14) C11 0.0552 (17) 0.0372 (15) 0.0628 (18) −0.0003 (13) 0.0261 (14) 0.0071 (13) N1 0.0442 (13) 0.0528 (15) 0.0659 (16) 0.0090 (11) 0.0004 (11) −0.0115 (12) C2 0.0395 (13) 0.0418 (15) 0.0420 (14) 0.0003 (11) 0.0099 (11) 0.0036 (11) C6 0.0509 (18) 0.063 (2) 0.072 (2) −0.0100 (15) 0.0088 (15) −0.0202 (17) C3 0.0483 (16) 0.0439 (16) 0.069 (2) −0.0015 (13) 0.0022 (14) 0.0035 (14) C7 0.0518 (17) 0.0471 (17) 0.0633 (19) −0.0007 (13) 0.0108 (14) −0.0083 (14) C4 0.0477 (17) 0.058 (2) 0.082 (2) 0.0054 (15) 0.0008 (15) 0.0080 (17)
Geometric parameters (Å, º)
Br2—C12 1.890 (3) C14—C13 1.381 (4)
Br1—C5 1.896 (3) C14—H14A 0.9300
S2—C8 1.675 (3) C5—C6 1.371 (5)
S1—C1 1.674 (3) C5—C4 1.379 (5)
N2—H2A 0.8600 C11—H11A 0.9300
N2—H2B 0.8600 N1—H1A 0.8600
C1—N1 1.322 (3) N1—H1B 0.8600
C1—C2 1.484 (4) C2—C3 1.388 (4)
C9—C14 1.380 (3) C2—C7 1.389 (4)
C9—C10 1.388 (3) C6—C7 1.378 (4)
C9—C8 1.486 (3) C6—H6A 0.9300
C12—C13 1.364 (4) C3—C4 1.377 (4)
C12—C11 1.373 (4) C3—H3A 0.9300
C10—C11 1.384 (4) C7—H7A 0.9300
C10—H10A 0.9300 C4—H4A 0.9300
C8—N2—H2A 120.0 C12—C13—C14 119.3 (3)
C8—N2—H2B 120.0 C12—C13—H13A 120.3
H2A—N2—H2B 120.0 C14—C13—H13A 120.3
N1—C1—C2 116.9 (2) C12—C11—C10 119.5 (3)
N1—C1—S1 121.5 (2) C12—C11—H11A 120.3
C2—C1—S1 121.58 (19) C10—C11—H11A 120.3
C14—C9—C10 118.0 (2) C1—N1—H1A 120.0
C14—C9—C8 120.0 (2) C1—N1—H1B 120.0
C10—C9—C8 122.0 (2) H1A—N1—H1B 120.0
C13—C12—C11 120.8 (3) C3—C2—C7 118.3 (3)
C13—C12—Br2 118.7 (2) C3—C2—C1 119.6 (2)
C11—C12—Br2 120.4 (2) C7—C2—C1 122.1 (2)
C11—C10—C9 120.8 (2) C5—C6—C7 119.3 (3)
C11—C10—H10A 119.6 C5—C6—H6A 120.3
C9—C10—H10A 119.6 C7—C6—H6A 120.3
C9—C14—C13 121.5 (2) C4—C3—C2 121.1 (3)
C9—C14—H14A 119.2 C4—C3—H3A 119.4
C13—C14—H14A 119.2 C2—C3—H3A 119.4
C6—C5—C4 121.1 (3) C6—C7—C2 121.0 (3)
C6—C5—Br1 120.0 (2) C6—C7—H7A 119.5
C4—C5—Br1 118.9 (2) C2—C7—H7A 119.5
N2—C8—C9 118.1 (2) C3—C4—C5 119.1 (3)
N2—C8—S2 120.9 (2) C3—C4—H4A 120.5
C9—C8—S2 120.96 (18) C5—C4—H4A 120.5
C3—C1—C2—S1 23.6 (3) C14—C8—C9—S2 20.5 (3)
Hydrogen-bond geometry (Å, º)
D—H···A D—H H···A D···A D—H···A
N2—H2A···S2i 0.86 2.73 3.583 (2) 172
N2—H2B···S1ii 0.86 2.65 3.500 (2) 173
N1—H1A···S1iii 0.86 2.78 3.605 (3) 160
N1—H1B···S2ii 0.86 2.71 3.523 (2) 158