Large-Scale Automatic K-Means Clustering for
Heterogeneous Many-Core Supercomputer
Teng Yu, Wenlai Zhao, Pan Liu, Vladimir Janjic, Xiaohan Yan, Shicai Wang
Haohuan Fu, Guangwen Yang, John Thomson
Abstract—This paper presents an automatick-meansclustering solution targeting the Sunway TaihuLight supercomputer. We first introduce a multi-level parallel partition approach that not only partitions by dataflow and centroid, but also by dimension, which unlocks the potential of the hierarchical parallelism in the heterogeneous many-core processor and the system architecture of the
supercomputer. The parallel design is able to process large-scale clustering problems with up to 196,608 dimensions and over 160,000 targeting centroids, while maintaining high performance and high scalability. Furthermore, we propose an automatic hyper-parameter determination process fork-meansclustering, by automatically generating and executing the clustering tasks with a set of candidate hyper-parameter, and then determining the optimal hyper-parameter using a proposed evaluation method. The proposed
auto-clustering solution can not only achieve high performance and scalability for problems with massive high-dimensional data, but also support clustering without sufficient prior knowledge for the number of targeted clusters, which can potentially increase the scope ofk-meansalgorithm to new application areas.
Index Terms—Supercomputer, Heterogeneous Many-core Processor, Data Partitioning, Clustering, Scheduling, AutoML
F
1
INTRODUCTION
K-means is a well-known clustering algorithm, used widely in many AI and data mining applications, such as bio-informatics [2], [25], image segmentation [10], [24], information retrieval [38] and remote sensing image analysis [27].
For modern big-data applications, an intelligent cluster-ing solution usually faccluster-ing two major challenges. Firstly, finding the optimal solution for a generalk-meansproblem is known to be NP-hard [13]. Thus, current high-end k-meansapplications are limited in terms of the number of dimensions (d), and the number of centroids (k) they can consider, leading to demand for more parallel k-means implementations [3], [27]. Secondly, to determine proper hyper-parameters, such as the targeted number of centroids (k) ink-means, are one of the toughest problems especially in newly involved application areas, due to the massive raw data without sufficient prior knowledge for clustering. This also leading to an emerging research topic known as AutoML [19]. However, existing AutoML systems are mostly focused on designing the optimization algorithms
• T.Yu, V.Janjic and J.Thomson are with University of St Andrews, UK. E-mail:{ty33,vj32,j.thomson}@st-andrews.ac.uk.
W.Zhao, P.Liu, H.Fu and G.Yang are with Tsinghua Univer-sity and National Supercomputer Centre in Wuxi, China. E-mail:
{zhaowenlai,liupan15,haohuan,ygw}@tsinghua.edu.cn.
S.Wang is with Wellcome Trust Sanger Institute, UK. E-mail: [email protected].
X.Yan is with University of California, Berkeley, US. E-mail: xiao-han [email protected].
• W.Zhao is the corresponding author.
• This work is supported in part by the EPSRC grants ”Dis-covery” EP/P020631/1, ”ABC: Adaptive Brokerage for the Cloud” EP/R010528/1, and the National Key R&D Program of China (Grant No. 2017YFE0123600), and by the China Postdoctoral Science Foundation (Grant No. 2018M641359), and by the Center for High Performance Computing and System Simulation of Pilot National Laboratory for Marine Science and Technology (Qingdao).
for hyper-parameter searching, and are limited by the scale of targeted problems.
In this paper, we present an auto-clustering solution based on a supercomputer system. Targeting the above challenges, we make the following two main contributions.
We propose a novel parallel design of k-means with multi-level partition targeting Sunway TaihuLight, one of the world’s fastest supercomputers. This design allows k-means to scale well across a large number of compu-tation nodes, significantly outperforming previously posed techniques. Evaluation results show that the pro-posed design is able to process large-scale clustering prob-lems with up to 196,608 dimensions and 160,000 centroids, while maintaining high performance and scalability, which is a large improvement on previous implementations, as described in Table 1.
Furthermore, we propose and implement an auto-clustering process based on the parallel algorithm design, including four new features: a) a task generator to automat-ically generate clustering tasks according to a number of candidate hyper-parameters; b) a self-aware method to do the automatic dataflow partition for the generated tasks; c) a fairness resource allocator with a task scheduler to launch the clustering tasks to the supercomputer system; d) an evaluation method to determine the best hyper-parameter candidate based on the clustering results.
With a highly scalable algorithm design and an auto-matic hyper-parameter determination process, our method can greatly increases the potential scope fork-means appli-cations to solve previously intractable problems.
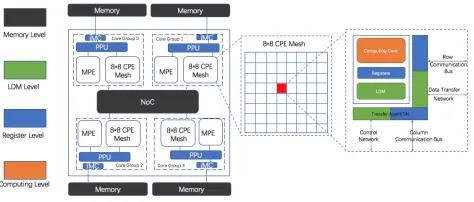
state-Fig. 1. The general architecture of the SW26010 many-core processor
of-the-art supercomputer-oriented designs in the literature. Section 3 discusses the three levels scalable design and im-plementation ofk-meanson Sunway. Section 4 discusses the auto-clustering process design and implementation. Evalu-ation results and analysis are given in Section 5.
2
BACKGROUND
2.1 Sunway TaihuLight and SW26010 Many-Core Pro-cessor
Sunway TaihuLight is a world-leading supercomputer, which currently ranks as the third in the TOP500 list [30] and achieves a peak performance of 93 petaflops [17].
Sunway TaihuLight uses the SW26010 many-core proces-sor. The basic architecture of SW26010 is shown in Figure 1. Each processor contains fourcore groups (CGs). There are 65 cores in each CG, 64computing processing element (CPEs)and a managing processing element (MPE), which are organized as 8 by 8 mesh. The MPE and CPE are both complete 64-bit RISC cores, but they are assigned different tasks while computing. The MPE is designed for management, task schedule, and data communications. The CPE is assigned to maximize the aggregated computing throughput while minimize the complexity of the micro-architecture.
The SW26010 design differs significantly from the other multi-core and many-core processors: (i) for the memory hi-erarchy, while the MPE applies a traditional cache hierarchy (32-KB L1 instruction cache, 32-KB L1 data cache, and a 256-KB L2 cache for both instruction and data), each CPE only supplies a 16-KB L1 instruction cache, and depends on a 64 KBLocal directive Memory (LDM)(also known asScratch Pad Memory (SPM)) as a controlled fast buffer. The user-controlled ’cache’ leads to some increasing programming difficulties for using fast buffer efficiently, at the same time, providing the opportunity to implement a defined buffering scheme which is beneficial to improve the whole perfor-mance in certain cases. (ii) As for the internal information of each CPE mesh, we have a control network, a data transfer network (connecting the CPEs to the memory interface), 8 column communication buses, and 8 row communication buses. The 8 column and row communication buses pro-vide possibility for fast register communication channels to across the 8 by 8 CPE mesh, so users can attain a significant data sharing capability at the CPE level.
2.2 Problem Definition
The purpose of thek-means clustering algorithm is to find a group of clusters to minimize the mean distances between
samples and their nearest centroids. Formalized, given n samples,Xd ={xd
i | xdi ∈ Rd, i ∈ {1, ..., n}}, where each sample is ad-dimensional vectorxd
i = (xi1,. . . ,xid) and we useuto index the dimensions:u∈ {1. . . d}. We aim to find k d-dimensional centroidsCd={cd
j |cdj ∈Rd, j∈ {1. . . k}} to minimize the objectO(C):
O(C) = 1 n
n
X
i=1
dis(xdi, cda(i))
Wherea(i) =arg minj∈{1...k}dis(xdi, cdj)is the index of the nearest centroid for samplexdi,dis(xdi, cdj)is theEuclidean distance between samplexd
i and centroidcdj:
dis(xdi, cdj) = v u u t
d
X
u=1
(xiu−cju)2
In the literature, several methods have been proposed to find efficient solutions [6], [12], [15], [32], [33], [36]. While the most popular baseline is still theLloydalgorithm [31], which is composed by repeating the basic two steps below:
1.: a(i) =arg minj∈{1...k}dis(xdi, c d
j) (Assign)
2.: cdj =
P
arg a(i)=jxdi
|arg a(i) =j| (U pdate)
We also need to chose an initial set of centroids. Note that those notations here are mainly from previous works by Hamerly [21], Newling and Fleuret [32]. We will apply cus-tomized notations only when needed. The first step above is to assign each sample into the nearest centroid according to theEuclideandistance. The second step is to update the centroids by moving them to the mean of their assigned samples in thed-dimensional vector space. Those two steps are repeated until eachcd
j is fixed.
2.3 Related Works
2.3.1 General Parallelk-means
k-meansalgorithm has been widely implemented in paral-lel architectures with shared and distributed memory using either SIMD or MIMD model targeting on multi-core proces-sors [5], [14], [20], GPU-based heterogeneous systems [28], [39], [41], clusters of computer/cloud [11], [22].
In the parallel case, we use l to index the processors (computing units)P(P={Pl}, l∈ {1. . . m}), and usemto denote the total number of processors applied. The dataset Xd is partitioned uniformly into mprocessors. Compared withLloydalgorithm, each processor is assigns a subset (mn) of samples from the original setXd
[image:2.612.56.293.45.146.2]TABLE 1
Parallelk-meansImplementations
Approaches Hardware Programming model Samplesn Clustersk Dimensionsd
General Parallelk-meansImplementations
B ¨ohm, et al [5] Multi-core MIMD/SIMD 107 40 20
Hadian and Shahrivari [20] Multi-core multi-thread 109 100 68
Zechner and Granitzer [41] GPU CUDA 106 128 200
Li, et al [28] GPU CUDA 107 512 160
Haut, et al [22] Cloud OpenStack 108 8 58
Cui, et al [11] Cluster Hadoop 105 100 9
Supercomputer-Orientedk-meansImplementations
Kumar, et al [27] J aguar, Oak Ridge MPI 1010 1000 30
Cai, et al [7] Gordon, SDSC mclappy (parallel R) 106 8 8
Bender, et al [3] T rinity, NNSA OpenMP 370 18 140,256
Our approach Sunway,Wuxi DMA/MPI 106 160,000 196,608
2.3.2 Large-scale Parallelk-meanson Supercomputers
In addition to general parallel k-means implementations, other customized k-means implementation targeting on supercomputers are more related to our work here.
Kumar, et al [27] implemented the dataflow-partition based parallel k-means on the J aguar, a Cray XT5 su-percomputer at Oak Ridge National Laboratory evaluated by real-world geographical datasets. Their implementation applys MPI protocols to achieve broadcasting and reducing and originally scaled the value ofkto more than 1,000s level. Cai, et al [7] designed a similar parallel approach on Gordon, a Intel XEON E5 supercomputer at San Diego Supercomputer Center for grouping game players. They applied a parallel R function,mclapply, to achieve shared-memory parallelism and test different degree of parallelism by partitioning the original data-flow into different numbers of sets. They did not focus on testing the scalability of their approach but evaluated on the quality of the cluster.
Bender, et al [3] investigated a novel parallel implemen-tation proposed for T rinity, the latest National Nuclear Security Administration supercomputer with Intel Knight’s Landing processors and theirscratchpadtwo-level memory model. Their approach is the most state-of-the-art compara-ble work against our proposed methods which can not only partition dataflow, but also partition the number of target clusterskby theirhierarchicaltwo-level memory support - cache associated with each core andscratchpadfor share. Adapted originally from [18], their partitioning algorithm partitioned the input dataset into ndM sets, whereM is the size of the scratchpad, and then reduced kndM centroids recursively if needed. Based on this partition, their approach scaleddinto 100,000s level.
A fundamental bottleneck in their approach is that based on only two-level memory, it is still impossible to partition and then scale bothkanddindependently. This leads to the interaction constraint betweenkanddas discussed in their paper:
Z < kd < M
where Z is the size of cache. This partition-based method is not efficient if allkcentroids could fit into one cache. In practice, this limits the value ofk to be less than 18 andd to be greater than 152,917 in their experiments. We claim that our proposed approach with underlining data parti-tioning methods based on hierarchical many-core processors
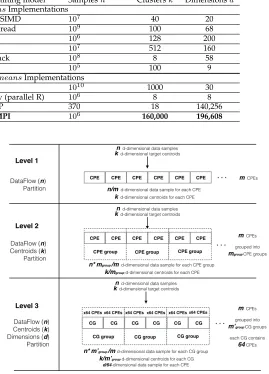
Fig. 2. Three-levelk-meansdesign for data partition and parallelism on Sunway architecture
achieves the needed multi-level fully nkd partition with architectural support to thoroughly solve this bottleneck.
We formalize the background work of both general parallelk-meansand supercomputer-oriented implementa-tions as shown in Table 1.
3
MULTI-LEVEL LARGE-SCALE
k-means
DESIGN The scalability and performance of parallelk-means algo-rithm on large-scale heterogeneous systems and supercom-puters are mainly bounded by the memory and bandwidth. To achieve efficient large-scale k-means on the Sunway supercomputer, we explore the hierarchical parallelism on our heterogeneous many-core architecture. We demonstrate the proposed scalable methods on three parallelism levels by how we partition the data.• Level 1 -DataF lowPartition: Store a whole sample andkcentroids on single-CPE
• Level 2 -DataF low and CentroidsPartition: Store
• Level 3 - DataF low, Centroids and Dimensions
Partition: Store a whole sample on multi-CPE whilst kcentroids on Multi-CG andddimensions on Multi-CPE
An abstract graph of how we partition the data into multiple levels is presented in Figure 2.
3.1 Level 1 - DataFlow Partition
Algorithm 1Basic Parallelk-means
1: INPUT:Input datasetX ={xi|xi∈Rd, i∈[1, n]}, and initial centroid setC={cj|cj∈Rd, j∈[1, k]}
2: Pl load
←−−− C, l∈ {1. . . m}
3: repeat
4: // Parallel execution on all CPEs:
5: forl= 1to mdo
6: Init a local centroids setCl={cl
j|clj=0, j∈[1, k]}
7: Init a local counter countl = {countl
j|countlj = 0, j∈[1, k]}
8: fori= (1 + (l−1)∗ n
m)to(l∗ n m)do
9: Pl
load
←−−−xi
10: a(i) =arg minj∈{1...k}dis(xi, cj)
11: cla(i)=cla(i)+xi
12: countla(i)=countla(i)+ 1
13: end for
14: forj=1to kdo
15: AllReducecljandcountlj
16: cl
j = cl
j
countl j
17: end for
18: end for
19: untilCl==C
20: OUTPUT:C
In the simple case, we run the first step, Assign, on each CPE in parallel while using multi-CPE collaboration to implement the second step,U pdate. The pseudo code of this case is shown in Algorithm 1.
The Assign step is implemented in a typical parallel way. Given n samples, we partition into multiple CPEs. Each CPE (Pl) firstly reads one sample xi and finds the minimum distances dis from itself to all centroids cj to obtain a(i). Then two variables are accumulated for each cluster centroid cj according toa(i), shown in line 11 and 12. The first variable stores the vector sum of all the samples assigned tocj, notated ascla(i). The second variable counts
the total number of samples assigned to cj, notated as countl
a(i).
In the U pdate step, we first accumulate the cl j and countl
j of all CPEs by performing two AllReduce opera-tions, so that all CPEs can obtain the assignment results of the whole input dataset. We useregister communication [43] to implement intra-CG AllReduce operation and use MPI AllReduce for inter-CG AllReduce. After the accu-mulation, the U pdate step is performed to calculate new centroids, as shown in line 15.
Analysis
Considering a one-CG task, we analyse the constraints on scalability in terms of memory limitation of each CPE. Based
on the steps above, one CPE has to accommodate at least one samplexi, all cluster centroidsC,kcentroids’ accumulated vector sumClandkcentroids’ counterscountl. Considering that each CPE has a limited size of LDM, we obtain the constraint (C1) below:
C1: d(1 +k+k) +k≤LDM
Since both the number of centroidskand the dimensiond for each samplexishould at least be 1, we obtain two more boundary constraints (C2) and (C3) below, separately:
C2: 3d+ 1≤LDM
C3: 3k+ 1≤LDM
Now we analyse the performance under bandwidth bounds. Note that theAssignstep of computinga(i)for each sample xiis completed fully in parallel on themCPEs. Given the bandwidth of multi-CPE architecture to be B, the DMA time of reading data from main memory can be simply formalized as:
Tread: (n∗d
m +k∗d)/B
Theoretically, a linear speedup for computing time to at most n times against the serial implementation can be obtained for theAssignstep if we can applym =nCPEs in total.
The two AllReduce operations are the bottleneck process in theU pdatestep. Theregister communicationtechnique for internal multi-CPE communication guarantees a high-performance with a normally 3x to 4x speedup than other on-chip and Internet communication techniques (such as DMA and MPI) for this bottleneck process (referring to the experimental configuration section for detailed quantitative values). Given the bandwidth of register communication to beR, the time for the AllReduce process can be formal-ized as:
Tcomm: n
m((1 +d)∗k)/R
3.2 Level 2 - DataFlow and Centroids Partition
To scale the number ofkfor cluster centroidsC, we use multiple (up to 64) CPEs in one CG to partition the set of centroids. The number of CPEs grouped to partition the centroids is denoted bymgroup. For illustration, we use l0 to index the CPE groups{P}. Then we have:
{P}l0 :={Pl}, l∈(1 + (l0−1)∗mgroup, l0∗mgroup)
The pseudo code of this case is shown in Algorithm 2. To partition k centroids on mgroup CPEs, we need to do a new sub-step against the previous case as shown in line 2. Then different from the Assign step in above case, we partition each data samplexi in each CPE group as shown in line 8. After that, allPl in each {P}l0 can still compute
a partial value of a(i) (named as a(i)0) fully in parallel without communication. We need to do one more step by data communication between CPEs in each CPE group to obtain the final a(i) as shown in line 10.
Algorithm 2Parallelk-meansfork-scale
1: INPUT:Input datasetX ={xi|xi∈Rd, i∈[1, n]}, and initial centroid setC={cj|cj∈Rd, j∈[1, k]}
2: Pl
load
←−−− cj j ∈ (1 + mod(mlgroup−1 ) ∗
k
mgroup, (mod(
l−1
mgroup) + 1)∗
k mgroup)
3: repeat
4: // Parallel execution on each CPE group{P}l0:
5: forl0 = 1to m
mgroup do
6: Init a local centroids setCl0
and countercountl0
7: fori =(1 + (l0−1)n∗mgroup
m )to(l
0n∗mgroup
m ) do
8: {P}l0 ←load−−−xi
9: a(i)0=arg minjdis(xi, cj)
10: a(i) =min. a(i)0
11: cl0
a(i)=c
l0 a(i)+xi
12: countl0
a(i)=count
l0 a(i)+ 1
13: end for
14: for j = (1 + mod(ml−1
group) ∗
k
mgroup) to
((mod(ml−1
group) + 1)∗
k mgroup)do
15: AllReducecl0
j andcountl
0
j
16: clj0 = c
l0 j
countl0 j
17: end for
18: end for
19: until∪ Cl0 ==C
20: OUTPUT:C
only computes values of subset of centroidsCand does not need further communications in this step as it only needs to store this subset.
Analysis
To analyse the scalability of k in this case, the amount of original kcentroids distributed in mgroup CPEs leads to a easier constraint ofkagainst the (C3) above:
C03: 3k+ 1≤mgroup ∗LDM (mgroup≤64) Based on this, we can also easily scale the (C1) as follow:
C01: d(1 +k+k) +k≤mgroup ∗LDM (mgroup≤64) Note that we still need to accommodate at least one d-dimensional sample in one CPE, so the (C2) should be kept
as before:C02:=C2
As for performance, since mgroup CPEs in one group should read the same sample simultaneously, the processors need more time to read the input data samples than the first case, but only partial cluster centroids need to be read by each CPE:
T0read: (
n∗d∗mgroup
m +
k mgroup
∗d)/B
As for the data communication needed, there is one more bottleneck process (line 12) than before. Comparing against the above cases, multiple CPE groups can be allocated in different processors. Those communication need to be done through MPI which is much slower than internal processor multi-CPEsregister communication. Given the bandwidth of network communication through MPI to beM, we obtain:
T0comm: k mgroup
/R+n∗mgroup
m ((1 +d)∗k))/M
3.3 Level 3 - DataFlow and Centroids and Dimensions Partition
Algorithm 3Parallelk-meansfork-scale andd-scale
1: INPUT:Input datasetX ={xi|xi∈Rd, i∈[1, n]}, and initial centroid setC={cj|cj∈Rd, j∈[1, k]}
2: CGl00 ←load−−−cdj, l00∈ {1. . .m
64}, j∈(1 +mod(
l00−1
m0 group)∗
k m0
group, (mod(
l00−1
m0
group) + 1)∗
k m0
group)
3: repeat
4: // Parallel execution on each CG group{CG}l00:
5: forl00= 1to m64do
6: Init a local centroids setCl00
and countercountl00
7: fori =(1 + (l00−1)n∗m0group
m )to(l
00n∗m0group
m ) do
8: foru =(1 +mod(l−641)∗ d
64 to(mod(
l−1
64) + 1)∗
d
64) do
9: CGl00←xi(Pl←xui)
10: end for
11: a(i)0=arg minjdis(xi, cj)
12: a(i) =min. a(i)0
13: cl00
a(i)=c
l00 a(i)+xi
14: countl00
a(i)=count
l00 a(i)+ 1
15: end for
16: for j = (1 + mod( l00−1
m0 group
) ∗ k
m0 group
) to
((mod( l00−1
m0 group
) + 1)∗ k
m0 group
)do
17: AllReducecl00
j andcountl
00
j
18: clj00 = c
l00 j
countl00 j
19: end for
20: end for
21: until∪ Cl00 ==C
22: OUTPUT:C
To scale the number of dimension d for each sample xi and further scale k, we store and partition one d-dimensional sample by one CG with 64 CPEs and then implement the algorithm on multiple CGs. The pseudo code of this case is shown in Algorithm 3.
Recall we use u to index the data dimension: u ∈ (1. . . d); Now we use l00 to index the CGs and m0group to denote the number of CGs grouped together to partition k centroids. Consider that we apply m CPEs in total and each CG contains 64 CPEs, then we havel00 ∈ (1, . . . ,64m), m0group≤ m
64and:
CGl00:={Pl}, l∈(1 + 64(l00−1), 64l00)
To partition k centroids on multiple CGs, we obtain an updated step against the previous case as shown in line 2. To partition each d-dimensional samplexd
i on 64 CPEs in one CG, we obtain the following step as shown in line 9.
Similar to the above case, all CGl00 in each CG group
Analysis
In this case, each CG with 64 CPEs accommodates one d-dimensional samplexi. Then we can scale the previous (C2)
as follow:
C002: 3d+ 1≤64∗LDM
Consider we use totally m0group CGs to accommodate k centroids in this case, then (C3) will scale as follow:
C003: 3k+ 1≤m0group∗64∗LDM
Note that the domain ofm0group seems limited by the total number of CPEs applied,m. But in fact, this number can be large-scale as we target on the supercomputer with tens of millions of cores. Finally, (C1) will scale as follow:
C001: d(1 +k+k) +k≤64∗m0group∗LDM which is equal to:
C001: d(1 +k+k) +k≤m∗LDM
C001 is the breakthrough contribution over other
state-of-the-art work [3]: the total amount ofd∗kis not limited by a single or shared memory size any more. It is fully scalable by the total number of processors applied (m). In a modern supercomputer, this value can be large-scaled up-to tens of millions when needed.
Considering performance, note that m0group CGs (64 CPEs in each) in one group should read the same sample simultaneously. In another aspect, each CPE only needs to read a partial of the given d-dimension of original data sample together with a partial of k centroids similarly as before, then we obtain a similar reading time:
T00read: (
n∗d∗m0
group
m +
k m0
group
∗ d
64)/B (1)
Comparing against the above cases, multiple CGs in CG groups allocated in different many-core processors need communication to update centroids through MPI. Given the bandwidth of network communication through MPI to be M, the cost between multiple CG groups can be formalized as:
T00comm: ( k m0
group
+n∗m
0
group
m ((1 +d)∗k))/M (2)
The network architecture of Sunway TaihuLight is a two-level fat tree. 256 computing nodes are connected via a customized inter-connection board, forming asuper-node. All super-nodes are connected with a central routing server. The intra super-node communication is more efficient than the inter super-node communication. Therefore, in order to improve the overall communication efficiency of our design, we should make a CG group located within a super-node if possible.
4
AUTO-CLUSTERING
PROCESS
Based on the parallelk-means design, we further propose an auto-clustering process to determining the optimal hyper-parameter (k) for applications that is lack of prior clustering knowledge. The key idea is that we can run the clustering with a set of candidate hyper-parameters, and then provide
a method to evaluate the best candidate hyper-parameter(s) based on the clustering results.
We first described the method to determine the optimal hyper-parameter (k) for thek-means algorithm on a given input set. Then we introduce our design to solve two prac-tical problems - how to automaprac-tically select the data parti-tioning method to process the workload when the value ofk changes, and how to allocate resources of a supercomputer for different instances of thek-means algorithm.
4.1 Determinig the optimal k
The number of clustering (k) need to be predetermined for typical k-means algorithms. As claimed in the survey [42], how to define this value is a critical question in the community, and inappropriate decision would yield poor quality of clustering results.
Shi, et al. [37] proposed a basic method by gradually increasing the possible number of clusters and used the result when the distortion of solutions between current k andk-1 is less than a static predefined threshold. Chen, et al. [9] recently presented a method without any predefined threshold. It generates a formula by computing the differ-ence between sum of distance inside and outside clusters.
While this formulation didn’t work in large-scale cases as it keeps monotonous increasing when the k is greater than 2.
To solve this problem with a supercomputing-based approach, we introduce the notion of cluster radius r(k) tok-meansclustering. To be specific, r(k)is defined to be the smallest non-negative real number such that the sample setXd
can be covered bykclosed balls centered at sample points with radiusr(k). In other words,
r(k) = inf{t:∃y1, . . . , ykinRd,Xd⊆
[
1≤s≤k
B(ys, t)},
whereB(ys, t)stands for the Euclidean closed ball centered atyswith radiust. For instance, whenk=nthe number of samples, we haver(n) = 0. It is easy to see thatr(k)is non-increasing with respect tok. Radius has been widely used in clustering problems, such as approximating clustering [1] and incremental clustering [8], but not onk-means, because it is impossible to compute and measure all possible radius values on large-scale datasets. Fornsamples clustering into kcentroids, there will beO(nk)possible solutions.
With the support of modern supercomputer with effi-cient parallel processing techniques, we apply an empirical way by using a minim radius from a random selection of solutions with k centroids, named r0(k) to represent the r(k). With the increasing of k, the accurate of r0(k) will decrease. Ther0(k)will even increase at some point when it is too difficult to give a show a reasonable representation ofr(k)byr0(k)from a limited selection of solutions. This also indicates that to keep increasing the targeted centroids (k) beyond this points becomes meaningless as it cannot easily reduce the distance and distinguish the difference from different clusters. So the idea of determining the bestk is by measuring the change ofr0(k)with respect tor(k). If
r0(k)does not keep the same route ofr(k), we would regard thiskas a satisfying choice. Rigorously speaking, let
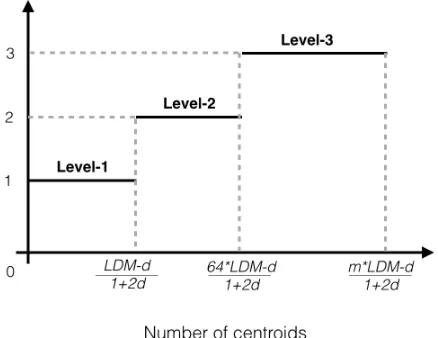
Fig. 3. Self-aware Roofline Model for Auto Data Partitioning
then our optimalk is taken as the first time this function ∆r0increasing.
4.2 Self-aware Auto Dataflow Partition
A self-aware method to auto partition dataflow into 3 levels based on the targeting k values. This method is mainly guided by the scalability of each level of data partition-ing. Based on the limitations presented in formulations (C1,C01,C001) above, we can easy compute the range of
possible k values for each level: k ≤ LDM−d
1+2d for level-1, k≤ 64LDM−d
1+2d for level-2 andk≤
m∗LDM−d
1+2d for level-3. By concatenating the ranges, we obtain the self-aware 3-stage roofline model to guide the data partitioning as shown in figure 3.
4.3 Fairness Resource Allocation and Task Scheduler
Algorithm 4Resource Allocation Algorithm
1: INPUT:Cost functionT00(k, m, m0), number of CPEsp, number of CPEs per CGq, number of pointsn
2: fori=1ton/2−1do
3: mi=q;m0i = 0
4: end for
5: remProc =p−(n−1)∗q
6: whileremProc>0do
7: i=argminnj=1−1T00(j, mj, m0j)
8: mi=mi+q; remProc=remProc−q
9: end while
10: fori=1tokdo
11: m0i=argminmi,j|mi
j=1 T00(i, mi, j)
12: end for
13: OUTPUT:{m1, . . . , mn−1, m01, . . . , m0n−1}
Dividing the resources of a supercomputer between the n/2instances of thek-means algorithm can be looked at as a scheduling problem, where we need to schedulen/2 het-erogeneous tasks on a given set of resources. The tasks are heterogeneous because, for differentk,k-means algorithm will do different partitioning of the data (see the previous
section) which yields different degree of parallelism and different reading, computation and communication costs. Therefore, dividing the resources uniformly between the instances of the algorithm (tasks) will be sub-optimal. Fur-thermore, it is not possible to statically compute the precise cost of executing one instance of the algorithm on a given set of resources because, in addition to the reading (equation 1) and communication (equation 2) time that can easily be estimated, there is also a computation time that depends on the number of iteration for a particular value ofk and a particular input, and this number cannot be computed statically. Therefore, we need to use some heuristics for resource allocation.
We will focus on resource allocation for level-3 par-titioning, as that is the most complex of the three cases we consider. The approach we take in this paper is to use a cost function, T00(k, m, m0group), as an estimation of the cost of executing an instance of k-means on m CPEs andm0
group CPE groups for each centroid. For brevity, we will annotatem0group withm0. The scheduling problem can then be seen as the optimisation problem of finding the minimum of the function:A(m1, . . . , mn
2, m
0
1, . . . m0n−1) =
Pn2
i=1T00(i, mi, m0i) with the following constraints: 1 ≤ mi ≤ p (fori ∈ {1, . . . ,n2}),
Pn2
i=1mi ≤ p,0 ≤ m0i ≤ p
q (fori ∈ {1, . . . , n
2}),
Pn2 i=1m
0
i = p q, m
0
i|mi; (fori ∈
{1, . . . ,n2}wherepis the total number of CPEs andqis the number of CPEs per group (64in our case). Due to a way in which the data partitioning is done, we will require eachm to cover at least one core group, i.e. to be a multiple of641. We useT00(k, m, m0) = Tread00 (k, m, m0) +Tcomm00 (k, m, m0) as a cost function, whereTread00 andTcomm00 are given in the equations 1 and 2.
The algorithm that we use to solve the posed optimisa-tion problem is given in Algorithm 4, which is based on a greedy approach. Note that, in theory, for level-3 scheduling we would need to consider allocation of individual CPEs (level-1), CGs (level-2) and CG groups (level-3) to the in-stances of thek-means algorithm. However, we will simplify the problem by assuming that no CG will share its resources between different instances of the algorithm. Therefore, the basic unit of allocation will be CG. The parameters of the algorithm are cost function, T00, number of available CPE groups (CGs),p, number of CPEs per CG,q, and the number of pointsn.
We initially allocate one CG and zero CG groups to each of the n/2 instances of the k-means algorithm (lines 2–4). Then, in successive iterations, we add one more CG to the instance which has the highest cost (therefore reducing its cost), until all of the CGs are allocated (lines 6–9). This, effectivelly, gives us the assignment of m1, m2, . . . , mn−1.
mi will be the number of CGs allocated to the instance i multiplied by q (64 in our case). Once we have decided on the number of CGs for instances, we divide these CGs into CG groups, finding, for each instance, the grouping that minimisedT00 (line 11). This gives us the assignment ofm01, m02, . . . , m0k.
If we assume that the number of CGs is a constant, then Algorithm 4 is quadratic with respect to the number of
TABLE 2
Benchmarks from UCI and ImgNet
Data Set n k d
Kegg Network 6.5E4 256 28
Road Network 4.3E5 10,000 4
US Census 1990 2.5E6 10,000 68
ILSVRC2012 (ImgNet)
1.3E6 160,000 196,608
ONCOLOGY and
LEukemia
4.3E3 unknown 54,675
pointsn. Considering that the number of points for the use cases in Section 5 is of the order of magnitude of 1,000,000, this is not overly expensive and can be calculated pretty quickly. The algorithm, of course, does not find an optimal allocation, as such allocation is impossible to calculate be-cause the number of iterations that the algorithm takes for eachktakes is not known before the execution, but it still manages to find good allocation of resources.
5
EVALUATION
5.1 Experimental Design and Metrics
The datasets we applied in experiments come from well-known benchmark suites including UCI Machine Learn-ing Repository [34] and ImgNet [23]. We briefly present the datasets in Table 2, where the first three normal size benchmarks (Kegg Network, Road Network, US Census 1990) are from UCI and the final high-dimensional benchmarks (ILSVRC2012) are from ImgNet.
The experiments have been conducted to demonstrate scalability, high performance and flexibility by increasing the number of centroidskand number of dimensionsdon multiple benchmarks with vary data sizen. The three-level designs are tested targeting different benchmarks. Different hardware setup will be provided for testing different scal-able levels:
• Level 1 - One SW26010 many-core processor is ap-plied, which contains 256 64-bit RISC CPEs running at 1.45 GHz, grouped in 4 CGs in total. 64 KB LDM buffer is associated with each CPE and 32 GB DDR3 memory is shared for the 4 CGs. The theoretical memory bandwidth for register communication is 46.4 GB/s and for DMA is 32 GB/s.
• Level 2 - Up-to 256 SW26010 many-core processors are applied, which contains 1,024 CGs in total. The bidirectional peak bandwidth of the network be-tween multiple processors is 16 GB/s.
• Level 3 - Up-to 4,096 SW26010 many-core processors
are applied, which contains 16,384 CGs in total.
The main performance metric we are concerned with here is one iteration completion time. Note that the total number of iterations needed and the quality of the solution (precision) are not considered in our experiments as our work does not relate to the optimization of the underlining Lloyd algorithm or the solution ofk-meansalgorithm.
5.2 Performance and Analysis
We report the results of three different partition strategies:
Level 1– a baseline single-level partition strategy,Level 2 –
4 8 16 32 64
0 0.05
0.1 US Census 1990
64 128 256 512 1,024
0 0.05 0.1
Road Network
16 32 64 128 256
Number of centroids 0
0.01
One iteration completion time (s)
Kegg Network
Fig. 4. Level 1 - dataflow partition
256 512 1,024 2,048 4,096
0
5 US Census 1990
6,250 12,500 25,000 50,000 100,000 0
5
10 Road Network
512 1,024 2,048 4,096 8,192
Number of centroids 0
0.1 0.2
One iteration completion time (s)
[image:8.612.46.295.73.149.2]Kegg Network
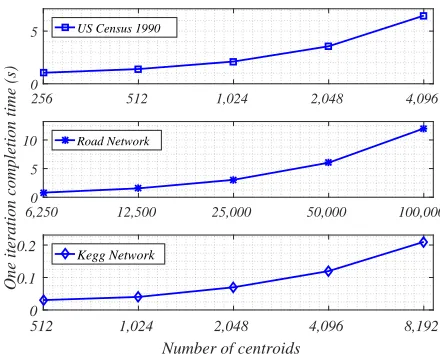
Fig. 5. Level 2 - dataflow and centroids partition
an implementation of a state-of-the-art two-level partition strategy used in recent supercomputer implementations [3], andLevel 3– our novel three-level partition strategy.
Since each partitioning strategy is only able to run suc-cessfully at certain ranges of k andd, it is not possible to compare them directly across the whole range benchmarks as the benchmarks have limits in terms of dataset size. For this reason, we first evaluate each strategy independently on the most suitable benchmarks for the strategy in question to show how each performs in the range for which they are most suited. The second part of our evaluation compares the partition strategies directly on benchmarks where the possible range of k and d overlap. This shows how our proposed Level 3 strategy scales significantly better than
Level 2 over varying k, d, and number of computational nodes.
5.2.1 Level 1 - dataflow partition
[image:8.612.326.546.249.426.2]Fig. 6. Level 3 - dataflow, centroids and data-sample partition
of this approach on datasets with relatively low size, dimen-sions and centroid values. Figure 4 shows the one iteration completion timefor those datasets over increasing number of clusters, k. As the number of k increases, the completion time on this approach grows linearly.
5.2.2 Level 2 - dataflow and centroids partition
The level 2 (nk-partition) parallel design is applied to same three UCI datasets as above, but for a large range of tar-get centroids (k). The purpose of these experiments is to demonstrate the efficiency and flexibility of the proposed approaches on datasets with large-scale target centroids (less than 100,000). Figure 5 shows theone iteration completion timeof the three datasets of increasing number of clusters, k. As the number of k increasing, the completion time from this approach grows linearly. We conclude that this approach works well when one dimension is varied up to the limits previously published.
5.2.3 Level 3 - dataflow, centroids and dimensions partition
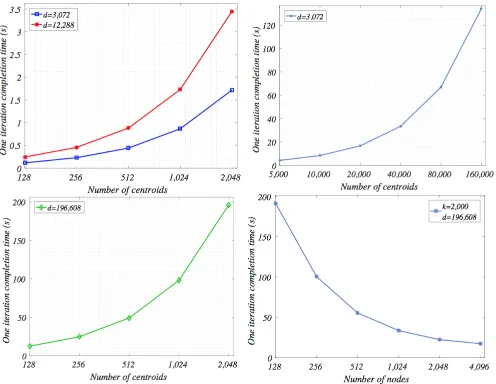
The Level 3 (nkd-partition) parallel design is applied to a subset of ImgNet datasets (ILSVRC2012) with its original size (n= 1,265,723). The results are presented with varying number of target centroids (k) and data dimension size (d) with an extremely large domain. We also test the scalability varying the number of computational nodes. The purpose of these experiments is to demonstrate the high performance and scalability of the proposed approaches on datasets with large size, extremely high dimensions and target centroids. Left hand side of Figure 6 shows the completion time of the dataset of increasing number of clusters,k = 128, 256, 512, 1024 and 2,048 with increasing number of dimensions,d= 3,072 (32*32*3), 12,288 (64*64*3) and 196,608 (256*256*3).
To further investigate the scalability of our approach, we test two more cases by either further scaling centroids by certain number of data dimensions (d= 3,072) and number of nodes (nodes = 128) or further scaling nodes applied by certain number of data dimensions (d = 196,608) and number of centroids (k = 2,000). The results of those two tests are shown in the right hand side of Figure 6.
As both k and d increase, the completion time from our approach continues to scale well, demonstrating our claimed high performance and scalability.
5.2.4 Comparison of partition levels
In this section we experimentally compare the Level 2 ap-proach withLevel 3.
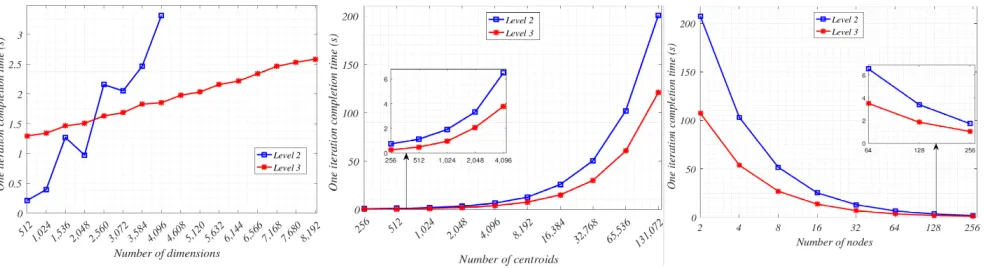
Figure 7(1) shows howone iteration completion timegrows as the number of dimensions increases. The Level 2 ap-proach outperforms Level 3 when the number of dimen-sions is relatively small. However, the Level 3 approach scales significantly better with growing dimensionality, out-performing Level 2 for all d greater than 2560. The Level 2 approach cannot run with d greater than 4096 in this scenario due to memory constraints. However, it is clear that, even if this problem were solved, the poor scaling would still limit this approach. The completion time for Level 2 falls twice unexpectedly between 1536 and 2048, and between 2560 and 3072. This is due to the crossing of communication boundaries in the architecture of the supercomputer – the trend remains clear however.
Figure 7(2) shows how the one iteration completion time
grows as the number of centroids, k increases. Since the number ofdis fixed at 4096, the Level 3 approach actually always outperforms Level 2, with the gap increasing as k increases. This scaling trend is replicated at lower levels ofd too, though Level 2 initially outperforming Level 3 at lower values ofk.
Figure 7(3) shows how both Level 2 and Level 3 scale across an increasing number of computation nodes. Level 3 clearly outperforms Level 2 in all scenarios. The values ofk anddare fixed, as described in the graph caption, at levels which Level 2 can operate. The performance gap narrows as more nodes are added, but remains significant. Clearly the exact performance numbers will vary with other values kandd, as can be inferred from other results, but the main conclusion we draw here is that Level 3 generally scales well.
5.2.5 Comparison with other architectures
As discussed, state-of-the-art supercomputing-oriented ap-proaches are tested either on their specific datasets [7], [27] or publish only their relative speedups [3] instead of tion times. It is not possible to compare our actual execu-tion time with these supercomputing-oriented approaches directly. Additionally, wallclock execution times are prob-lematic to compare across vastly differing architectures with different budgets.
Fig. 7. Comparison tests: (1) varying d with 2,000 centroids and 1,265,723 data samples tested on 128 nodes; (2) varying k with 4,096 dimensions and 1,265,723 data samples tested on 128 nodes; (3) varying number of nodes used with a fixed 4,096 dimension, 2,000 centroids and 1,265,723 data samples.
TABLE 3
Execution time comparison with other architectures
Approaches Hardware Resources n k d Execution time
per iteration
(sec.)
Execution time per iter-ation by Sunway Taihu-Light (sec.)
Max. Speedup
Rossbach, et al [35] 10x NVIDIA Tesla K20M
+ 20x Intel Xeon E5-2620
1.0E9 120 40 49.4 0.468635 (128 nodes) 105x
Bhimani, et al [4] NVIDIA Tesla K20M 1.4E6 240 5 1.77 0.025336 (4 nodes) 70x
Jin, et al [26] NVIDIA Tesla K20c 1.4E5 500 90 5.407 0.110191 (1 node) 49x
Li, et al [29] Xilinx ZC706 2.1E6 4 4 0.0085 0.002839 (1 node) 3x
Ding, et al [15] Intel i7-3770K 2.5E6 10,000 68 75.976 2.424517 (16 nodes) 31x
nodes, each node consisting of an NVIDIA Tesla K20M GPU with two Intel Xeon E5-2620 CPUs [35]. Further, we compare against two GPU based implementations running on an NVIDIA Tesla K20M GPU and an NVIDIA Tesla K20C GPU respectively [4], [26], an FPGA based approach running a custom parallel k-means implementation on Xilinx ZC706 FPGA [29], and a multi-core processor based approach running a custom implementation of parallel k-means on 8-core Intel i7-3770k processor [15].
The proposed approach running on the Sunway Taihu-Light supercomputer achieves more than100x speedup over the high-performance heterogeneous nodes based approach, between 50x-70x speedup than those single GPU based approaches, and 31x speedup over multi-core CPU based approach on their largest solvable workload sizes.
5.3 Auto-clustering on Real Application
Genomic information from gene expression data has been widely used and already benefited on improving clinical decision and molecular profiling based patient stratifica-tion. Clustering methods, as well as their corresponding HPC-based solutions [40], are adopted to classify the high-dimensional gene expression sequences into some known patterns, which indicates that the number of targeted clus-tering centroids are determined in advance. As we all know, there are still large numbers of gene expression sequences, among which the patterns are not yet discovered. Therefore, the proposed auto-clustering method can potentially help find new patterns from high-dimensional gene expression datasets.
In our work, we test the auto-clustering process on the ONCOLOGY&LEukemia gene expression datasets [16]. There are 4254 subjects and each subject has 54675 probesets.
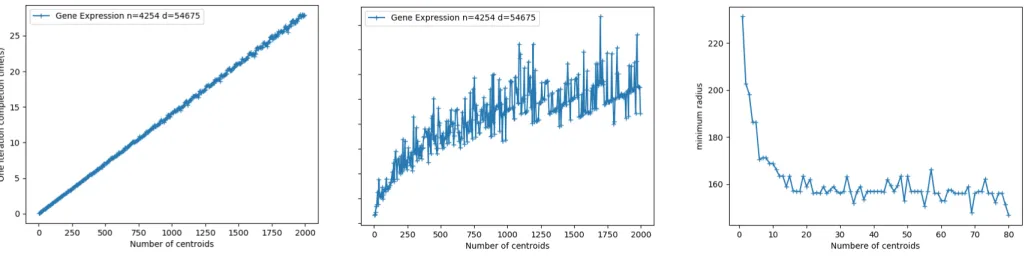
In this problem definition, we cluster the whole dataset using our level-3 partitioning method, where n is 4254, and d is 54675. In this task, we generate the candidate k by enumerating from 2 to 2000 (up-to around n/2). The performance for one iteration execution time is shown in fig-ure 8(1) and the total execution time is shown in figfig-ure 8(2). The results demonstrate good performance of our approach with a linear scale on one iteration time and also shows that our supercomputer-based technique can compute such a large-scale dataset for all needed iterations within 200 seconds at most.
We further apply the evaluation function to determine the optimal value ofk. The results are shown in figure 8(3). We can see that r0(k) reaches the first increasing when k = 14. After that,r0(k)fluctuates around a certain value, which indicates that continually increasing the k values cannot further represent more patterns in the input data.
6
CONCLUSION
In this paper, we present an automatick-means clustering solution based on the Sunway TaihuLight supercomputer.
Fig. 8. (1) One iteration execution time and (2) total execution time for gene expression dataset ONCOLOGY and LEukemia; (3) The evaluation functionr0(k)to determine the optimalkvalue.
The proposed auto-clustering solution is a significant attempt to supportAutoMLon a supercomputer system, and provide a feasibles way to support other potential machine learning algorithms.
REFERENCES
[1] Mihai B¯adoiu, Sariel Har-Peled, and Piotr Indyk. Approximate
clustering via core-sets. In Proceedings of the thiry-fourth annual
ACM symposium on Theory of computing, pages 250–257. ACM, 2002.
[2] Amir Ben-Dor, Ron Shamir, and Zohar Yakhini. Clustering gene
expression patterns.Journal of computational biology, 6(3-4):281–297, 1999.
[3] Michael A Bender, Jonathan Berry, Simon D Hammond, Branden
Moore, Benjamin Moseley, and Cynthia A Phillips. k-means
clustering on two-level memory systems. InProceedings of the 2015
International Symposium on Memory Systems, pages 197–205. ACM, 2015.
[4] Janki Bhimani, Miriam Leeser, and Ningfang Mi. Accelerating
k-means clustering with parallel implementations and gpu
com-puting. InHigh Performance Extreme Computing Conference (HPEC),
2015 IEEE, pages 1–6. IEEE, 2015.
[5] Christian B ¨ohm, Martin Perdacher, and Claudia Plant. Multi-core
k-means. InProceedings of the 2017 SIAM International Conference
on Data Mining, pages 273–281. SIAM, 2017.
[6] Thomas Bottesch, Thomas B ¨uhler, and Markus K¨achele. Speeding
up k-means by approximating euclidean distances via block
vec-tors. InInternational Conference on Machine Learning, pages 2578–
2586, 2016.
[7] Y Dora Cai, Rabindra Robby Ratan, Cuihua Shen, and Jay
Alameda. Grouping game players using parallelized k-means
on supercomputers. InProceedings of the 2015 XSEDE Conference:
Scientific Advancements Enabled by Enhanced Cyberinfrastructure, page 10. ACM, 2015.
[8] Moses Charikar, Chandra Chekuri, Tom´as Feder, and Rajeev
Mot-wani. Incremental clustering and dynamic information retrieval.
SIAM Journal on Computing, 33(6):1417–1440, 2004.
[9] Siya Chen, Tieli Sun, Fengqin Yang, Hongguang Sun, and
Yu Guan. An improved optimum-path forest clustering algorithm
for remote sensing image segmentation. Computers & Geosciences,
112:38–46, 2018.
[10] Guy Barrett Coleman and Harry C Andrews. Image segmentation by clustering.Proceedings of the IEEE, 67(5):773–785, 1979. [11] Xiaoli Cui, Pingfei Zhu, Xin Yang, Keqiu Li, and Changqing Ji.
Optimized big data k-means clustering using mapreduce. The
Journal of Supercomputing, 70(3):1249–1259, 2014.
[12] Ryan R Curtin. A dual-tree algorithm for fast k-means clustering with large k. InProceedings of the 2017 SIAM International Conference on Data Mining, pages 300–308. SIAM, 2017.
[13] Sanjoy Dasgupta.The hardness of k-means clustering. Department of
Computer Science and Engineering, University of California, San Diego, 2008.
[14] Inderjit S Dhillon and Dharmendra S Modha. A data-clustering
algorithm on distributed memory multiprocessors. InLarge-scale
parallel data mining, pages 245–260. Springer, 2002.
[15] Yufei Ding, Yue Zhao, Xipeng Shen, Madanlal Musuvathi, and Todd Mytkowicz. Yinyang k-means: A drop-in replacement of
the classic k-means with consistent speedup. In International
Conference on Machine Learning, pages 579–587, 2015.
[16] Expression Project for Oncology (expO). http://www.intgen.org/. [17] Haohuan Fu, Junfeng Liao, Jinzhe Yang, Lanning Wang, Zhenya Song, Xiaomeng Huang, Chao Yang, Wei Xue, Fangfang Liu, Fangli Qiao, et al. The sunway taihulight supercomputer: system
and applications. Science China Information Sciences, 59(7):072001,
2016.
[18] Sudipto Guha, Adam Meyerson, Nina Mishra, Rajeev Motwani, and Liadan O’Callaghan. Clustering data streams: Theory and
practice. IEEE transactions on knowledge and data engineering,
15(3):515–528, 2003.
[19] Isabelle Guyon, Imad Chaabane, Hugo Jair Escalante, Sergio Es-calera, Damir Jajetic, James Robert Lloyd, N ´uria Maci`a, Bisakha Ray, Lukasz Romaszko, Mich`ele Sebag, et al. A brief review of the chalearn automl challenge: any-time any-dataset learning without
human intervention. InWorkshop on Automatic Machine Learning,
pages 21–30, 2016.
[20] Ali Hadian and Saeed Shahrivari. High performance parallel
k-means clustering for disk-resident datasets on multi-core cpus.The
Journal of Supercomputing, 69(2):845–863, 2014.
[21] Greg Hamerly. Making k-means even faster. InProceedings of the
2010 SIAM international conference on data mining, pages 130–140. SIAM, 2010.
[22] Juan Mario Haut, Mercedes Paoletti, Javier Plaza, and Antonio Plaza. Cloud implementation of the k-means algorithm for
hyper-spectral image analysis. The Journal of Supercomputing, 73(1):514–
529, 2017.
[23] ImgNet ILSVRC2012.
http://www.image-net.org/challenges/lsvrc/2012/.
[24] Anil K Jain and Richard C Dubes. Algorithms for clustering data.
Prentice-Hall, Inc., 1988.
[25] Daxin Jiang, Chun Tang, and Aidong Zhang. Cluster analysis for
gene expression data: a survey.IEEE Transactions on knowledge and
data engineering, 16(11):1370–1386, 2004.
[26] Yu Jin and Joseph F Jaja. A high performance
implementa-tion of spectral clustering on cpu-gpu platforms. arXiv preprint
arXiv:1802.04450, 2018.
[27] Jitendra Kumar, Richard T Mills, Forrest M Hoffman, and William W Hargrove. Parallel k-means clustering for quantitative
ecoregion delineation using large data sets. Procedia Computer
Science, 4:1602–1611, 2011.
[28] You Li, Kaiyong Zhao, Xiaowen Chu, and Jiming Liu. Speeding up
k-means algorithm by gpus. InComputer and Information Technology
(CIT), 2010 IEEE 10th International Conference on, pages 115–122. IEEE, 2010.
[29] Zhehao Li, Jifang Jin, and Lingli Wang. High-performance k-means implementation based on a simplified map-reduce archi-tecture.arXiv preprint arXiv:1610.05601, 2016.
[30] Top500 list. https://www.top500.org/lists/2018/06/.
[31] Stuart Lloyd. Least squares quantization in pcm.IEEE transactions
on information theory, 28(2):129–137, 1982.
[32] James Newling and Franc¸ois Fleuret. Fast k-means with accurate
bounds. InInternational Conference on Machine Learning, pages 936–
[image:11.612.54.566.44.172.2][33] James Newling and Franc¸ois Fleuret. Nested mini-batch k-means. InAdvances in Neural Information Processing Systems, pages 1352– 1360, 2016.
[34] UCI Machine Learning Repository.
http://archive.ics.uci.edu/ml/datasets.html.
[35] Christopher J Rossbach, Yuan Yu, Jon Currey, Jean-Philippe Mar-tin, and Dennis Fetterly. Dandelion: a compiler and runtime for
heterogeneous systems. InProceedings of the Twenty-Fourth ACM
Symposium on Operating Systems Principles, pages 49–68. ACM, 2013.
[36] Xiao-Bo Shen, Weiwei Liu, Ivor W Tsang, Fumin Shen, and
Quan-Sen Sun. Compressed k-means for large-scale clustering. InAAAI,
pages 2527–2533, 2017.
[37] Rui Shi, Huamin Feng, Tat-Seng Chua, and Chin-Hui Lee. An adaptive image content representation and segmentation
ap-proach to automatic image annotation. InInternational conference
on image and video retrieval, pages 545–554. Springer, 2004. [38] Michael Steinbach, George Karypis, Vipin Kumar, et al. A
com-parison of document clustering techniques. InKDD workshop on
text mining, volume 400, pages 525–526. Boston, 2000.
[39] Leonardo Torok, Panos Liatsis, Jos Viterbo, Aura Conci, et al. k-ms.
Pattern Recognition, 66(C):392–403, 2017.
[40] Shicai Wang, Ioannis Pandis, David Johnson, Ibrahim Emam,
Florian Guitton, Axel Oehmichen, and Yike Guo. Optimising
parallel r correlation matrix calculations on gene expression data
using mapreduce.BMC bioinformatics, 15(1):351, 2014.
[41] Mario Zechner and Michael Granitzer. Accelerating k-means on
the graphics processor via cuda. InIntensive Applications and
Ser-vices, 2009. INTENSIVE’09. First International Conference on, pages 7–15. IEEE, 2009.
[42] Dengsheng Zhang, Md Monirul Islam, and Guojun Lu. A review
on automatic image annotation techniques. Pattern Recognition,
45(1):346–362, 2012.
[43] Wenlai Zhao, Haohuan Fu, Jiarui Fang, Weijie Zheng, Lin Gan, and Guangwen Yang. Optimizing convolutional neural networks
on the sunway taihulight supercomputer. ACM Transactions on
Architecture and Code Optimization (TACO), 15(1):13, 2018.
Teng Yuis a PhD candidate in School of Com-puter Science, University of St Andrews. He received a MRes in Advanced Computing from Imperial College London in 2016, a BSc in Computer Science from University College Cork joint with Beijing Technology and Business Uni-versity in 2015. His research interests include operating systems, heterogeneous architectures and HPC.
Wenlai Zhaois a PostDoctoral researcher in Ts-inghua University and is leading the distributed machine learning research group in the National Supercomputing Center in Wuxi (NSCCWX). He got his Ph.D. degree from Department of Computer Science and Technology in Tsinghua University. His research interest is heteroge-neous parallel computing and distributed ma-chine learning.
Pan Liuis a final year undergraduate student in Department of Computer Science and Technol-ogy, Tsinghua University. His research interests include HPC and cryptography.
Vladimir Janjicis a PostDoctoral researcher in the School of Computer Science, University of St Andrews. His research interests are high-level programming models (based on the concept of parallel patterns) for heterogeneous parallel platforms, as well as efficient implementation of these models on hardware.
Xiaohan Yanis a PhD candidate in Department of Mathematics, University of California, Berke-ley. His research interests lie generally in the intersection of symplectic geometry, algebraic geometry and mathematical physics, including quantum K-theory, moduli space, and mirror symmetry.
Shicai Wang is a Bioinformatician in Wellcome Trust Sanger Institute. He has a PhD in comput-ing from Imperial College London. His research interests include high performance computing, databases and bioinformatics.
Haohuan Fu is a professor in the Department of Earth System Science in Tsinghua University, where he leads the research group of High Per-formance Geo-Computing (HPGC). He is also the deputy director of the National Supercom-puting Center in Wuxi, leading the R&D di-vision. He got a PhD from Imperial College London. He has been working towards the goal of providing both the most efficient simulation platforms and the most intelligent data man-agement and analysis platforms for geoscience applications.
Guangwen Yang is a professor in the Depart-ment of Computer Science in Tsinghua Univer-sity, and is the director of the National Super-computing Center in Wuxi. He got the PhD from Harbin Institute of Technology. His research in-terests include distributed system, parallel com-puting and machine learning system.