Chiroptically-Active Quantum
Nanostructures
A thesis submitted to the School of Chemistry,
Trinity College, the University of Dublin,
for the degree of Doctor of Philosophy
Alexander Loudon
Under the supervision of Professor Yurii K. Gun’Ko
i
Abstract
In this research a wide variety of fluorescent nanoparticles have been synthesised and analysed through the lens of optical activity and potential chiroptical applications. Cadmium and cadmium-free fluorescent nanoparticles were synthesised using a range of synthetic approaches including aqueous co-precipitation, hot-injection and heating up techniques. While the majority of the particles analysed in this research were spherical (quantum dots), efforts were taken to produced several different shapes such as nanoplatelets, dot-in-rods and nanotetrapods.
Using ligand exchange techniques, and the inclusion of chiral stabilising ligands in the synthesis of these particles, optical activity was induced and subsequently analysed using circular dichroism spectroscopy. The resultant chiral nanoparticles were tested for potential applications in a series of experiments including enantio-cytotoxicity, enantioselective quenching, and enantioselective biological imaging.
ii
Summary
Chapter 1 of the thesis provides the introduction and describes the background
theory and literature review relevant to quantum dot research.
Chapter 2 provides experimental details for all procedures including the protocols
of synthesis and modification of quantum nanostructures, the methods used and
the sample preparations for characterisation. It also describes principles of the main
instrumental characterisation techniques and relevant equipment used in this
research.
Chapter 3 is dedicated to the development and characterisation of new cadmium
free chiral ZnS and ZnS:Mn quantum dots. It explores the development of ligand
exchange processes to exchange the lipophilic organic ligands for biocompatible
water soluble chiral ligands such as cysteine and penicillamine and studies of their
optical properties. In addition, glutathione capped ZnSe QDs were synthesised in
the aqueous phase and were tested for enantioselectivity when using D- an L-
penicillamine as a quenching molecule.
Chapter 4 presents the synthesis and characterisation of new optically active
anisotropic quantum nanostructures such as luminescent CdSe-CdS dot in rods and
CdSe-CdS tetrapods. The 1-β-D-thioglucose functionalised dot in rods were subsequently used for chiral sensing of Naproxen enantiomers.
Chapter 5 describes the preparation of chiroptically active CdS QDs and 2D CdSe
nanostructures. The synthetic approaches involved: firstly, a 1 step aqueous
synthesis and secondly, a two-step process using initial hot injection synthesis
followed by a ligand exchange. The chiroptical properties of these materials were
then examined. Chapter 5 also reports the synthesis of CdSe nanoplatelets of
various thicknesses. These nanoplatelets were transferred into the aqueous phase
iii
Chapter 6 describes the exploration of selected applications of some of our chiral
quantum dot based nanomaterials and techniques. Specifically, it describes the use
of cation exchange on our CdS QDs and CdSe nanoplatelets to convert them to
optically active Cu2S and Cu2-xSe respectively. This chapter also describes the use of
the phase transfer approach to prepare luminescent CdZnSeS/ZnS alloyed QDs with
varying degrees of glycosylation on the surface. These materials were used for in
vitro cellular imaging using confocal microscopy to investigate a relationship
between cellular interaction and the degree of QD glycosylation.
Finally, chapter 7 presents the conclusions and main outcomes of this research. It
also discusses the future research that would follow on from this work.
We believe that this research has contributed to the further development of the
preparation and analysis of a variety of new optically active fluorescent
nanomaterials. It is expected that these nanomaterials might find applications in
iv
Declaration
This thesis is submitted for the degree of Doctor of Philosophy to the University of Dublin,
Trinity College and has not been submitted before for any degree or examination to this or
any other university. Other than where acknowledged, all work described herein is original
and carried out by the author alone. Permission is granted so that the Library may lend or
copy this thesis upon request. This permission covers only single copies made for study
purposes, subject to normal conditions of acknowledgement.
_______________
v
Acknowledgements
This research would not have been possible without the support of several people who I would like to sincerely thank.
Most importantly, I would like to thank my supervisor, Professor Yurii Gun’ko. His exceptional knowledge and thoughtful guidance have been invaluable throughout this research and without it none of this would have been possible. By extension, I would like to thank the Gun’ko research group, my academic family. Through constant support and expertise, they made every day enjoyable and allowed me to grow both as a scientist and a person during my PhD. In particular I thank Dr. Finn Purcell-Milton, my post-doctoral supervisor and close friend. Thank you for your time and patience over the years to help me extract the most out of my research and academic experience.
I would like to thank Vera Kutznetzova and the Scanlan group for contributing their expertise in biochemistry and organic chemistry for this project also.
I would like to extensively thank Olan Cleary, my flat mate of 4 years and fellow chiroptical nanomaterial researcher. Our time spent together, in and out of the lab,
will leave an indelible mark on me as some of the greatest memories I’ve had to date.
vi
Contents
1 Chapter 1: Introduction ... 1
1.1 Introduction to band structure and semiconductors ... 1
1.2 Quantum Dots ... 2
1.3 Synthesis of quantum dots ... 5
1.3.1 The development of colloidal quantum dot synthesis ... 6
1.3.2 Organometallic synthesis of colloidal quantum dots ... 6
1.3.3 Core-shell quantum dots ... 10
1.3.4 Aqueous synthesis of Quantum dots ... 12
1.4 Anisotropic Nanostructures ... 14
1.5 Quantum Rods and Dot-in-Tetrapods ... 15
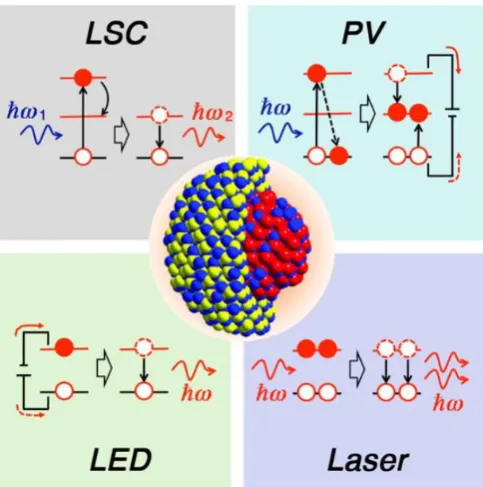
1.6 Applications of QDs in optoelectronics ... 16
1.6.1 Quantum dot light emitting diodes ... 19
1.6.2 Quantum dot based solar cells ... 21
1.7 Biological applications of QDs ... 24
1.8 Chirality in nanoscience ... 27
1.8.1 Chirality of nanomaterial macro-assemblies ... 29
1.8.2 Ligand-induced chirality ... 30
1.8.3 Intrinsic chirality ... 31
1.9 Chiral Quantum Dots ... 32
1.10 Thiosugars as ligands for QDs ... 34
1.11 Cation exchange in quantum nanostructures ... 35
1.12 Aims and objectives of the project ... 36
1.13 References ... 38
vii
2.1 Starting materials and general equipment ... 49
2.2 Experimental details for chapter 3... 50
2.2.1 Synthesis of ZnS and ZnS:Mn quantum dots ... 50
2.2.2 Phase transfer of ZnS:Mn doped QDs by precipitation technique ... 51
2.2.3 Phase transfer of Mn Doped ZnS QDs using ethylenediamine (EDA) ... 51
2.2.4 Synthesis of L-glutathione capped ZnSe QDs ... 52
2.2.5 Chiral recognition of penicillamine by ZnSe-GSH QDs ... 52
2.3 Experimental details for chapter 4... 53
2.3.1 Synthesis of wurtzite CdSe QDs ... 53
2.3.2 Synthesis of zinc blende CdSe QDs ... 54
2.3.3 Preparation of solutions for synthesis of CdSe/CdS DiRs and TPs ... 54
2.3.4 Synthesis of CdSe/CdS dot in rods ... 55
2.3.5 Synthesis of CdSe/CdS tetrapods ... 55
2.3.6 Phase Transfer of CdSe-CdS DiR using thioglucose ... 56
2.4 Experimental details for chapter 5... 56
2.4.1 Synthesis of CdS quantum dots ... 56
2.4.2 Phase transfer for CdS QDs with penicillamine ... 57
2.4.3 Synthesis of small CdSe QDs ... 57
2.4.4 Aqueous synthesis of L- and D- penicillamine stabilised QDs ... 58
2.4.5 Reverse phase transfer using dodecanethiol (DDT) on aqueous CdS QDs ... 58
2.4.6 Synthesis of 1.5 nm size CdSe nanoplatelets capped with myristic acid ... 58
2.4.7 Synthesis of 1.5 nm size CdSe nanoplatelets capped with decanoic acid ... 59
2.4.8 Synthesis of both 1.5 nm and 1.2 nm size CdSe nanoplatelets capped with Myristic Acid ... 59
2.4.9 Synthesis of 1.2 nm size CdSe nanoplatelets capped with decanoic acid ... 59
2.4.10 Synthesis of Mn doped CdSe nanoplatelets of size 1.5 nm ... 60
2.4.11 Phase transfer of 1.5 nm size CdSe QPs ... 60
viii
2.5 Experimental details for chapter 6 ... 60
2.5.1 Cation exchange from pen capped CdS to pen capped Cu2S ... 60
2.5.2 Cation exchange from CdSe:Mn platelets to Cu2Se:Mn platelets ... 61
2.5.3 Synthesis of CdSe@ZnS/ZnS QDs ... 61
2.5.4 Phase transfer of the above QDs using thiolactose and penicillamine ... 62
2.6 Characterisation techniques ... 62
2.6.1 UV-Vis spectroscopy ... 62
2.6.2 Photoluminescence Spectroscopy ... 63
2.6.3 Circular Dichroism Spectroscopy ... 65
2.6.4 X-Ray Diffraction ... 66
2.6.5 Transmission Electron Microscopy ... 67
2.6.6 Energy-dispersive X-Ray Spectroscopy ... 69
2.7 References ... 70
3 Chapter 3: Synthesis of non-toxic, optically active ZnS, ZnS:Mn and ZnSe QDs ... 71
3.1 Introduction ... 71
3.2 Aims of this chapter ... 72
3.3 Synthesis and characterisation of ZnS and ZnS:Mn quantum dots in chloroform ... 74
3.4 Ligand Exchange on ZnS:Mn quantum dots to produce chiral quantum dots ... 79
3.4.1 Preparation of L- and D- cysteine stabilised ZnS:Mn QDs ... 79
3.4.2 Penicillamine capped ZnS:Mn quantum dots ... 83
3.4.3 Preparation of cysteine and penicillamine capped ZnS:Mn using ethylenediamine as transfer agent ... 86
3.5 Toxicity studies for L and D cysteine capped ZnS:Mn QDs ... 91
3.6 Preparation of ZnSe quantum dots capped with glutathione ... 92
3.7 Conclusions ... 97
ix
4 Chapter 4: Synthesis and characterisation of CdSe-CdS dot in rod and tetrapods for sensing
applications. ...101
4.1 Introduction ... 101
4.2 Aims of this chapter ... 102
4.3 Synthesis and characterisation of CdSe-CdS DiRs ... 103
4.4 Use of CdSe-CdS DiRs for chiral recognition ... 118
4.5 Synthesis and characterisation of CdSe-CdS dot in tetrapods ... 124
4.6 Conclusions ... 130
4.7 References ... 132
5 Chapter 5: Chiral cadmium containing 0D dots, and 2D Platelets ...133
5.1 Introduction ... 133
5.2 Aims ... 135
5.3 Preparation and characterisation of chiral CdS ... 136
5.3.1 Hot injection synthesis and characterisation of CdS ... 136
5.3.2 Effect of injection temperature on the size of CdS nanoparticles ... 137
5.3.3 Phase transfer of CdS QDs using penicillamine ligands ... 139
5.3.4 Investigation of dependance of the optical activity on the size of QDs ... 143
5.4 Synthesis and characterisation of aqueous CdS QDs ... 144
5.5 Synthesis of Cysteine capped CdS ... 157
5.6 Synthesis of optically active CdSe QDs ... 159
5.7 Synthesis and characterisation of CdSe nanoplatelets ... 162
5.8 Conclusions ... 181
5.9 References ... 183
6 Chapter 6: Applications of chiral nanomaterials ...185
6.1 Introduction ... 185
6.2 Aims of this chapter ... 186
x
6.3.1 Cation exchange on CdS QDs ... 187
6.3.2 Cation exchange for CdSe nanoplatelets ... 190
6.4 Biological imaging using CdSe@ZnS-ZnS QDs in HeLa cells ... 193
6.5 Conclusions ... 203
6.6 References ... 204
7 Conclusions and future work ... 208
7.1 Conclusions ... 208
7.2 Future Work ... 209
7.2.1 Enantioselective quenching of L- and D- cys stabilised ZnS:Mn by gold NPs ... 210
7.2.2 Sensing of β-Galactosidase ... 213
7.3 References ... 214
xi
List of figures
Figure 1-1: The conversion of orbitals into bands for bulk materials. ... 1
Figure 1-2: Band structure of an insulator, semiconductor and metal. ... 2
Figure 1-3 Effects of nanocrystal size on band gap properties. ... 3
Figure 1-4: Theoretical PL spectra demonstrating size-dependent band gap of QDs.
... 4
Figure 1-5: Diagram explaining Mn(II) doping effect on ZnS quantum dots ... 5
Figure 1-6 Hot injection technique for CQD synthesis (reproduced from ref26). ... 7
Figure 1-7 La Mer model for colloidal growth in solution (Reproduced from ref.26). 8
Figure 1-8 Effect of nanocrystal size on growth rate (reproduced from ref.29). ... 9
Figure 1-9 Band gap alignment in type I, reverse type I and type II core shell QDs. 11
Figure 1-10: Density of states for materials either not confined (A) or confined in (B)
1, (C) 2 or (D) 3 dimensions (reproduced from ref91). ... 15
Figure 1-11 Diagram describing CdSe-CdS dot-in-rod and dot-in-tetrapod. ... 16
Figure 1-12 Optoelectronic applications of quantum dots (reproduced from ref.119).
... 17
Figure 1-13 Spectral range of heavy metal and heavy metal free QDs varying from
UV to IR (reproduced from ref.119). ... 18
Figure 1-14 Typical QD LED (reproduced from ref.134). ... 19
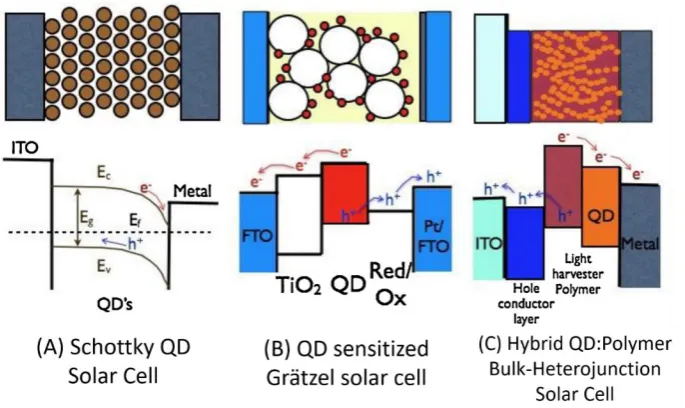
Figure 1-15 Graphical description of 3 types of QD solar cells as well as the
associated energy diagrams (reproduced from ref.164) ... 23
Figure 1-16: Common water solubilising ligands for QD phase transfers. ... 26
Figure 1-17: General process for phase transfer and stabilising of quantum dots. 26
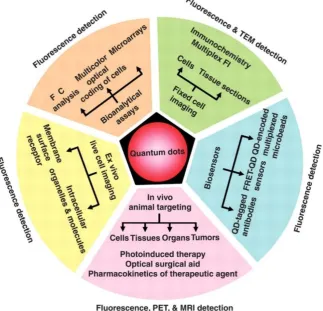
Figure 1-18: The numerous uses for quantum dots in biomedical applications.
Reproduced fromref. 212). ... 27
Figure 1-19: The two enantiomeric forms of Thalidomide (reproduced from ref.213).
xii
Figure 1-20 Number of citations for publications about chiral nanomaterials by year.
... 29
Figure 1-21 Left and right-handed CdTe nanoribbons (reproduced from ref.221) .... 30
Figure 1-22 Chiral (a) Cu(3,1,17)S and (b) Cu (3,1,17)R surfaces (reproduced from ref.234) ... 32
Figure 1-23 Development of carbohydrate conjugated QDs from carbohydrates. . 34
Figure 1-24 The 3 stage (A-C) for cationic exchange in quantum dots. ... 35
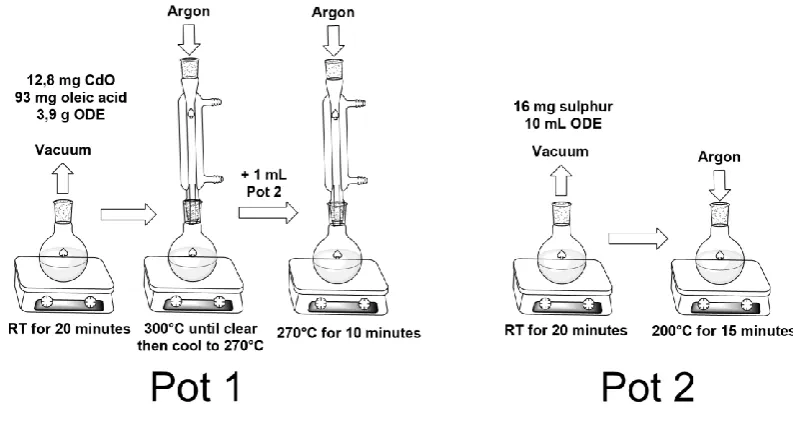
Figure 2-1 Schematic describing the synthesis of ZnS:Mn QDs ... 50
Figure 2-2 Synthesis of CdS quantum dots with a 270°C hot injection. ... 56
Figure 2-3 Basic principles of a UV-Vis spectrometer. ... 63
Figure 2-4 Diagram describing singlet and triplet electronic spin states. ... 64
Figure 2-5 Internal structure of a spectrofluorimeter ... 64
Figure 2-6 Diagram describing constructive interference in a crystal lattice. ... 66
Figure 2-7 Basic operation of a transmission electron microscope (reproduced from ref.11) ... 68
Figure 2-8 Diagram describing the general principles of EDX analysis. ... 69
Figure 3-1 (A) Absorption (inset) and emission spectra for ZnS and ZnS:Mn QDs in chloroform: excitation λ = 250 nm. (B) Jablonski diagram showing effects of Mn doping. ... 74
Figure 3-2 (A) TEM image of the Mn-doped ZnS, (B) a high-res close up of a single QD, (C) STEM image of ZnS:Mn QDs and (D) the area of the sample used for EDX analysis. ... 75
Figure 3-3 Size distribution for the ZnS:Mn QDs (n = 150). ... 76
Figure 3-4 EDX analysis of ZnS:Mn QDs. ... 77
Figure 3-5 XRD spectra for ZnS and ZnS:Mn QDs. ... 78
xiii
Figure 3-8 PL spectra for organic oleylamine and aqueous D and L Cys stabilised
ZnS:Mn QDs (Ex. λ – 320 nm). ... 80
Figure 3-9 CD spectra for L and D cysteine stabilised ZnS:Mn QDs. ... 81
Figure 3-10 A) TEM and B) HRTEM of ZnS:Mn capped with L-cysteine. ... 82
Figure 3-11 Size distribution plot for ZnS:Mn QDs capped with L-cysteine (n=150). ... 82
Figure 3-12 Structure of A) cysteine and B) penicillamine. ... 83
Figure 3-13 UV-Vis spectra of D and L penicillamine stabilised ZnS:Mn QDs. ... 84
Figure 3-14 PL spectra for organic oleylamine and aqueous D and L pen stabilised ZnS:Mn QDs (Ex. λ – 320 nm). ... 84
Figure 3-15 PL spectra comparing the organic ZnS:Mn QDs against the cysteine and penicillamine stabilised QDs (Ex. λ – 320 nm). ... 85
Figure 3-16 CD spectra for pure D- and L- penicillamine (as free ligands). ... 85
Figure 3-17 CD spectra for D and L penicillamine capped ZnS:Mn QDs. ... 86
Figure 3-18 EDA assisted phase transfer scheme of ZnS:Mn QDs. ... 87
Figure 3-19 PL spectra for ZnS:Mn QDs following EDA assisted phase transfer for both L-Cys and D-Pen capped QDs. ... 88
Figure 3-20 CD spectra for cysteine capped ZnS:Mn QDs synthesised using the EDA phase transfer method. ... 89
Figure 3-21 CD spectra for penicillamine capped ZnS:Mn QDs using the EDA ligand exchange process. ... 89
Figure 3-22 Effect of chiral heat treatment on ZnS:Mn-penicillamine QDs. ... 90
Figure 3-23 Cell viability of A549 cells in the presence of cysteine capped ZnS:Mn QDs.26 ... 92
Figure 3-24 Glutathione ... 93
Figure 3-25 Zn-GSH complexes at a) pH 6.5 – 8.3; b) pH 8.3 – 10.3; c) pH 10.3-11.5.29 ... 93
xiv
Figure 3-27 A) TEM image of ZnSe QDs and B) Size distribution plot of ZnSe QDs
(n=130). ... 94
Figure 3-28 CD spectra for Glutathione-ZnSe QDs. ... 95
Figure 3-29 PL spectra for ZnSe-Glutathione QDs (ex. λ – 300 nm). ... 96
Figure 3-30 Effect on luminescence of ZnSe QDs by addition of penicillamine. ... 97
Figure 4-1 The UV-Vis spectra for the CdSe-CdS DiRs. Inset - the enlarged region from 525 to 700 nm in chloroform. ...104
Figure 4-2 PL spectrum for the emission of CdSe-CdS DiRs in chloroform (Exc. λ – 400 nm) ...104
Figure 4-3 TEM image of (A) the CdSe-CdS DiRs from the organic phase with a (B) close up displaying crystallinity ...105
Figure 4-4 (A) Length and (B) width size distributions histograms for the DiRs in the organic phase (N = 120 for length and 160 for width). ...106
Figure 4-5 UV-Vis spectra for both aqueous (L-Pen) and DiRs in organic phase (chloroform). ...106
Figure 4-6 PL Spectra for the DiRs in both the organic and aqueous phase (Exc. λ – 400 nm). ...107
Figure 4-7 CD spectra for D and L Penicillamine stabilised DiRs. ...108
Figure 4-8 CD spectra of CdSe-CdS DiR stabilised with L- penicillamine (exciton region). ...109
Figure 4-9 (A) TEM and (B) HRTEM images of CdSe-CdS DiRs stabilised with L-Penicillamine. ...109
Figure 4-10 (A) Length and (B) Width distributions histograms for the L-Pen stabilised DiRs (N = 150 for length and 140 for width). ...110
Figure 4-11 UV-Vis spectra of (A) Cys-DiRs and (B) a close of up the CdSe exciton region. ...111
Figure 4-12 PL spectra for Cys stabilised DiRs in DMSO (exc. λ – 400 nm). ...111
Figure 4-13 CD spectra for D and L Cys stabilised DiRs in DMSO. ...112
xv
Figure 4-15 (A) TEM and (B) HRTEM of DiRs stabilised with L-Cysteine from H2O.
... 113
Figure 4-16 (A) Length and (B) width distribution histograms for L-Cys CdSe-CdS DiRs (N = 130 for length and 130 for width). ... 114
Figure 4-17 1-Thio-β-D-Glucose. ... 114
Figure 4-18 UV-Vis spectra for thioglucose stabilised CdSe-CdS DiRs. ... 115
Figure 4-19 PL spectra for thioglucose stabilised DiRs (Ex. λ– 500 nm). ... 116
Figure 4-20 CD Spectra for thioglucose stabilised DiRs in water. ... 117
Figure 4-21 (A) TEM and (B) HRTEM for CdSe-CdS DiR stabilised with D-Thioglucose. ... 118
Figure 4-22 (A) Length and (B) width distributions histograms for the DiR stabilised with thioglucose (N = 140 for length and 120 for width). ... 118
Figure 4-23 Effect of S-Naproxen on the PL of L/D-Cys DiRs (Version 1)... 121
Figure 4-24 Effect of S-Naproxen on the PL of L/D-Cys DiRs (Version 2)... 122
Figure 4-25 Effect of S and R-Naproxen on the PL of Thioglucose DiRs. (Version 1). ... 123
Figure 4-26 Effect of S and R-Naproxen on the PL of Thioglucose DiRs. (Version 2) ... 124
Figure 4-27 UV-Vis spectrum of CdSe-CdS TPs in chloroform (B) zoom in on 500 – 700 nm region ... 125
Figure 4-28 PL spectrum for CdSe-CdS TPs (Ex λ – 450 nm). ... 126
Figure 4-29 Schematic describing relationship between observed arm length and actual arm length for CdSe-CdS TP. ... 127
Figure 4-30 TEM image (left) and size distribution histogram (right) for CdSe-CdS tetrapods (organic phase) (N = 120). ... 127
Figure 4-31 UV-Vis spectra for CdSe-CdS TPs capped with cysteine ... 128
xvi
Figure 4-34 CD spectra for D and L cysteine stabilised CdSe-CdS tetrapods...130
Figure 5-1 – Absorption and emission spectra of CdS quantum dots synthetized with a 275°C hot injection (Ex. λ – 393 nm). ...136
Figure 5-2 – (A) Absorption spectra of quantum dots synthetized with different injection temperatures (in degrees) and (B) their size as determined by the equation above. ...138
Figure 5-3 Absorbance spectra of CdS quantum dots before and after the phase transfer with penicillamine (inset: absorbance spectrum of penicillamine). ...140
Figure 5-4 – Emission spectra before and after the penicillamine phase transfer of CdS QDs. ...141
Figure 5-5 – (A) CD spectra of L-pen and D-pen capped CdS in the nanoparticles absorption region (B) CD spectra of L-pen and D-pen capped CdS in the ligand absorption region, with the ligand own CD spectrum as inset. ...142
Figure 5-6 – Comparison of the CD spectra of D-pen-capped CdS QDs made at different injection temperatures. ...143
Figure 5-7 UV-Vis spectra of CdS QDs (Sample A). ...145
Figure 5-8 CD spectra for CdS QDs (Sample A). ...146
Figure 5-9 PL spectra of CdS QDs (Sample A) (Ex. λ– 325 nm). ...147
Figure 5-10 UV-Vis spectra of CdS QDs (sample B). ...148
Figure 5-11 CD spectra of sample B. ...148
Figure 5-12 Comparison of CD spectra for Sample A and Sample B. ...149
Figure 5-13 PL spectra for D/L Pen CdS QDs (sample B) (Ex. λ– 325 nm). ...150
Figure 5-14 TEM image (left) and size distribution histogram (right) for D-Pen CdS Sample A (n = 150). ...151
Figure 5-15 TEM image (left) and size distribution histogram (right) for D-Pen CdS Sample. B (n = 150). ...151
Figure 5-16 UV-Vis spectra during reflux for sample B D-Pen ...152
Figure 5-17 PL spectra during reflux for sample B (D-Pen) (λ ex. – 325 nm). ...153
xvii
Figure 5-19 CD spectra over time for CdS QDs sample A (D-Pen). ... 154
Figure 5-20 CD spectra at t = 2 hr and t = 4 hr of reflux for CdS QDs. ... 155
Figure 5-21 CD spectra for DDT stabilised CdS QDs. ... 156
Figure 5-22 UV-Vis for DDT stabilised CdS QDs. ... 157
Figure 5-23 UV-Vis data for cysteine stabilised CdS QDs (2 hr reflux). ... 158
Figure 5-24 PL spectra for luminescence (λ ex. – 325 nm). ... 158
Figure 5-25 CD spectra for D and L cys stabilised CdS QDs. ... 159
Figure 5-26 UV-Vis and PL spectra for D-Pen stabilised CdSe QDs (λ ex. – 400 nm). ... 160
Figure 5-27 CD spectra for D and L pen stabilised CdSe QDs in H2O. ... 161
Figure 5-28 (A) TEM and (B) Size distribution for D-Pen CdSe QDs. ... 162
Figure 5-29 Scheme for the synthesis of CdSe nanoplatelets. ... 163
Figure 5-30 Table of reaction conditions for synthesis of CdSe nanoplatelets for reference ... 164
Figure 5-31 UV-Vis and PL spectra for CdSe QPs with myristic acid, sample 1 (λ ex. – 420 nm). ... 164
Figure 5-32 UV-Vis and PL spectra for CdSe QPs with decanoic acid, sample 2 (λ ex. – 420 nm)... 165
Figure 5-33 TEM images of CdSe NPs with myristic acid as the ligand (Sample 1) 166 Figure 5-34 (A) CdSe QPs with myristic acid scroll thickness (n = 40), (B) CdSe QPs with myristic acid tube width (n = 100), (C) CdSe QPs with myristic acid scroll lengths (n = 100), (D) TEM of size 1.5nm CdSe QPs with myristic acid. ... 167
Figure 5-35 TEM images of CdSe NPs with decanoic acid as the ligand (Sample 2). ... 167
Figure 5-36 (A) Platelet thickness (n = 120), (B) Scroll width (n = 60), (C) Scroll length (n = 100), (D) TEM of twisted CdSe nanoplatelets 1.5 nm (sample 2). ... 168
Figure 5-37 UV-Vis spectrum for CdSe:Mn nanoplatelets. ... 169
xviii
Figure 5-39 UV-Vis spectra for sample 4.1 and 4.2 (before and after storage for 8
weeks). ...171
Figure 5-40 Photoluminescence spectra for sample 4.1 and 4.2 (before and after 8 weeks storage) (λ ex. – 350 nm). ...171
Figure 5-41 UV-Vis and PL spectra of CdSe Sample 5 with 1.2 nm thickness (λ ex. – 350 nm). ...172
Figure 5-42 UV-Vis spectra before and after sample 2 had been transferred to water using penicillamine. ...174
Figure 5-43 PL spectra for before and after the phase transfer (Ex. λ – 380 nm). .174 Figure 5-44 CD spectra for size 1.5nm CdSe QPs capped with D-Pen and L-Pen ...175
Figure 5-45 TEM image of sample 2 after the phase transfer with D-Pen. ...175
Figure 5-46 UV-Vis spectra of sample 4.2 before and after phase transfer. ...176
Figure 5-47 CD spectra of sample 4.2 after phase transfer. ...177
Figure 5-48 UV-Vis spectra of sample 5 before and after phase transfer. ...177
Figure 5-49 CD spectra of sample 5 after phase transfer with D/L pen. ...178
Figure 5-50 UV-Vis spectra of (A) sample 5-D and (B) sample 5-L 0 72 and 120 hours after synthesis. ...179
Figure 5-51 CD spectra of sample 5 after penicillamine phase transfer at 0 and 72 hours. ...179
Figure 5-52 UV-Vis spectra for sample 2 before and after phase transfer with thiolactose. ...180
Figure 5-53 CD spectrum for sample 2 CdSe conjugated to thiolactose. ...181
Figure 6-1 Absorbance spectra of Pen-capped CdS before cation exchange and after (as Cu2S). ...188
Figure 6-2 CD spectra of L-pen and D-pen Cu2S quantum dots obtained from cation exchange from Pen-capped CdS synthesized at 300°C. ...189
Figure 6-3 Comparison of CD spectra before and after cation exchange. ...189
xix
Figure 6-5 CD spectra of resulting D/L penicillamine Cu2-xSe:Mn QPs in water. ... 192
Figure 6-6 Schematic for 50:50 penicillamine/thiolactose capped QD. ... 194
Figure 6-7 UV-Vis data for CdSe@ZnS/ZnS QDs capped with a combination of
penicillamine and thiolactose. ... 195
Figure 6-8 PL spectra for CdSe/ZnS@ZnS QDs stabilised with penicillamine and
thiolactose. ... 195
Figure 6-9 TEM image of CdSe/ZnS@ZnS QDs stabilised with lactose. ... 196
Figure 6-10 Size distribution histogram for QDs stabilised by lactose (n = 120). .. 196
Figure 6-11 HRTEM image of CdSe/ZnS@ZnS QDs stabilised by penicillamine. ... 197
Figure 6-12 Size distribution histogram for CdSe/ZnS@ZnS QDs stabilised by
penicillamine (n = 140). ... 197
Figure 6-13 TEM image of 50/50 lactose/penicillamine capped QDs. ... 198
Figure 6-14 HRTEM image of 50/50 lactose/penicillamine capped QDs. ... 198
Figure 6-15 Size distribution histogram for CdSe/ZnS@ZnS QDs stabilised by 50/50
lactose/penicillamine (n = 140). ... 199
Figure 6-16 Cell viability study at high concentration as a function of capping ligand
(L = lactose, D = D-Pen). ... 200
Figure 6-17 Confocal microscopy results for samples analysed at a high
concentration. ... 201
Figure 6-18 Confocal microscopy results for samples analysed at a lower
concentration. Complexes were subjected to live confocal imaging, excitation
405nm, emission 500-600nm (Leica, 63X oil immersion lens). Images are
representative of three experiment performed on independent days.) ... 202
Figure 6-19 Emission spectra of the complexes under cell culture conditions (Cell
medium, pH7.4, 5% CO2). HeLa cells were treated for 24h with 10µl of the indicated
complexes and subjected to live confocal imaging, excitation 405nm, emission
410-760nm (Leica, 63X oil immersion lens). A. 50:50, B. 100D, C. 100L. ... 203 Figure 7-1 UV-Vis spectrum for D-Pen stabilised gold nanoparticles. ... 211
xx
Figure 7-3 TEM images of D-Pen stabilised QDs ...212
Figure 7-4 Results of gold sensing using cysteine ...213
Figure 7-5 Schematic describing the sensing of β-galactosidase ...214
Figure 7-6 CD spectra for lactose and glucose stabilised CdSe QDs. ...214
Figure 8-1 XRD patterns for both wurtzite and zinc blende ZnS (reproduced from reference1) ... i
Figure 8-2 UV-Vis and CD spectra for D and L cysteine ... i
Figure 8-3 D-Pen in H2O after 48 hours at 50 °C ... ii
Figure 8-4 PL spectra for ZnSe quenching experiment with L-Pen ... ii
Figure 8-5 PL spectra for ZnSe quenching experiment with D-Pen ... iii
Figure 8-6 Calculations for concentration of CdSe-CdS DiRs used for sensing ... iv
Figure 8-7 PL spectra for L-Cys CdSe-CdS DiRs vs. Naproxen ... iv
Figure 8-8 PL spectra for D-Cys CdSe-CdS DiRs vs. Naproxen ... iv
Figure 8-9 2 sample t-test to test for significant difference in QD means ... v
Figure 8-10 TEM image of CdSe@ZnS/ZnS QDs in the organic phase ... v
xxi
List of Abbreviations
ODE – Octadecene 1-D – 1- Dimensional 2-D – 2 – Dimensional
BSA – Bovine serum albumen CD – Circular dichroism Cys -Cysteine
DBA – Dibenzylamine DDT - Dodecanethiol
DiR – Dot in Rod
DMSO – Dimethylsulfoxide GSH – Glutathione
LED – Light emitting dioide
MEH - poly(2-methoxy-5-(2'-ethyl-hexyloxy)-1,4-phenylene vinylene)
MPA – mercaptopropionic acid NIR- Near Infra-red
NP – nanoplatelet ODE- Octadecene
Pen – Penicillamine PL- Photoluminescence
PLQY – Photoluminescence Quantum Yield QD – Quantum Dot
SEM – Scanning electron microscope TEM – Transmission electron microscope TGA – Thermogravimetric analysis TOP – Trioctylphosphine
TOPO – Trioctylphosphine oxide TP – Tetrapod
1
1
Chapter 1: Introduction
1.1
Introduction to band structure and semiconductors
The electrons in an atom may occupy discrete energy levels known as atomic
orbitals, a representation of the electron density around a nucleus. When atoms are
bound in molecules, their individual atomic orbitals combine to lower the overall
energy of the system, generating molecular orbitals which govern the electronic
properties of that molecule. This approach is known as the linear combination of
atomic orbitals. As more atoms are included in the system more molecular orbitals
are generated, and once you extend the system to a quasi-infinite solid each
molecular orbital is replaced with a band which will vary in energy as a function of
the phase of the orbitals in the solid as seen in Figure 1-1 below, where bonding and
anti-bonding represent the positive and negative overlap of orbitals respectively.
Figure 1-1: The conversion of orbitals into bands for bulk materials.
A material may be defined as a metal if the lowest unoccupied band (conduction
band) overlaps with the highest energy occupied band (valence band) allowing free
electron transport through the material. The difference in energy between the
2
semiconductor has a small band gap which can be overcome by thermal excitation,
and an insulator has a very large band gap as demonstrated in Figure 1-2 below:
Figure 1-2: Band structure of an insulator, semiconductor and metal.
1.2
Quantum Dots
When materials have 1 or more of their dimensions limited to the nanoscale (1 -100
nm) these materials can be considered as nanomaterials. As technology and theory
have advanced over the years the ability to create and analyse these materials has
vastly increased and today, they can find applications in nearly every aspect of
science. One of the greatest discoveries in the world of nanoscience is quantum dots
(QDs). When semiconductor crystals are of a small enough size so that they exhibit
quantum confinement effects (described below), they are known as quantum dots.
In semiconductors, when an electron is excited, it creates a positive hole in its
absence. The electron and hole are bound by Coulombic interaction and collectively
are known as an exciton. The distance between an excited electron and the positive
hole it generates is known as the Bohr excitonic radius of the semiconductor, rB. The
exciton Bohr radius of a material is given below in Equation 1-1:
𝑟𝐵 =ℏ
2𝜀
𝑒2 (
1
𝑚
𝑒∗ +1
𝑚
ℎ∗)3
Where e is the charge of the particle, me and mh are the effective masses of the
electron and hole respectively, and ε is the dielectric constant of the material. The
effective mass of an electron and hole change with different materials as does the
dielectric constant and so the Bohr exciton radius varies with different materials.
For example, indium phosphide1 has an r
B of 15 nm whereas CdSe2 has an rB of 5.6
nm. When the size of the semiconductor crystal is smaller than the Bohr excitonic
radius of the material, the exciton is said to be confined within a potential well,
similar to the particle in a box thought experiment. This excitonic confinement leads
to a number of size-dependent optoelectronic properties3,4. These include the
changing of the energy levels near the band edge from continuous to discreet, and
[image:26.595.67.492.359.602.2]a band gap dependent on nanocrystal diameter (Figure 1-3).
Figure 1-3 Effects of nanocrystal size on band gap properties.
The size dependant band-gap is one of the key features driving research in quantum
dots and was popularised by Brus et al5 in 1984 with his famous Brus equation seen
below (Equation 1-2):
∆𝐸(𝑟) = 𝐸𝑔𝑎𝑝+ ℎ
2
8𝑅2(
1 𝑚𝑒∗ +
4
Equation 1-2: The Brus Equation
Where ΔE(r) is the observed exciton energy, Egap is the band gap energy of the bulk
material, R is the QDs radius and me* and mh* are the effective masses of the
electron and hole respectively. Once a semiconductor undergoes confinement, the
probability of radiative exciton recombination is much higher than in the bulk. This
is due to a greater overlap between the electron and hole wavefunctions in the
confined regime6. Whereas in the bulk, the charge carriers are not confined and may
diffuse quickly increasing the likelihood of non-radiative decay. Therefore, QDs are
primarily used as nano-sized light emitting materials in photonics, optical sensing
and imaging.
As a result of quantum confinement, the size-dependent bandgap allows the tuning
of the optical properties of the QD by controlling the size, as seen in the theoretical
[image:27.595.155.483.396.642.2]photoluminescence (PL) spectrum Figure 1-4:
Figure 1-4: Theoretical PL spectra demonstrating size-dependent band gap of QDs.
Alternative methods for tuning the properties of quantum dots include doping7-9
and alloying10,11. Doping is of particular interest as adding very small amounts of a
dopant (around 1%) can drastically affect the properties of the QDs. Doping can be
5
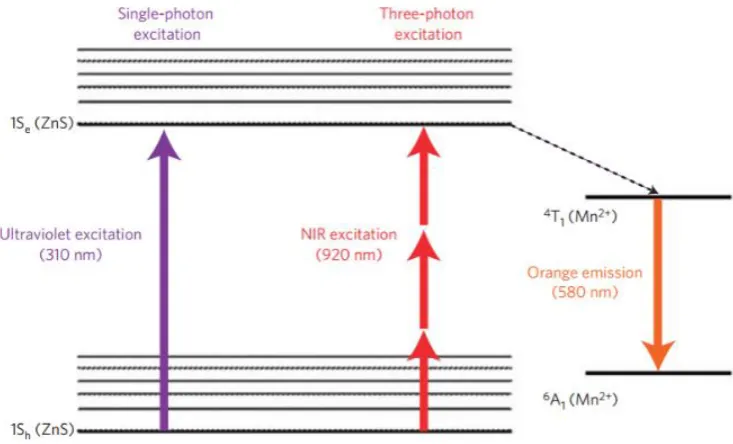
For example, Yu et al. demonstrated that doping zinc sulfide QDs with manganese
(II) provides an alternative phosphorescent decay pathway through the manganese
(4T
1 →6A1) which is red-shifted when compared to the undoped ZnS QDs13 emission.
This Stokes shift of nearly 300 nm eliminates the possibility of self-absorption
commonly seen in fluorophores. While excitation in the UV region is generally
damaging to cells, this can be avoided with the use of three-photon excitation via a
pulse laser combining three lower energy photons instead of one high energy
photon. The phosphorescent nature of the resultant luminescence is another
interesting property of the doped QDs, as detecting on a phosphorescent timescale
eliminates noise associated with background biological fluorescence14. Figure 1-5
below presents a simplified Jablonski diagram which shows the effects of doping ZnS
[image:28.595.102.469.371.593.2]quantum dots with manganese.
Figure 1-5: Diagram explaining Mn(II) doping effect on ZnS quantum dots
1.3
Synthesis of quantum dots
Quantum dots may be synthesised using a variety of methods such as chemical
vapour deposition15,16, spray pyrolysis17 and molecular beam epitaxy18, however,
Wet-6
chemical approaches produce colloidal quantum dots (CQDs) and will be discussed
below.
1.3.1
The development of colloidal quantum dot synthesis
Scientists such as Brus and Heinglein were the first to develop colloidal quantum dot
synthesis in the mid to late 80’s following Brus’ ground-breaking publication detailing the quantum confinement effect in semiconductor nanocrystals19-24. Early
syntheses of QDs were performed in the aqueous phase involving the solvation of
ions. While the authors of these papers pioneered the field, understanding of the
synthetic mechanisms was limited. These initial protocols involved precipitation
reactions in homogenous solutions with stabilising polymers or surfactants.
Concurrently, an arrested precipitation technique was developed growing the
nanocrystals in reverse micelles using amphiphilic stabilisers. This 2-phase method
improved colloidal stability and minimised aggregation, however quantum yields
remained low. These methods presented several advantages including simple
experimental preparation, common reagents, and low temperature synthesis,
however several drawbacks existed also. The low temperature approach led to poor
size control and weak photoluminescence quantum yields (PLQY). The poor PLQY
was attributed to a high degree of defect states present in the QDs due to the
presence of oxygen moieties and poor QD crystallinity. The lack of size control
caused a broadening of the absorption and emission characteristics limiting
potential applications also. It was clear by the early 90’s that the ability to synthesise
a highly crystalline, monodisperse QD had to be discovered in order to truly exploit
Brus’ discovery.
1.3.2
Organometallic synthesis of colloidal quantum dots
This paradigm shift in QD synthesis appeared in 1993 when Murray et al. published
their radical synthetic approach to producing highly crystalline CQDs with a narrow
size distribution(<5%)25. This was the first reported organometallic protocol for CQD
7
of co-ordinating capping agents in an organic solvent. To prepare CdS, CdSe, and
CdTe CQDs, dimethyl cadmium was used as a cadmium precursor while the
chalcogenide sources were phosphine bistrimethylsilyl sulphide, phosphine selenide
[image:30.595.211.344.171.365.2]and phosphine telluride respectively.
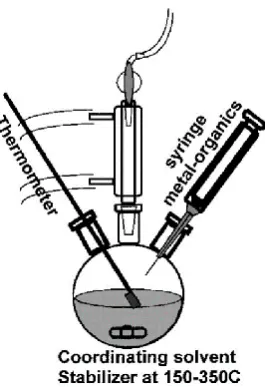
Figure 1-6 Hot injection technique for CQD synthesis (reproduced from ref26).
The solvent used in Murray’s reaction was a mixture of trioctylphsphine oxide
(TOPO) and trioctylphosphine (TOP), whose high boiling points facilitated the high
temperature synthesis. This synthesis was so ground breaking as not only did it
produce highly crystalline CQDs, but it allowed size control not previously recorded.
Using the above method, CQDs ranging from 1 to 12 nm were produced.
This method of injecting organometallic precursors into high temperature organic
solvents became known as hot injection and has largely shaped the CQD synthetic
landscape ever since (Figure 1-6). This rapid injection of the organometallic
precursor is the key to a narrow size distribution and monodispersity. This is due to
the temporal separation of the nucleation and growth phase of the QDs achieved
by creating a high monomer concentration in the hot solvent very quickly.
Quenching of the reaction rapidly before significant Ostwald ripening could take
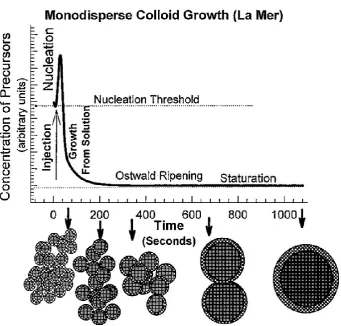
place was deemed crucial to retaining a narrow size distribution. The theory
underlying this growth mechanism predates QD’s by several decades as Dinegar and
8
in 195027. While previous QD synthesis required size selective fractioning in order to
explore Brus’ original findings, it was now possible to produce size-tuneable, crystalline QD size with a narrow size distribution without requiring post-synthetic
[image:31.595.146.488.190.516.2]processing.
Figure 1-7 La Mer model for colloidal growth in solution (Reproduced from ref.26).
Further advancements in the understanding of size control were developed by
Alivisatos et al. in their research on the focussing (narrowing) and defocussing
(broadening) of size distributions28. In this research he identified the factors
controlling the growth of II-VI (CdS, CdSe) and III-V (InAs, InP) QDs. Alivisatos
reported that, assuming the growth rate is a diffusion limited process, the size
dependant growth of QDs can be described by the equation below, considering the
9
𝑆𝑟 = 𝑆𝑏exp(2𝜎𝑉𝑚 𝑟𝑅𝑇 )
Equation 1-3 Solubility of nanocrystal as a function of the crystal size where Sr =
nanocrystal solubility; Sb = bulk crystal solubility; σ = surface energy; Vm = molar
volume; R = gas constant; T = temperature; r = nanocrystal radius
𝑖𝑓2𝜎𝑉𝑚
𝑟𝑅𝑇 ≪ 1𝑡ℎ𝑒𝑛
𝑑𝑟
𝑑𝑡 = 𝐾(
1 𝑟+
1 𝛿)(
1 𝑟∗−
1 𝑟)
Equation 1-4 Nanocrystal growth rate as a function of time (constant described below)
In the above equation, K is a constant related to the diffusion constant of the
monomer. δ is the diffusion layer thickness. r* is the zero-growth rate nanocrystal
size (radius) for a given monomer concentration, otherwise known as the critical
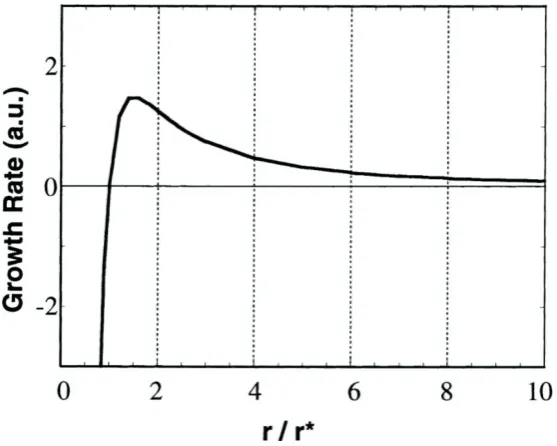
size. Sugimoto et al. plot the growth rate of nanocrystals as a function r/r* and
[image:32.595.137.416.366.589.2]describes how crystals above or below this critical size behave (Figure 1-8).
Figure 1-8 Effect of nanocrystal size on growth rate (reproduced from ref.29).
From the above it becomes clear that there is distinct difference in the growth rate
of QDs larger than the critical size and smaller than the critical size. QDs smaller
than the critical size (r/r* < 1) display a negative growth and therefore dissolve.
Whereas QDs larger than the critical size grow at a rate which is largely dependent
10
r*. In this regime, the larger QDs grow more slowly than the smaller ones and a
narrowing of the distribution takes place. As a consequence of this process, the
monomer concentration is decreased and the critical size increases. Now QDs
smaller than the increased r* start to decrease in size while the larger ones continue
to grow, this process is known as Ostwald ripening (defocussing). In order to refocus
the size distribution additional monomer must be added in order to decrease the
critical size r* once again28.
1.3.3
Core-shell quantum dots
Due to the small size of QDs, a large proportion of the atoms are on the surface and
so surface science become incredibly important when compared to bulk materials.
Due to the lower co-ordination number of surface atoms compare to bulk, dangling
bonds may be present on the surface. If the energy of the states in these dangling
bonds overlaps with the bands of the bulk, electron and hole trapping can take place
decreasing PLQY. For example, in CdSe, the dangling bonds in surface cadmium
atoms behave as electron traps and the dangling bonds in the surface selenium
atoms act as hole traps. In addition, distortion of the crystal lattice at the QD surface
can introduce added trap states. This was one of the reasons that early CdSe QDs
capped with organic ligands reported PLQYs primarily in the 5 to 15% range25,30. Due
to the bulky nature of the organic ligands, it was proving difficult to achieve
complete surface passivation and dangling bonds where somewhat unavoidable.
The solution required passivation of both cationic and anionic surface atoms in
order to limit both electron and hole traps simultaneously.
The major breakthrough in achieving higher PLQYs occurred when Guyot-Sionnest
and Hines overcoated CdSe QDs with a wider band gap semiconductor, ZnS, to
achieve a PLQY of 50%25. This was the first reported case of a core-shell QD and the
large increase in PLQY is attributed to several factors. Firstly, by growing ZnS
epitaxially on the surface simultaneous passivation of both the cation and anion
11
surface photooxidation of the emissive core is prevented, further limiting the
potential for trap states. As the number of trap states decreases, the probability of
radiative recombination increases and so the PLQY increases too. Finally, by using a
wider bang gap semiconductor as the shell, greater confinement of the exciton is
achieved. When a wider bandgap semiconductor is used as the shell the core-shell
QD is known as type I although type II and reverse type I also exist (Figure 1-9).
Figure 1-9 Band gap alignment in type I, reverse type I and type II core shell QDs.
Type I core shell structures confine the exciton to the core and are primarily used in
the synthesis of high PLQY QDs where more recent synthetic protocols have
produced CdSe/CdS QDs with PLQYs in excess of 95%31,32. Similar PLQYs have been
reported for CdSe/ZnS core shell structures33. Reverse type I QDs use a smaller band
gap material as the shell and therefore confine the exciton in the shell such as
ZnSe/CdSe QDs and type II QDs are composed of 2 materials where there is band
mismatch between the core and shell. In type II QDs, the hole and the electron
reside in separate layer of the QD (either core or shell) depending on the materials
used. In the case of type II QDs, the emitted photon energy is equal to the energy
offset between the core and the shell.
Initial core-shell structures were prepared using a multi-stage process where the
core seeds are synthesised and purified, followed by the growth of a shell in a
separate reaction. Subsequently, newer core-shell preparations using a single step
12
InP/ZnS35 and CdSe/CdS36-38. As demands for precise shell thickness increased, a
method known as successive ion layer adsorption and reaction (SILAR) was used for
the synthesis of core-shell heterostructures39. Although this technique was
developed to deposit thin films it has been successfully adopted for the preparation
of a wide range of QD heterostructures40-43.
1.3.4
Aqueous synthesis of Quantum dots
While organometallic approaches to producing quantum dots offer several
advantages, development in the aqueous synthesis of QDs has continued ever since
the initial research of Brus and Heinglein. A lot of this research was carried out by
Heinlein’s colleagues such as Weller44-46, Rogach47-51, Gao52-55 and Eychmüller56-58.
Hot injection techniques offer exceptional size and morphological control, yet
aqueous synthesis offers significant advantages in terms of scalability, greener
synthesis and cost-effectiveness. Furthermore, aqueous syntheses offer a far
greater range of surface modification without including an extra ligand exchange
step. The aqueous compatibility of a wide variety of biomolecules such as
nucleotides, amino acids and proteins allow them to be used directly as ligands
producing bio-functional nanoparticles in a one step process. To take this one step
further, aqueous techniques have even expanded to the biosynthesis of QDs within
biological media59-61.
The aqueous synthesis of QDs is generally governed by 4 thermodynamic process:
the binding affinity for particle stabilising ligands; the binding affinity of hydroxyl
ions and water to the metals; the solubility product of the QD in solution; and finally,
the pH of the solution. These processes are largely governed by the theory of hard
and soft Lewis acids and bases (HSAB theory)62 as aqueous QD synthesis primarily
involves Lewis acid and Lewis base reactions. The added complexity of aqueous
synthesis, compared to organic synthesis, is the introduction of OH-, H+, and H 2O
13
their effect on synthesis is beyond the remit of this thesis however the example of
pH will be discussed as it is a highly important factor in aqueous synthesis63-66. OH
-is a hard base according to HSAB theory and can form soluble and insoluble
metal-hydroxide complexes in solution. This process competes with the formation of the
intended metal chalcogenide semiconductor. As the hydroxide ion is considered a
“hard” ion, it prefers to bind to “hard” cations such as Zn2+. Therefore, precise pH
control is necessary to avoid the formation of Zn(OH)2 when synthesising Zinc
containing QDs67,68. By comparison, Cd2+is considered a “softer” cation and so there
is less concern for the formation of Cd(OH)2. Therefore, the synthesis of cadmium
containing QDs will tolerate a higher concentration of OH- ions. Despite being more
tolerant than zinc based synthesis, there is still a limit. Exemplified in the synthesis
of CdTe QDs where it was shown that exceeding a pH of 10.5 led to the undesirable
formation of insoluble Cd(OH)3- and Cd(OH)42- complexes57.
From a synthetic point of view, the synthesis of QDs in the aqueous phase is
primarily based on simple precipitation reactions where the use of an appropriate
capping ligand controls the growth to the correct size. Among ligands, thiol
containing ligands such as mercaptopropionic acid (MPA) and thioglycolic acid (TGA)
have found widespread use due to their proven applicability in the synthesis of a
wide range of QDs. In the case of cadmium sulphide QDs, thiol ligands have even
been successful in producing ultra-small clusters69,70, highlighting the control
afforded by thiol ligands. Due to its comparable success compared to the
preparation of CdS and CdSe, the aqueous synthesis of CdTe has received significant
attention.
Initial CdTe aqueous synthesis was carried out by reacting Cd2+ with Na
2Te directly
using a polyphosphate ligand,71 however the resultant QDs did not exhibit
fluorescence. Rogach et al. used mercapto-ethanol as the ligand leading to
significantly better results, reporting a PLQY of 3%48. While still low, it demonstrated
14
capping agents could be used to control QD growth. Gao et al. used thioacids such
as MPA54 and TGA52 to drastically improve the PLQYs, reporting PLQYs of 38% and
18% respectively. Using TGA and its derivatives, a wide range of interesting shapes
could be synthesised including rods72, wires73, twisted ribbons74, and nanosheets75.
Hydrothermal76,77 and microwave assisted78,79 techniques for the synthesis of CdTe
QDs have also been developed based on previously optimised reactant
concentrations. The mercapto acid approach for the synthesis of CdTe QDs has been
applied to a wide range of other materials including: PbS and PbSe80,81; AgS82,
AgSe83, and Ag
2Te84; ZnS85, ZnSe86,87, and ZnTe67.
1.4
Anisotropic Nanostructures
Quantum dots are so named because they demonstrate quantum confinement
effects in all three dimensions, due to their spherical shape. However, it is possible
to synthesise a variety of other quantum confined nanostructures which
demonstrate confinement in either 1 or 2 dimensions. When particles are confined
in 2 dimensions, they are known as either rods or wires, and if they are confined in
only one dimension, they are known as platelets or sheets, confined within a
quantum well. Figure 1-10 below schematically presents the density of states for
these three different confinement regimes88,89. One special case of the quantum rod
is the dot-in-tetrapod90, which, from a confinement perspective may be seen as an
15
Figure 1-10: Density of states for materials either not confined (A) or confined in (B) 1, (C) 2 or (D) 3 dimensions (reproduced from ref91).
1.5
Quantum Rods and Dot-in-Tetrapods
Quantum rods were first controllably prepared by Peng et al. in 2000 when this
group synthesised anisotropic wurtzite CdSe quantum rods. In this report, it was
suggested that anisotropic growth could be driven by highly binding
hexyl-phosphonic acid as a ligand92. Scher and Alivisatos suggest that the phosphonic acid
binds more strongly to certain crystal faces limiting growth in those directions which
directs anisotropic rod growth93. It was subsequently proposed that high monomer
concentrations would preferentially drive growth along the c-axis of the wurtzite
crystal structure94. This is because as anisotropy increases so do the surface energy
and chemical potential, therefore to promote anisotropic growth an environment
with a high chemical potential such as a high monomer concentration is required95.
Later on new heterogenous core-shell dot-in-rod structures with very high quantum
yields were developed. Talapin et al. proposed the mechanism for anisotropic CdS
shell growth over CdSe seeds leading to the formation of CdSe-CdS dot in rods96.
Several factors seem to promote anisotropic shell growth. Firstly, the lattice
constant mismatch for hexagonal CdSe and CdS is larger along the (100) direction.
This means that the growth of CdS upon the (100) surface of CdSe is slower due to
greater interfacial strain than on the (001) or (001̅) surface. Secondly, the cadmium
atoms on the (001̅) surface are more reactive due to an increased number of
dangling bonds compared to either the (100) or (001) surface. Thirdly, the use of
hexadecylamine in the shell growth promotes growth along the C axis, which also
occurs in the synthesis of pure CdS rods97. Finally, temperature has a significant
impact on the shape control in the synthesis. The shell growth is performed at lower
temperatures as the kinetic driving force of the reaction (preferential growth along
the c-axis) is overcome thermodynamically at higher temperatures leading to
16
demonstrate far higher quantum yields than their homogenous CdSe analogues and
have subsequently found applications in a variety of fields.
Similar techniques have been developed for the synthesis of CdSe-CdS
dot-in-tetrapods. To synthesise tetrapods in this way, it is required to produce a zinc blende
cubic CdSe core before growing four CdS wurtzite nanorods from the cores (111),
(111̅), (1̅1̅1) and (1̅11̅) surfaces98. A schematic of the dot-in-rod and dot-in-tetrapod
is presented below in Figure 1-11.
Figure 1-11 Diagram describing CdSe-CdS dot-in-rod and dot-in-tetrapod.
1.6
Applications of QDs in optoelectronics
Due to the unique optical and electronic properties of QDs, they are finding
applications in a wide range of fields. The field of QD based optoelectronic devices
has expanded rapidly in recent decades especially (Figure 1-12). Colvin et al.
reported the first QD-LED prepared with CdSe QDs and p-paraphenylene vinylene
contained within a layer of indium tin oxide (ITO) and a magnesium electrode
however they exhibited a very low quantum efficiency of 0.01%. Since then,
improvements in QD synthesis, device fabrications, and charge transport materials
have all contributed to huge advancements in the field and recent QD-LED report
external efficiencies as high as 18%99. Since the initial development of QD-LEDs,
quantum dots have been proven effective in the development of solar cells100-104,
17
applications it is the versatile tuneability of the absorption and emission that lends
[image:40.595.155.397.126.370.2]itself to successful QD technology.
Figure 1-12 Optoelectronic applications of quantum dots (reproduced from ref.119).
By narrowing the QD emission as much as possible, QD-LEDs have been
implemented in a variety of display technologies including modern televisions120,121.
Contrasting this, by broadening the emission as much as possible QD-LEDs have
found applications as efficient light sources120. As high photoluminescence quantum
yields (PLQY) are required for either of these QD-LED applications to succeed, it
becomes evident that effective preparation of high PLQY QDs is essential.
Consequently, a huge array of high PLQY core-shell QD structures have been
implemented in QD-LED technology. Furthermore, it has been demonstrated that
alloyed QDs exhibit a softened confinement regime when compared to unalloyed
QDs122. This smoothing of the confinement regime decreases Auger recombination
by up to three orders of magnitude which is beneficial for LED technology. From the
above one can conclude that an alloyed core coupled with an effective shelling
regime produces QDs with optimal properties for LEDs.
While defective trap states would limit the efficiency of QD-LEDs, they become
18
sites. Lead sulphide QDs have been largely adopted for photodetection due to
absorbing over a broad range while being rich in intra-bandgap trap states. In the
case of PbS, these states are largely due to a combination of oxide species and
non-stoichiometric variance122,123.
In all of these applications it is evident that the large spectral range QDs absorb in
and the ability to “tune” the absorption is significant for their application. By varying the chemical configuration and size of the QD, significant amounts of the
electromagnetic spectrum, from NIR to UV, can be utilised (Figure 1-13). Concerns
over the toxicity of heavy metal containing QDs have been alleviated to some extent
in recent years resulting in the development of heavy metal free QDs such as InP
and CuInS2119.
Figure 1-13 Spectral range of heavy metal and heavy metal free QDs varying from UV to IR (reproduced from ref.119).
Finally, colloidal QDs demonstrate advantageous solution state processing potential
when compared with the alternatives allowing for the large-scale, affordable
preparation of optoelectronic devices. Recent advancements of QD surface
modifications pre-fabrication further expand the manufacturing potential. For
example, by replacing organic surface ligands with halide inorganic ligands increased
stability and charge carrier transport were achieved124,125. While most work up until
recently has focused on small scale fabrication techniques including spin and
dip-coating, more recent efforts have focused on the production of large QD films for
19
film technology for solar cells127, photodetectors128 and LEDs129. Doctor blading is
another viable technique for the production of QD based thin film devices. This
technique uses a blade to deposit and spread a solution over a film with precise
thickness control. Importantly it easily scalable as it can be applied in a process
called roll-to-roll knife coating130,131 for cheap large scale film production. Recently,
large (2700 cm2) CdSe/Cd
1-xZnxS QD/PVK luminescent solar concentrators were
produced by Li et al. using this doctor blade approach132.
1.6.1
Quantum dot light emitting diodes
Quantum dot LEDs operate on the principles of electroluminescence, a
phenomenon first reported by Round et al in 1907133, where electron/hole
generation is achieved using an applied voltage, followed by radiative
recombination. In LEDs, a voltage is applied across a p-n junction and radiative
recombination of separated electrons and holes takes place. QD-LEDs operate by
using an applied voltage to inject electrons and holes into a quantum dot layer
through charge transport layers (CTLs), allowing for radiative recombination within
the QD. A typical QD-LED is presented below in Figure 1-14.
Figure 1-14 Typical QD LED (reproduced from ref.134).
The original QD-LED produced by Colvin et al135 reported a very low external
quantum efficiency (EQE) of 0.01% primarily because QD synthesis was in its infancy
20
improved PLQYs were developed, their inclusion in QD-LEDs shortly followed136,137.
However, as reported by Mattoussi et al137, the increased efficiency in PLQY did not
translate to a proportional increase in LED external efficiency as the charge
transport layers (CTLs) became the limiting component in the device. The use of high
PLQY QDs allowed for very thin QD emitting monolayers, which in turn led to
improvements in electron and hole transport138. With this new method, the
conducting polymer layer was replaced by small organic molecules as charge
transport layers139. By eliminating the polymer electroluminescence, greater colour
purity was achieved and devices exhibiting an EQE as high as 2.7% was reported by
Anikeeva et a140l.
The next development in QD-LED technology was facilitated by the removal of
organic molecules entirely when novel electron transporting layers (ETL) and hole
transporting layers (HTL) were developed entirely from inorganic systems. Examples
include the use of CuO as a HTL141, ZrO
2142 or ZnO nanoparticles for an ETL143, or a
combination of MoO3 and TiO2 for an effecting CTL144. As the use of sequential
inorganic layers led to interfacial defects, surface ligand modification was, again,
implemented to reduce this issue. A tripling in EQE efficiency was reported when
7,7,8,8-tetracyanoquinodimethane was incorporated between the ZnO ETL and the
emissive QD layer145. Subsequent generations of QD-LEDs employed a combination
of inorganic and organic layers for CTLs as the sputtering process for depositing the
oxide layer on top of the QDs was damaging the QDs. In this generation of QD-LEDs
the HTL was built from a combination of PEDOT:PSS and either poly-TPD or TFD 146-149. Further advancements on this design were carried out by Chen et al where the
proposed that incorporating graphene oxide into the PEDOT:PSS layer improves
band alignment between the HTL and the QD layer150. This was due to the an
increased hole injection rate into the QDs as the HOMO level of the GO/PEDOT:PSS
21
While continued advancements in cadmium based QD-LEDs have led to highly
efficient QD-LEDs there is still an underlying question of their safety due to the
presence of heavy metals. More recently, efforts have been made to use cadmium
free QDs for QD-LED devices. For example, InP QDs have been implemented in a
number of QD-LED devices151,152. By using InP/ZnS core-shell QDs, not only have
improvements in quantum yields been demonstrated, but the ability to tune the
emission across the whole visible spectrum has been shown153. Other examples of
cadmium free QD-LEDs include more complicated ternary systems such as I-III-VI
QDs. Initially reported by Malik et al. these QDs demonstrated interesting optical
properties such as a large Stokes shift and extended PL lifetimes154. While these QDs
have been used in a number of QD-LEDs155,156, more recently Yang et al prepared
highly effective CuInS/ZnS core-shell QD-LEDs157. These QDs were prepared by the
sequential growth of 3 shells creating a thick outer shell and an alloyed core
providing less lattice strain at the core-shell interface. Due to this structure, Auger
recombination was minimised and an EQE of 7.3% was achieved, which is impressive
for cadmium free systems. As is reported for these ternary QDs, the emission can
be tuned over the whole visible spectrum by varying the ratio of copper to indium
in the core. Alternative cadmium free QD-LEDs have been prepared using
quaternary QD systems including CuZnInS158 and CuInGaS159. Similar to the tertiary
systems, the optical properties of these quaternary systems can be tuned by varying
the stoichiometric ratio in the core, in doing this, the entire visible spectrum can be
emitted. For example, green, red, and yellow emitting CuInZnS/ZnS core shell QDs
were used to produce QD-LEDs by varying the copper content in the cores160. The
QD-LEDs exhibited an EQE of 2.42%, significantly lower than the best cadmium
containing QD-LEDs.
1.6.2
Quantum dot based solar cells
Solar energy involves the harvesting of sun light to generate an electric current, and
QDs have been extensively explored for their potential in solar cell technology. This
22
processing161-163. By utilising solution processing in colloidal quantum dot solar cell
fabrication, costs can be hugely reduced through the use of roll-to-roll and spray
coating techniques. Solar cell efficiency is generally quoted as power conversion
efficiency (PCE), the ability for a PV cell to convert sunlight into current. It is
described below in Equation 1-5 and facilitates the standardised comparison of
different PV cell efficiencies.
𝑃𝐶𝐸 =
𝐼
𝑆𝐶𝑉
𝑂𝐶𝐹𝐹
𝑃
𝑙𝑖𝑔ℎ𝑡Equation 1-5 Determination of the power conversion efficiency of a photovoltaic device. ISC is the short circuit current, VOC is the open circuit voltage, FF is the fill factor, and Plight is
the power of the incident radiation.
All QD solar cells operate under the same general principle: incident sunlight is
absorbed by the QD layer generating an exciton, the hole and excited electron are
separated and diffuse through conducting layers and subsequently recombine
generating electricity. Initial QD PV cells were based upon a simple Schottky junction
between a semiconductor and a metal. Primarily these cells inc