Abstract
—
Production and Operations Management Organizations are continually faced with the challenge of maximizing profit while incurring cost. Poor production planning subjects the organization to promote more expenses rather than revenue. In this paper optimization of production processes was treated as a linear programming problem which resulted in the implementation of a linear programming model for Hebron Drinks, a Nigerian Beverage Industry. This work was carried out through the access of relevant literatures, primary sources of data; information analysis was carried out using the simplex method. In our aim to maximize profit and minimize cost, a linear programming model was designed taking into consideration records such as sales, costs, human resources, salaries and wages, energy and power consumption and revenue. Results were generated using a Computer Aided Software tool - ( LiPS-1.11.0). Interpretations of the results from the analysis formed basis for recommendations to enhance managerial decisions. Specifically, the production capacity of Black Currant juice should increase by four units within a production period to maximize the profit of the company within the period.Index Terms—Hebron drinks, Simplex Method, Operations Research, Optimization, Linear Programming, Production Processes
.
I. INTRODUCTION
USINESS everywhere throughout the world, including the ones in Nigeria, are persistently faced with deficiencies of generation inputs which result in low capacity use and thus low yields. Be that as it may, an economy can only grow if administration choices at the firm level outcome in supported output through either cost minimization or output maximization culminating in increases generation in the real sector of the economy.
Manuscript received February 10, 2018; revised March 22, 2018. This work was supported by Covenant University and University of Johannesburg.
Improving Hebron Drinks Company Value through Optimization of Production Processes using Operations Research Model
Michael C. Agarana is with Covenant University, Nigeria. He is presently a Post-Doctoral Fellow with the Department of Mechanical Engineering
Science, University of Johannesburg, South Africa. (phone: +234 8023214236; e-mail: [email protected].) Bishop Sheila is with Covenant University, Nigeria. She is presently the Head of Mathematics Department. (phone: +234 7081203200;
e-mail: [email protected]).
Olawoye Simisola is with covenant University. She is a Post graduate student.
Subsequently firm directors are continually looking for the correct choices to meet their targets which essentially revolve on how best to increase profit. (Ezema et al., 2012). Production is the core procedure of each manufacturing organization, thus the productivity and quality of decision taken on the shop floor decides the execution of the organization’s quality administration framework. At planning stage, a great production manager must have the capacity to distinguish plausible restrictions keeping in mind the end goal to build up, preceding item realization processes, the suitable preventive measures, an enhanced production process is in this way described by the accessibility of wanted yield of products in type and quantity inside the arranged time at least cost. ( Berrichi et al., 2012). Most organizations are frequently faced with decisions identifying with the utilization of constrained resources which incorporates men, materials, money and the issue of decision making depends on the most proficient method to settle on which resources would be allocated to get the best outcome, which may relate to profit or cost or both. (Muazu et al., 2012). Hebron drinks is a company in Nigeria that produces various types of beverages. It started production with two products in 2004, namely the sachet and bottled water. Black currant drink was later introduced by the company. Subsequently, the carbonated drinks, yoghurt were also introduced. A pet brewing unit which specializes in the making of various sizes of bottles for the company was later built within the company. The company has 52 staff including the unskilled, who help in the production processes of the products. The following categories of inputs are used in the company’s operations processes: manpower, raw materials, machine, cost, energy. The company’s profitability profile shows that profit continued to vary each year, in order to ensure optimum profit for the company, optimal production level that effectively utilize the available resources have to be determined. Most beverage companies operation processes include treating the water, compounding ingredients, carbonating products, filling products and packaging. This is the case in Hebron drinks company. Hebron drinks adopt the use of standard operation procedure (SOP) to produce their products. This process document which gives detailed description on how an operator should perform his operations. The purpose of SOPs today is to guarantee that all workers are performing tasks in the same way, to get an expected output. The research is gone for how constrained resources, crude materials can be utilized to acquire maximum contribution to profit, it is likewise aimed at deciding the product that contribute to such profit. (Agarana and Ayeni, 2015; Agarana, Bishop and Odetunmibi, 2014),)
Improving Hebron Drinks Company Value
through Optimization of Production Processes
using Operations Research Model
Michael C. Agarana, Member, IAENG, Bishop Sheila and Olawoye Simisola
Among its noteworthiness are that it is a widely applicable problem-solving model and positioned among the most scientific advances of the twentieth century. It has been applied in areas like management, financial matters, research, software engineering, and the sky is the limit from there. [Agarana and Ehigbochie, 2015; Agarana, Owoloko and Kolawole, 2016),]. The contributions of the operations processes are maximized utilizing linear programming method with a specific end goal to turn out optimal outputs. From perception, a few inquiries ring a bell with respect to why they are not utilizing linear programming for their decision making. secondly, what in truth are the potential advantages of linear programming model to the organization? Thirdly, would they be able to make higher profit by adopting the linear programming technique in determining the product mix and enhance production processes? The Mathematical model used in this paper is Linear Programming model. Linear Programming is a branch of Mathematics that deals with solving optimization problems. It consists of linear function to be minimized or maximized subject to certain constraints (Olsen, 2012). Linear programming is a mathematical model used to solve maximization or minimization problems. It is an operations research technique is widely used in finding solutions to complex managerial decision problems. Linear Programming is used in Company Management to get an optimum output.
II. PROBLEMFORMULATION
This paper sets out to optimize the operation processes of Hebron Drinks in order to improve the company’s value in terms of maximizing her profitability using operations research model.
A. The Activities
The activities of the company include: Activity 1 - production of Sachet water, Activity 2 – production of Bottle Water, Activity 3 - production of Yoghurt, Activity 4 - production of Orange Juice, Activity 5 - production of Apple Juice, Activity 6 - production of Black currant Juice.
B. Constraints
Raw Material, Man Power, Machine Hour, Cost and Energy are the resources These resources are usually limited. These resources constitute the inputs to the operations processes. The available quantity of these resources of Hebron drinks for a period of one week was used in this paper.
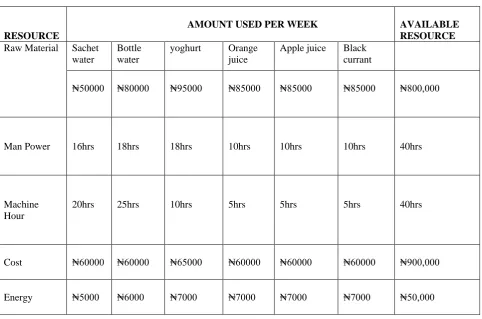
C. Resources Available for a Week
The following are the available quantity of these resources for a week, according to the information gathered from the management of the company. Cost of maintenance of machine, power supply, cost of labour, raw materials used in production of each product, quantity of each products produced, capital outlay of each products and all other useful information are as shown in the table I.
D. Contributions
The contributions of the activities to the company’s profit, are as follows:
C1=60%, C2=80%, C3=70%, C4=60%, C5 = 50%, C6=70%
Where,
C1 represents the percentage contribution from Sachet Water production
C2 represents the percentage contribution from Bottle water production
C3 represents the percentage contribution from yoghurt production
C4 represents the percentage contribution from Apple Juice production
C5 represents the percentage contribution from Orange juice production
C6 represents the percentage contribution from Black Currant juice production
A. Mathematical Representation
Let the decision variables; X1, X2, X3, X4, X5, X6, represent increase in the activities, as follows: X1 represents increase in Sachet Water production X2 represents increase in Bottle water production X3 represents increase in yoghurt production X4 represents increase in Apple Juice production X5 represents increase in Orange juice production X6 represents increase in Black Currant juice production
B. Mathematical Representation
Let the decision variables; X1, X2, X3, X4, X5, X6, represent increase in the activities, as follows: X1 represents increase in Sachet Water production X2 represents increase in Bottle water production
X3 represents increase in yoghurt production X4 represents increase in Apple Juice production X5 represents increase in Orange juice production X6 represents increase in Black Currant juice production
The Objective function becomes:
That is
Maximize Z = C1X1 + C2X2 + C3X3 + C4X4 + C5X5 +C6X6
= 60X1 + 80X2 + 70X3 + 60X4 + 50X5 +70X6
C. Quantity of Material per Unit of Activity
Let aij represent the amount of available of resource i per unit of activity j:
a16 = Amount of raw material needed for 6th activity
D. Labour Hour per Unit of Activity
a21 = Manpower hour needed for 1st activity a22 = Manpower hour needed for 2nd activity a23 = Manpower hour needed for 3rd activity a24 = Manpower hour needed for 4th activity a25 = Manpower hour needed for 5th activity a26 = Manpower hour needed for 6th activity
E. Machine Hour per Unit of Activity
a31 = Machine time needed for 1st activity a32 = Machine time needed for 2nd activity a33 = Machine time needed for 3rd activity a34 = Machine time needed for 4th activity a35 = Machine time needed for 5th activity a36 = Machine time needed for 6th activity
F. Cost per Unit of Activity
a41 = cost needed for activity 1 a42 = cost needed for activity 2 a43 = cost needed for activity 3 a44 = cost needed for activity 4 a45 = cost needed for activity 5 a46 = cost needed for activity 6
G. Amount of Energy per Unit of Activity
a51 = unit of energy for activity 1 a52 = unit of energy for activity 2 a53 = unit of energy for activity 3 a54 = unit of energy for activity 4 a55 = unit of energy for activity 5 a56 = unit of energy for activity 6
H. The Constraints in Mathematical Form
The Constraints are as follows:
5 6
1 1
ij j i i j
a x
b
Where, bi represent the available resources, i=1, 2, 3,4,5 From the data gathered, the values of aij are as follows: a11 = 50000, a12 = 80000, a13 =95000, a14 = 85000, a15 = 85000, a16 = 85000
a21 = 16, a22 = 18, a23 = 18, a24 = 10, a25 = 10, a26 = 10 a31 = 20, a32 = 25, a33 = 10, a34 = 5, a35 = 5, a36 =5 a41 =60000, a42 =60000, a43 =65000, a44 =60000, a45 = 6000, a46 = 60000
a51 = 5000, a52 = 6000, a53 = 7000, a54 = 7000, a55 = 7000, a56 = 7000
III THE MODEL
Maximise Z = 60x1 + 80x2 + 70x3 + 60x4 + 50x5 +70x6 Subject to:
50000x1 + 80000x2 + 95000x3 + 85000x4 + 85000x5 + 85000x6 ≤800000
16x1 + 18x2 + 18x3 + 10x4 + 10x5 + 10x6 ≤40
20x1 + 25x2 + 10x3 + 5x4 + 5x5 + 5x6 ≤40
60000x1 + 60000x2 + 65000x3 + 60000x4 + 60000x5 + 60000x6 ≤900000
5000x1 + 6000x2 + 7000x3 + 7000x4 + 7000x5 + 7000x6 ≤50000
xi ≥ 0 ; i =1 , 2,…,5
A. The Standardized Model
Maximise Z = 60x1 + 80x2 + 70x3 + 60x4 + 50x5 +70x6
Subject to:
50000x1 + 80000x2 + 95000x3 + 85000x4 + 85000x5 + 85000x6 + X7 =800000
16x1 + 18x2 + 18x3 + 10x4 + 10x5 + 10x6 + X8 =40 20x1 + 25x2 + 10x3 + 5x4 + 5x5 + 5x6 + X9 =40 60000x1 + 60000x2 + 65000x3 + 60000x4 + 60000x5 + 60000x6 + X10 =900000
5000x1 + 6000x2 + 7000x3 + 7000x4 + 7000x5 + 7000x6 + X11 =50000
xi ≥ 0 ; i =1 , 2,…,5 IV MODEL SOLUTION
The simplex method is applied to the Standardized model. The initial simplex tableau is in Table II.
V RESULT DISCUSION
In this study, six decision variables, x1, x2… x6 were considered. They represent increase in the activities of Hebron drinks. Five constraints were also considered, excluding the non-negativity constraint. A computer software known as ( LiPS-1.11.0) was used to solve the LP problem. The following results were obtained; variable x6= 4. The other five r decision variables however have zero value. This implies that the number of black currant juice expected to be produced, within one week, should increase by 4 units in order to maximize the profit of Hebron Drinks Company. Other activities of the company should remain as they were.
VI. CONCLUSION
Table I: Amount of available resources used per week
Table 2: Initial Simplex Tableau
Solution
variable
X1
X2
X3
X4
X5
X6
X7
X8
X9
X10
X11
Solution quantity
X7
50000 80000 95000 85000 85000 85000 1
0
0
0
0
800000
X8
16
18
18
10
10
10
0
1
0
0
0
40
X9
20
25
10
5
5
5
0
0
1
0
0
40
X10
60000 60000 65000 60000 60000 60000 0
0
0
1
0
900000
X11
5000
6000
7000
7000
7000
7000
0
0
0
0
1
50000
z
60
80
70
60
50
70
0
0
0
0
0
RESOURCE
AMOUNT USED PER WEEK AVAILABLE
RESOURCE
Raw Material Sachet water
Bottle water
yoghurt Orange juice
Apple juice Black currant
₦50000 ₦80000 ₦95000 ₦85000 ₦85000 ₦85000 ₦800,000
Man Power 16hrs 18hrs 18hrs 10hrs 10hrs 10hrs 40hrs
Machine Hour
20hrs 25hrs 10hrs 5hrs 5hrs 5hrs 40hrs
Cost ₦60000 ₦60000 ₦65000 ₦60000 ₦60000 ₦60000 ₦900,000
References
[1] Balogun.O.S.,and Muazu H.G. (2012). “Use of Linear Programming for Optimal Production In A Production Line In Coca –Cola Bottling Company”. Journal of Engineering Research and Applications 2: pg 2.
[2] Agarana,M.C., and F.Ayeni.(2015). “Maximizing Operations Processes of a Potential World Class University Using Mathematical Model”, International journal of Mathematics and Computer Application research, pg 59-63.
[3] Erica Olsen, Strategic Planning kit for Dummies. 2nd Edition.
[4] Berrichi, A., Yalaoui, F., Amodeo, L., and Mezghiche, M. (2010). “Computers and Operations Research”, volume 37, pages 1584 – 1596.
[5] Agarana, M.C., and Ehigbochie, A.I. (2015). “optimization of students’ academic performance in a world-class university using operational research technique”, International journal of Mathematics and Computer Application research, Vol. 5, Pg. 43-50
[6] Ezema,B,I.,and Amakom, U. (2012). “Optimizing Profit with the Linear Programming Model: A Focus on Golden Plastic Industry Limited”, Interdisciplinary Journal of Research in Business Vol. 2, pp.37- 49.
[7] M.C. Agarana and T.O. Olokunde, (2015), Optimization of Healthcare pathways in Covenant University Health Centre using Linear Programing Model, Far East Journal of Applied Mathematics, 91(3), pp. 215-228.
[8] Agarana M. C., Owoloko E. A. and Kolawole A. A. (2016), Enhancing the Movement of People and Goods in a Potential World Class University using Transportation Model, Global Journal of Pure and Applied Mathematics. ISSN 0973-1768 Volume 12, Number 1, pp. 281-
[9] Agarana M. C, Bishop S. A & Odetunmibi O. A (2014), Optimization Of Banks Loan Portfolio Management Using Goal Programming Technique, Impact: International Journal Of Research In Applied, Natural and Social Sciences (Impact: Ijranss) Issn(E): 2321-8851; Issn(P): 2347-4580 Vol. 2, Issue 8, Aug 2014, 43-52 © Impact Journals