http://wrap.warwick.ac.uk
Original citation:
Taylor-Phillips, Sian, Freeman, Karoline, Geppert, Julia, Agbebiyi, Adeola, Uthman, Olalekan A., Madan, Jason, Clarke, Angus, Quenby, Siobhan and Clarke, Aileen. (2016) Accuracy of non-invasive prenatal testing using cell-free DNA for detection of Down, Edwards and Patau syndromes : a systematic review and meta-analysis. BMJ Open, 6 (1). e010002.
Permanent WRAP url:
http://wrap.warwick.ac.uk/76523
Copyright and reuse:
The Warwick Research Archive Portal (WRAP) makes this work of researchers of the University of Warwick available open access under the following conditions.
This article is made available under the Creative Commons Attribution 4.0 International license (CC BY 4.0) and may be reused according to the conditions of the license. For more details see: http://creativecommons.org/licenses/by/4.0/
A note on versions:
The version presented in WRAP is the published version, or, version of record, and may be cited as it appears here.
Accuracy of non-invasive prenatal
testing using cell-free DNA for
detection of Down, Edwards and Patau
syndromes: a systematic review and
meta-analysis
Sian Taylor-Phillips,1Karoline Freeman,1Julia Geppert,1Adeola Agbebiyi,1 Olalekan A Uthman,1Jason Madan,1Angus Clarke,2Siobhan Quenby,1 Aileen Clarke1
To cite:Taylor-Phillips S, Freeman K, Geppert J,et al. Accuracy of non-invasive prenatal testing using cell-free DNA for detection of Down, Edwards and Patau syndromes: a systematic review and meta-analysis.
BMJ Open2016;6:e010002. doi:10.1136/bmjopen-2015-010002
▸ Prepublication history and additional material is available. To view please visit the journal (http://dx.doi.org/10.1136/ bmjopen-2015-010002).
Received 15 September 2015 Revised 28 October 2015 Accepted 9 November 2015
1Warwick Medical School, The University of Warwick, Coventry, West Midlands, UK 2Institute of Cancer & Genetics, Cardiff University School of Medicine, Cardiff, UK
Correspondence to Professor Aileen Clarke; [email protected]
ABSTRACT
Objective:To measure test accuracy of non-invasive prenatal testing (NIPT) for Down, Edwards and Patau syndromes using cell-free fetal DNA and identify factors affecting accuracy.
Design:Systematic review and meta-analysis of published studies.
Data sources:PubMed, Ovid Medline, Ovid Embase and the Cochrane Library published from 1997 to 9 February 2015, followed by weekly autoalerts until 1 April 2015.
Eligibility criteria for selecting studies:English language journal articles describing case–control studies with≥15 trisomy cases or cohort studies with
≥50 pregnant women who had been given NIPT and a reference standard.
Results:41, 37 and 30 studies of 2012 publications retrieved were included in the review for Down, Edwards and Patau syndromes. Quality appraisal identified high risk of bias in included studies, funnel plots showed evidence of publication bias. Pooled sensitivity was 99.3% (95% CI 98.9% to 99.6%) for Down, 97.4% (95.8% to 98.4%) for Edwards, and 97.4% (86.1% to 99.6%) for Patau syndrome. The pooled specificity was 99.9% (99.9% to 100%) for all three trisomies. In 100 000 pregnancies in the general obstetric population we would expect 417, 89 and 40 cases of Downs, Edwards and Patau syndromes to be detected by NIPT, with 94, 154 and 42 false positive results. Sensitivity was lower in twin than singleton pregnancies, reduced by 9% for Down, 28% for Edwards and 22% for Patau syndrome. Pooled sensitivity was also lower in the first trimester of pregnancy, in studies in the general obstetric population, and in cohort studies with consecutive enrolment.
Conclusions:NIPT using cell-free fetal DNA has very high sensitivity and specificity for Down syndrome, with slightly lower sensitivity for Edwards and Patau syndrome. However, it is not 100% accurate and should not be used as a final diagnosis for positive cases.
Trial registration number:CRD42014014947.
INTRODUCTION
Non-invasive prenatal testing (NIPT) using cell-free fetal DNA (cffDNA) is a method for testing for trisomies in the fetus, using a per-ipheral sample of the pregnant mother’s blood. It is currently marketed across 61 countries in Europe, Asia, Africa and North and South America.1 Rapid adoption in the USA has seen increases in first trimester screening using NIPT, and concurrent decreases in thefirst trimester combined test and invasive testing.2 3 People tend to over-estimate the usefulness of genetic tests, and misinterpret their meaning.3 It is possible that pregnant women will interpret a positive NIPT test as positive diagnosis, and wish to abort a pregnancy on this basis. A clear summary of test accuracy for NIPT is neces-sary for use by doctors and patients for use in shared and informed decision-making.
Strengths and limitations of this study
▪ This is a full systematic review with searches across multiple databases dating back to 1997, and two authors sifting all titles and abstracts.
▪ Two authors extracted data on prepiloted forms and appraised quality using an adapted QUADAS 2 form.
▪ The meta-analysis included rigorous methods of data analysis, including bivariate random-effects regression models, but required a zero-cell cor-rection to enable model convergence which may underestimate rather than overestimate accuracy.
▪ The meta-analysis included a series of subgroup and sensitivity analyses to test for robustness of our pooled diagnostic accuracy estimates.
▪ The methods are transparent with full protocol published in PROSPERO in advance of the review.
Taylor-Phillips S,et al.BMJ Open2016;6:e010002. doi:10.1136/bmjopen-2015-010002 1
Open Access Research
group.bmj.com on February 11, 2016 - Published by
Although a previous review of NIPT test accuracy exists,4 it does not include two of the largest studies.5 6 In addition the authors use a univariate approach which is not appropriate for meta-analysis of tests since it over-looks the fact that sensitivity and specificity are usually negatively correlated across studies due to different thresholds used to define positive and negative test results. It has been shown that ignoring this correlation would be inappropriate.7 The weighted sums of the reported specificity are normally used to assess the value of a test, the properties of the resulting statistics depends most importantly on this correlation between the estimates, and it is exactly that is ignored in separate univariate analyses.8 9 Most importantly, the previous review does not provide a summary of findings which can be applied to a relevant population and used in clin-ician–patient shared decision-making.
The UK National Screening Committee commissioned this new review to provide a summary of the accuracy of NIPT for detection of Down, Edwards and Patau syn-dromes in first trimester pregnancies, to inform their decision on introduction of this test into current fetal abnormality screening in the UK.
METHODS
Identification and selection of studies
Ethical approval was granted from the University of Warwick Biomedical and Scientific Research Ethics Committee reference REGO-2015-1446. Searches were conducted in PubMed, Ovid Medline, Ovid Embase and the Cochrane Library. The search strategy used a com-bination of search terms for the NIPT test and trisomies, and was limited to the English language, (see online supplementary file 1). Date limits were 01.01.1997– 09.02.2015. Updating autoalerts in Medline and Embase were run until 01.04.2015. Individuals and organisations were contacted for studies not freely available in the public domain. ClinicalTrials.gov, WHO International Clinical Trials Registry Platform (ICTRP) Search Portal and meeting abstracts were also searched for ongoing or recently completed trials.
Two reviewers independently screened titles and abstracts of all records obtained. Discrepancies were resolved by consensus or discussion with a third reviewer. Inclusion criteria were English language journal articles which investigated NIPT using cff DNA derived from maternal blood (serum, plasma, whole blood) in preg-nant women in any trimester for the detection of Down (T21), Edwards (T18) or Patau (T13) syndromes in the fetus. The reference standard was genetic verification through amniocentesis, Chorionic Villus Sampling (CVS), cordocentesis, fetal pathological examination after abortion or postnatal phenotypic assessment. We included studies with any outcomes reported on test accuracy, or rates of test failure or indeterminate results. We excluded studies reporting the quantification of fetal cells or DNA or using elevated levels of the whole fetal
DNA or epigenetic markers. We also excluded case– control studies with fewer than 15 cases and cohort studies with fewer than 50 pregnant women as well as studies with incomplete 2×2 data or studies which reused samples from other included studies in order to prevent double counting.
Data were extracted by one reviewer and checked by a second reviewer. Disagreements were resolved by consen-sus or discussion with a third reviewer. Full data extrac-tion forms are available from the authors on request.
Quality assessment
The quality of diagnostic accuracy studies was assessed using a modified QUADAS-2.10 Quality assessment was undertaken by one reviewer and checked by a second reviewer, with disagreements resolved by a third reviewer. Three modifications were made. First, an additional sig-nalling question was added on whether the study avoided taking the sample for the index test in the 7 days after an invasive test, as fetal fraction may be ele-vated at this time boosting the performance of NIPT. Second, a signalling question was added to determine whether the threshold value was determined using an independent set of samples, and whether adjustment of the predefined threshold was avoided, since the thresh-old for testing positive is expressed as number of SDs from the mean score for a set of normal samples, rather than as an absolute threshold. Finally, the standard QUADAS-2 signalling question determining whether there was an appropriate interval between index test and reference standard was removed, as timing of an invasive test (apart from in relation to invasive testing) would not affect accuracy. Timing of the NIPT test is important as fetal fraction and therefore accuracy of NIPT increases throughout pregnancy, this was included under applicability offindings rather than as a source of bias. We also assessed the role of the sponsor in addition to QUADAS-2. This included studies that clearly declared involvement of a sponsor in the design or conduct of the study or publication, the majority of authors were employees or shareholders of companies offering NIPT or cytogenetic tests and/or other conflicts of interest (ie, patents, stock or stock options). Please see online supplementary file 2 for full information on the definition for the signalling questions of the QUADAS-2.
Statistical analysis of test accuracy studies
correlation into the analysis.7We added a 0.5 cell correc-tion to each cell where a zero was encountered. We stratified test accuracy measures according to condition (T21, T18 and T13).
Meta-analysis, subgroup and sensitivity analyses
We used sensitivity, subgroup and meta-regression ana-lyses to explore potential sources of heterogeneity in test accuracy estimates across studies. The following variables were selected a priori as potential sources of heterogen-eity: study design (cohort with consecutive sampling vs others), population risk (general, high-risk, others), population (twins vs others), first trimester (100% vs other), test type (MPSS, DANSR, single nucleotide poly-morphism (SNP) technology) and publication year (2007–2013 vs 2014–2015). We conducted a series of sensitivity analyses to check the robustness of the results. We excluded all studies with zero cases of true positive and false negative results. We used Cook’s distance to identify particularly influential studies and created a scatter plot of the standardised predicted random effects (standardised level 2 residuals) to check for outliers.12 We refitted the model leaving out outliers and very infl u-ential studies.
We constructed 3×2 tables to examine the influence of the number of test failures and indeterminate results on the pooled test accuracy estimates.13 Test failures occur where the NIPT test has failed to produce any result, and indeterminate results where the test result is in a mid-range which is neither positive nor negative. Test failures can occur for a variety of reasons, and some-times the cause is unknown. Test failures and indeter-minate results are not included in the 2×2 tables reported, and this can lead to overestimates of sensitivity and specificity.14 We included all failures of the NIPT test, regardless of whether repeating the test on the same or a new blood sample would have given a result, but we did not include failures which could be rectified by good quality assurance procedures (such as insuffi -cient blood or dropped samples). For the 3×2 tables we considered the following three scenarios, all non-evaluable results: (1) considered to be positive results to reflect use of the NIPT as triage for invasive testing,14 (2) considered to be negative results to reflect use of NIPT as an add-on to the combined test14and (3) follow intention to diagnose principle to account for the first two approaches overestimating specificity and sensi-tivity, respectively.13 Intention to diagnose was defined as
“including non-evaluable results either in the ‘false negative’ or the‘false positive’cell of a 2×2 table (worst case scenario) according to the results of the reference standard”. For the intention to diagnose principle, all non-evaluable positive results were assumed to be false negative and all non-evaluable negative results were assumed to be false positive. Where the reference stand-ard results were not reported for these cases, we assumed that they had the same prevalence of trisomy as those in the rest of the same study.
In the subgroup analyses, we computed pooled accur-acy estimates in various strata to determine if accuraccur-acy is higher or lower in specific subgroups. Summary sensitiv-ity and specificity estimates for each subgroup were gen-erated, along with their 95% CIs. In the linear meta-regression model, studies are the units of analysis. We used the meta-regression model to generate relative diagnostic ORs.15 16 We used Deeks’ funnel plot asym-metry test to test for publication bias, with p value<0.10 indicating significant publication bias.17 All analyses were performed using Stata V.13 for Windows including the user written commands metandi, midas, metareg and mvmeta.12 18–20
RESULTS Study selection
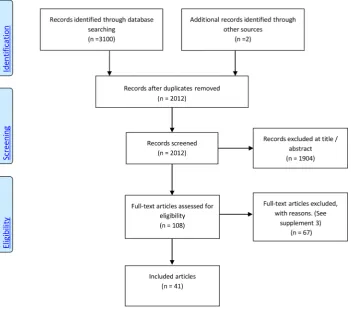
A total of 2012 records were identified after duplicates were removed. One-hundred and eight records remained after evaluation of title and abstract, of which 41 studies were included in the meta-analysis. Figure 1 summarises the study selection process (see online sup-plementaryfile 3 for included studies and online supple-mentary file 4 for reasons of exclusion for 67 full-text articles).
Characteristics of included studies
Study design, populations, reference standards
Forty-one publications, dating from 2007 to 2015, reported NIPT results for between 46 and 112 669 preg-nant women for the main autosomal trisomies in relation to fetal karyotype or newborn phenotype and fulfilled our inclusion criteria (see online supplementary file 5). The majority of studies were cohort studies (n=29),5 6
21–47 with prospective data collection. There were 11
case–control studies48–58 and one of unclear design.59 Thirty studies were undertaken in singleton pregnancies only,6 21 22 29–33 35–37 40–51 53–59 four studies included singleton and twin pregnancies,5 28 34 38with the remain-der unremain-dertaken in twin only (n=3).23 24 39In four studies the reporting was unclear.25 26 28 52 The majority of studies (n=24) used samples from high-risk pregnant women ( positive standard screening, ultrasound abnor-malities, advanced maternal age, personal or family history of aneuploidies) undergoing invasive testing.24 26 28 30 31 33 36–38 41 44 45 47–56 58 59 Six studies were performed in the general obstetric popula-tion.6 21 29 35 40 43Nine studies included pregnant women with mixed risk factors.5 22 27 32 34 39 42 46 57In two the underlying risk was unclear.23 25 Seven studies included women in the first trimester only,6 23 29 30 43 47 48while all other studies (n=34) included pregnant women with an unstated, later or broader gestational age window.5 21 22 24–28 31–42 44–46 49–59
Testing strategies
Three main testing strategies were pursued by the major-ity of studies (see online supplementary file 6). These
Taylor-Phillips S,et al.BMJ Open2016;6:e010002. doi:10.1136/bmjopen-2015-010002 3 Open Access group.bmj.com
on February 11, 2016 - Published by http://bmjopen.bmj.com/
were genome-wide massively parallel shotgun sequencing (MPSS, n=24 studies),5 21 22 24–28 33–36 41 44–47 49–52
54 55 58targeted massively parallel sequencing (DANSR,
n=9 studies),6 23 29 31 37 39 43 48 56and SNP technology (n=5).30 32 42 53 57 Two studies, performed in real clin-ical settings, offered more than one NIPT approach.38 40 Dhallanet al59used a DNA-SNP allelic ratio approach.
In 3 of the 41 studies,21 32 57 some of the maternal blood samples for NIPT were obtained after invasive testing and for 34 studies we concluded that tests were collected before the invasive testing.5 6 22–24 26–31 33–52
54 55 58In four studies, it was unclear if maternal blood
sampling for NIPT was performed before or after an invasive procedure.25 53 56 59
Forty studies reported NIPT performance for T21,5 6 21–49 51–59 36 for T18,5 6 21–36 38–50 53–57 and 30 studies investigated non-invasive detection of T13.5 6 21 23 25–28 30 32–36 38–47 49 50 53–55 57 Twenty-nine studies reported test accuracy for all three main auto-somal trisomies.5 6 21 23 25–28 30 32–36 38–47 49 53–55 57
Methodological quality of included studies
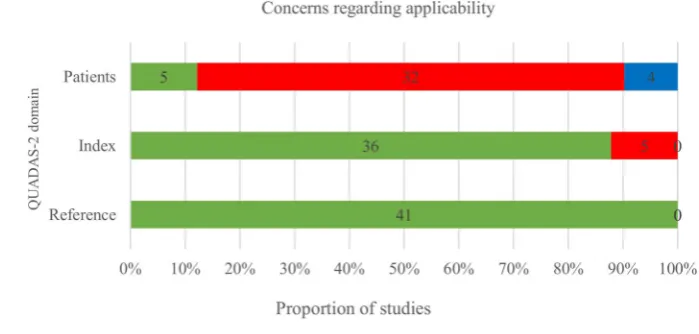
The methodological quality of the 41 included studies, assessed by QUADAS-210is summarised infigures 2and3 and online supplementary file 7. Risk of bias was high in most studies with 25 of 41 studies considered high risk in two or more domains, and 14 studies in one domain. Two were judged as low or unclear risk of bias in allfive domains.Figure 2shows that studyflow (con-cerned with patient follow-up) and the role of the
sponsor were the areas with the greatest risk of bias. Another issue was incomplete or unclear reporting, particularly of the patient selection process and the conduct of the index test, which is reflected in 21 (51.2%) and 14 (34.1%) of 41 publications scoring an unclear risk of bias in these two domains, respectively. The risk of bias regarding the reference standard was considered low in almost all studies with only one study classified as unclear.23Finally, risk of bias regard-ing the role of sponsor was deemed high in 23 studies. There were significant concerns regarding applicability of the included patient spectrum to cffDNA testing introduction in the first trimester (see figure 3), as 29 of 41 studies had significant parts (>20%) of their populations tested in the second or third trimester when fetal fraction and therefore accuracy of NIPT is higher.
Meta-analysis
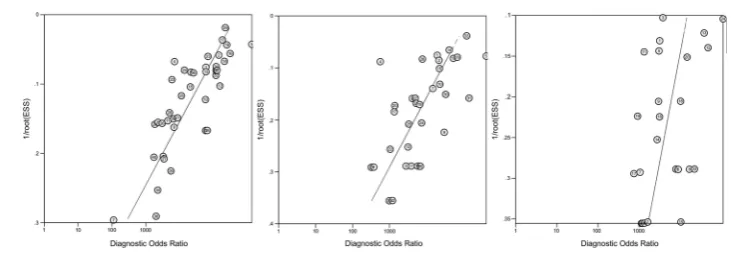
There was a high likelihood of publication bias, with the slope coefficients on Deeks’ funnel plot asymmetry test significant for Down syndrome ( p=0.0001), Edwards syn-drome ( p=0.0001), and Patau synsyn-drome ( p=0.045) (see
figure 4).
[image:5.595.204.556.49.359.2]The pooled sensitivity for Down syndrome from bivari-ate random-effects regression of 40 studies was 99.3% (98.9% to 99.6%) and the pooled specificity was 99.9% (99.9% to 100%). For Edwards syndrome the pooled sensitivity over 33 studies was 97.4% (95.8% to 98.4%) and specificity was 99.9% (99.9% to 100%). For Patau Figure 1 Preferred Reporting
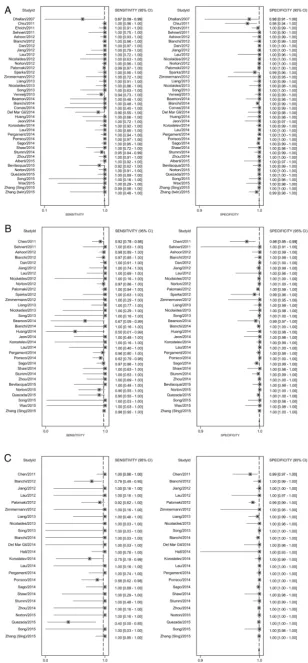
syndrome the pooled sensitivity over 24 studies was 97.4% (86.1% to 99.6%) and specificity was >99.9% (99.9% to 100%).Table 1shows these pooled sensitivities and specificities applied to populations of pregnant women taking the test. In the subgroup analysis (table 2) sensitivity estimates were lower by 6.1% for Down, 10.6% for Edwards, and 12.3% for Patau syndromes for cohort studies with consecutive sampling in comparison to all other studies which are more likely to be subject to spec-trum bias. Test accuracy did not appear to systematically differ between DANSR, MPSS or SNP-based test types or by publication year. Estimates of test sensitivity were higher in high-risk populations, in studies including pregnancies in the second and third trimester, and in singleton pregnancies. In high-risk populations, defined in a variety of ways, pooled sensitivity estimates were 1.4%, 6.5% and 17.8% higher than in the general obstet-ric population for Down, Edwards and Patau syndromes, respectively. Sensitivity estimates were 1.3%, 1.4% and 11.6% lower in studies recruiting all women in theirfirst trimester of pregnancy in comparison to studies includ-ing women later in pregnancy. The outcomes of test accuracy of the included studies are summarised in online supplementary file 8. A forest plot of the
sensitivity and specificity from the individual studies with 95% CIs is given infigure 5.
Test failures
[image:6.595.194.553.57.215.2]The rate of analytic failure (failure of the cffDNA testing) ranged from 0% to 12.7%57 and among 5789 pregnancies with resampling, 803 (13.9%) also failed the repeat cffDNA testing. There werefive papers in this review that reported indeterminate results (results in a range defined as neither positive nor negative) for triso-mies 21, 18 and 13.21 38 49 55 60 ranging from 0% (0/ 2042) to 11.1% (5/45). In the study with no indetermin-ate results they used eight-plex testing, and where the initial score was indeterminate they repeated using one-plex which corrected any indeterminate results. There is some evidence that the rate of test failure is higher when gestational age is lower, and in trisomic pregnancies. Pergament et al32 found that failure rate at <9 weeks was 26/95 (27.4%), between 9.0 and 9.9 weeks was 6/50 (12.0%), and more than 10 weeks was 53/900 (5.9%). The same study found aneuploidy incidence was increased (20/86 (23.3%)) in samples that did not return a result when compared with the aneuploidy inci-dence in samples with a cffDNA testing result (105/966 Figure 2 Proportion of studies
with low, high or unclear risk of bias using QUADAS 2.
Figure 3 Proportion of studies with low, high and unclear concerns regarding applicability using QUADAS 2.
Taylor-Phillips S,et al.BMJ Open2016;6:e010002. doi:10.1136/bmjopen-2015-010002 5 Open Access group.bmj.com
on February 11, 2016 - Published by http://bmjopen.bmj.com/
[image:6.595.204.554.563.730.2](10.9%), p=0.004). Norton et al6did not find an associ-ation between test failure and gestassoci-ational age in 18 510 women between 10 and 14 weeks gestation, but found that the prevalence of aneuploidy in the group with test failure (1 in 38 (2.7%)) was higher than the prevalence of 1 in 236 (0.4%) in the overall cohort ( p<0.001).
Including test failures in an intention to diagnose ana-lysis in the meta-anaana-lysis decreased sensitivity estimates by 1.7% for Down, 1.6% for Edwards and 7.1% for Patau syndrome, and decreased specificity estimates by nearly 2% for all three trisomies. Excluding test failures from the calculations of test accuracy may have caused over-estimation of accuracy. Similarly in the subgroup analysis sensitivity estimates were lower by 6.1% for Down, 10.6% for Edwards, and 12.3% for Patau syndromes for cohort studies with consecutive sampling in comparison to all other studies. Test accuracy did not appear to differ sys-tematically between DANSR, MPSS or SNP technology, or by publication year. Estimates of test sensitivity were higher in high-risk populations, in studies including pregnancies in the second and third trimester, and in singleton pregnancies. In high-risk populations, defined in a variety of ways, pooled sensitivity estimates were 1.4%, 6.5% and 17.8% higher than in the general obstetric population for Down, Edwards and Patau syn-dromes, respectively. Sensitivity estimates were 1.3%, 1.4% and 11.6% lower in studies recruiting all women in their first trimester of pregnancy in comparison to studies including women later in pregnancy. Twin preg-nancies had 8.3% lower sensitivity estimates than single-tons for Down syndrome. This difference was 20.6% for Edwards syndrome, but there was only one study for Patau syndrome so we were unable to provide a pooled estimate for twins. Sensitivity and subgroup analyses are reported intable 2.
DISCUSSION
In a systematic review of 2012 articles, we identified 41 articles on the test accuracy of NIPT. Quality appraisal using QUADAS-2 indicated high risk of bias, in particu-lar due to unclear or unsystematic inclusions and exclu-sions of participants at study entry level as well as at the level of analysis. Applicability offindings was of concern as there is still very limited data on the screening popula-tion available. Pooled sensitivity from the meta-analysis
was 99.3% for T21, 97.4% for T18 and 97.4% for T13, with pooled specificity 99.9% (99.9% to 100%) for all three trisomies. We estimated test accuracy in a high-risk population of 10 000 pregnancies where 3.3% of fetuses have Down syndrome, 1.5% have Edwards syndrome and 0.5% have Patau syndrome. There would be 324 cases of Down syndrome detected, with 9 missed and 31 false positive results, 140 cases of Edwards syndrome detected with 11 missed and 26 false positive results, and 47 cases of Edwards syndrome detected, with 3 missed and 7 false positive results (table 1). In the general obstetric population where prevalence of trisomy is lower, there would be a lower positive predictive value. In 100 000 pregnancies in the general obstetric population we would expect 417, 89 and 40 cases of Downs, Edwards and Patau syndromes to be detected by NIPT, with 94, 154 and 42 false positive results. Therefore it is vital to follow a positive NIPT test with an invasive diagnostic test (amniocentesis or CVS) to confirm the presence of trisomy, if the woman is considering termination of preg-nancy on the basis of trisomy.
The strengths of this systematic review included a com-prehensive search of the literature, with quality appraisal of all included studies, with two authors sifting studies for inclusion, extracting data and appraising quality. The meta-analysis included rigorous methods of data analysis, including bivariate random-effects regression models and HSROC curve analysis. We also conducted a series of subgroup analyses and sensitivity analyses to test for robustness of our pooled diagnostic accuracy estimates. Homogeneous subgroup and sensitivity analysis summary accuracy estimates were generally similar to the overall estimates. We added predefined covariates to the model using meta-regression analyses to explain hetero-geneity but considerable statistical heterogeneity remained. For some of the subgroup analyses, the rela-tively small number of studies available limited the gen-eralisability of such pooled accuracy estimates. Finally we applied zero cell continuity correction of 0.5 to each cell of a study where a zero is encountered which tends to underestimate rather than overestimate test accuracy.
[image:7.595.189.555.43.170.2]The findings of our review are in line with the results from previous reviews stating that NIPT has high per-formance in terms of sensitivity and specificity,61 62 that specificity is slightly higher than sensitivity,61that the test performance is greater for T21 than for T18 and T13,4 Figure 4 Deeks’funnel plot for
Table 1 Summary of findings applied to high risk and general obstetric population
Condition
Summary accuracy
Median
prevalence Outcomes
Positive predictive value
Probability of
false negative Implications
General obstetric population (100 000 pregnancies) Down syndrome Sensitivity=95.9%
Specificity=99.9% (6 studies)
0.43% TP=417
FP=94 TN=99471 FN=18
82% 1 in 5570 With prevalence of 0.4%, 435 of 100 000 pregnancies will be affected by Down syndrome. Of these 417 will be detected and 18 missed by cffDNA. Of the 99 565 who do not have Down syndrome, 94 will receive a false positive result. Therefore 82% of pregnancies which test positive will have Down syndrome
Edwards syndrome
Sensitivity=86.5% Specificity=99.8% (5 studies)
0.10% TP=89
FP=154 TN=99744 FN=14
37% 1 in 7194 With prevalence of 0.1%, 102 of 100 000 pregnancies will be affected by Edwards syndrome. Of these 89 will be detected and 14 missed by cffDNA. Of the 99 898 who do not have Edwards syndrome, 154 will receive a false positive result. Therefore 37% of pregnancies which test positive will have Edwards syndrome
Patau syndrome Sensitivity=77.5% Specificity=>99.9% (5 studies)
0.05% TP=40
FP=42 TN=99906 FN=12
49% 1 in 8506 With prevalence of 0.05%, 52 of 100 000 pregnancies will be affected by Patau syndrome. Of these 40 will be detected and 12 missed by cffDNA. Of the 99 948 who do not have Patau syndrome, 42 will receive a false positive result. Therefore 49% of pregnancies which test positive will have Patau syndrome
High-risk population (10 000 pregnancies) Down syndrome Sensitivity=97%
Specificity=99.7% (22 studies)
3.33% TP=324
FP=31 TN=9636 FN=9
91% 1 in 1054 With prevalence of 3.3%, 333 of 10 000 pregnancies will be affected by Down syndrome. Of these 324 will be detected and 9 missed by cffDNA. Of the 9667 who do not have Down syndrome, 31 will receive a false positive result. Therefore 91% of those who test positive will have Down syndrome
Edwards syndrome
Sensitivity=93% Specificity=99.7% (19 studies)
1.50% TP=140
FP=26 TN=9824 FN=11
84% 1 in 930 With prevalence of 1.5%, 151 of 10 000 pregnancies will be affected by Edwards syndrome. Of these 140 will be detected and 11 missed by cffDNA. Of the 9850 who do not have Edwards syndrome, 26 will receive a false positive result. Therefore 84% of those who test positive will have Edwards syndrome
Patau syndrome Sensitivity=95% Specificity=99.9% (11 studies)
0.50% TP=47
FP=7 TN=9943 FN=3
87% 1 in 4265 With prevalence of 0.5%, 50 of 10 000 pregnancies will be affected by Patau syndrome. Of these 47 will be detected and 3 missed by cffDNA. Of the 9950 who do not have Patau syndrome, 7 will receive a false positive result. Therefore 87% of those who test positive will have Patau syndrome
Median prevalence determined from cohort studies included in meta-analysis for relevant populations. Estimates of sensitivity and specificity are from meta-analysis sub-groups for studies in high risk and general obstetric populations. The systematic review investigated test accuracy of non-invasive prenatal testing using cell-free DNA derived from maternal blood (serum, plasma, whole blood) in pregnant women in any trimester for the detection of Down, Edwards or Patau syndromes in the fetus. The reference standard was genetic verification through amniocentesis, CVS, cordocentesis, fetal pathological examination after abortion and postnatal phenotypic assessment. Findings should be interpreted with caution. Assessment using QUADAS-2 identified high risk of bias in included studies, particularly for selection of women and flow. Deeks’funnel plots indicated there was high risk of publication bias in included studies. Zero-cell corrections may have reduced accuracy estimates.
cffDNA, cell-free fetal DNA; CVS, Chorionic Villus Sampling; FN, false negative; FP, false positive; TN, true negative; TP, true positive.
T
aylor-Phill
ips
S,
et
al
.
BMJ
Open
2016;
6
:e010002
.
doi:10.113
6/bmjopen-2
015-010002
7
Open
Acces
s
group.bmj.com
on February 11, 2016 - Published by
http://bmjopen.bmj.com/
Table 2 Accuracy estimates from sensitivity and subgroup analyses of the included studies by different study characteristics†
Down (trisomy 21) Edwards (trisomy 18) Patau (trisomy 13)
Variables N SN (95% CI) SP (95% CI) n SN (95% CI) SP (95% CI) n SN (95% CI) SP (95% CI)
All studies 40 0.993 (0.989 to 0.996) 0.999 (0.999 to 1.000) 33 0.974 (0.958 to 0.984) 0.999 (0.999 to 1.000) 24 0.974 (0.861 to 0.996) 1.000 (0.999 to 1.000) Sensitivity analyses
Excluding outliers‡ 37 0.993 (0.989 to 0.996) 1.000 (0.999 to 1.000) 32 0.977 (0.961 to 0.986) 0.999 (0.999 to 1.000) 22 0.977 (0.818 to 0.998) 1.000 (0.999 to 1.000) Test failures
Assuming all+ve 40 0.997 (0.990 to 0.999) 0.981 (0.972 to 0.988) 33 0.973 (0.956 to 0.983) 0.983 (0.974 to 0.990) 24 0.979 (0.873 to 0.997) 0.981 (0.966 to 0.989) Assuming all−ve 40 0.962 (0.948 to 0.973) 1.000 (0.999 to 1.000) 33 0.942 (0.913 to 0.962) 0.999 (0.999 to 1.000) 24 0.885 (0.796 to 0.939) 1.000 (0.999 to 1.000) Intention to diagnosis 40 0.976 (0.959 to 0.986) 0.981 (0.972 to 0.989) 33 0.958 (0.927 to 0.976) 0.983 (0.973 to 0.990) 24 0.903 (0.811 to 0.953) 0.981 (0.966 to 0.989) Assuming all+ve 40 0.994 (0.989 to 0.997) 0.999 (0.999 to 1.000) 33 0.974 (0.958 to 0.985) 0.999 (0.999 to 1.000) 24 0.974 (0.863 to 0.996) 1.000 (0.999 to 1.000) Assuming all−ve 40 0.993 (0.987 to 0.996) 0.999 (0.999 to 1.000) 33 0.970 (0.945 to 0.984) 0.999 (0.999 to 1.000) 24 0.976 (0.855 to 0.996) 1.000 (0.999 to 1.000) Intention to diagnosis 40 0.993 (0.988 to 0.996) 0.999 (0.999 to 1.000) 33 0.972 (0.950 to 0.985) 0.999 (0.999 to 1.000) 24 0.976 (0.855 to 0.996) 1.000 (0.999 to 1.000) Subgroup analyses
Study design
Cohort 5 0.932 (0.853 to 0.971) 0.999 (0.996 to 1.000) 4 0.868 (0.591 to 0.968) 0.998 (0.994 to 0.999) 3 0.851 (0.498 to 0.971) 0.999 (0.995 to 1.000) Others 35 0.976 (0.963 to 0.985) 0.998 (0.997 to 0.999) 29 0.941 (0.914 to 0.960) 0.998 (0.997 to 0.999) 21 0.970 (0.852 to 0.994) 1.000 (0.999 to 1.000) Population risk
General 6 0.959 (0.874 to 0.987) 0.999 (0.998 to 1.000) 4 0.865 (0.627 to 0.961) 0.998 (0.997 to 0.999) 4 0.775 (0.135 to 0.987)§ 1.000 (0.999 to 1.000) High 22 0.973 (0.951 to 0.985) 0.997 (0.994 to 0.998) 19 0.930 (0.892 to 0.955) 0.997 (0.995 to 0.999) 11 0.953 (0.864 to 0.985) 0.999 (0.996 to 1.000) Others 12 0.974 (0.940 to 0.989) 0.999 (0.998 to 0.999) 10 0.958 (0.907 to 0.982) 0.999 (0.999 to 1.000) 9 0.988 (0.547 to 1.000) 1.000 (0.999 to 1.000) Population
Others 36 0.977 (0.965 to 0.985) 0.998 (0.997 to 0.999) 31 0.943 (0.917 to 0.960) 0.998 (0.997 to 0.999) 23 0.974 (0.861 to 0.996) 1.000 (0.999 to 1.000) Twins 4 0.894 (0.750 to 0.960) 0.996 (0.996 to 0.996) 2 0.737 (0.202 to 0.969)§ 0.998 (0.986 to 1.000) 1*
First trimester
100% 7 0.960 (0.887 to 0.987) 0.999 (0.998 to 1.000) 5 0.925 (0.814 to 0.972) 0.998 (0.997 to 0.999) 5 0.850 (0.770 to 0.906)§ 0.999 (0.998 to 0.999) Others 33 0.973 (0.958 to 0.983) 0.998 (0.997 to 0.999) 28 0.939 (0.910 to 0.960) 0.998 (0.997 to 0.999) 19 0.966 (0.872 to 0.992) 1.000 (0.999 to 1.000) Test types
DANSR 9 0.958 (0.898 to 0.983) 0.999 (0.997 to 1.000) 6 0.948 (0.879 to 0.979) 0.998 (0.996 to 0.999) 3 0.606 (0.216 to 0.895) 1.000 (0.998 to 1.000) MPSS 25 0.978 (0.963 to 0.987) 0.998 (0.997 to 0.999) 23 0.936 (0.899 to 0.960) 0.998 (0.997 to 0.999) 16 0.959 (0.989 to 0.991) 1.000 (0.999 to 1.000) SNP technology 4 0.984 (0.937 to 0.996) 0.998 (0.993 to 1.000) 4 0.918 (0.751 to 0.976) 0.998 (0.994 to 1.000) 5 0.870 (0.647 to 0.960) 0.998 (0.992 to 0.999) Publication year
2007–2013 18 0.977 (0.958 to 0.988) 0.998 (0.995 to 0.999) 15 0.954 (0.919 to 0.975) 0.998 (0.995 to 0.999) 9 0.933 (0.799 to 0.980) 0.999 (0.993 to 1.000) 2014–2015 22 0.966 (0.939 to 0.981) 0.999 (0.998 to 0.999) 18 0.915 (0.853 to 0.952) 0.996 (0.998 to 0.999) 15 0.984 (0.770 to 0.999) 1.000 (0.999 to 1.000)
*Bivariate model inestimable for only one study in the subgroup.23
†Excluded studies with inestimable sensitivity (T21—Hall 2014; T18—Comas 2014, Hall 2014, Zhang (twins) 2015; T13—Sehnert 2011, Beamon 2014, Comas 2014, Bevilacqua 2015, Wax 2015, Zhang (twins) 2015).
‡Excluded outliers (T21—Dhallan 2007, Chiu 2011, Sparks 2012; T18—Chen 2011; T13—Chen 2011, Palomaki 2012).
‡p Value for subgroup differences <0.05 (statistically significant). SN, sensitivity; SNP, single nucleotide polymorphism; SP, specificity.
T
aylor-Phillips
S,
et
al
.
BMJ
Open
2016;
6
:e010002.
doi:10.1136/
bmjopen-20
15-010002
Ac
cess
group.bmj.com
on February 11, 2016 - Published by
http://bmjopen.bmj.com/
Figure 5 Individual and pooled sensitivity and specificity for non-invasive prenatal testing (NIPT) for the detection of a. Down syndrome b. Edwards syndrome and c. Patau syndrome.
Taylor-Phillips S,et al.BMJ Open2016;6:e010002. doi:10.1136/bmjopen-2015-010002 9 Open Access group.bmj.com
on February 11, 2016 - Published by http://bmjopen.bmj.com/
and that NIPT is less successful in twin pregnancies than in singleton pregnancies.4 However, we found evidence of significant publication bias, converted results into a format interpretable by clinicians, and concluded that the test is not diagnostic. There are two key differences between our review and the previous publications. First, we included more studies, several of which have been published since the most recent review4 (including two of the largest studies with test accuracy for 128 510 women).5 6Second, the two previous reviews conducted separate pooling of the diagnostic test accuracy measures using a univariate approach using standard methods for proportion4 62which is not recommended for reviews of test accuracy. Berkey et al63 show that a bivariate meta-regression is more efficient than separate univari-ate meta-regressions for assessing study-level covariunivari-ates, due to the inclusion of correlation. We used Deeks’ funnel plots and found evidence of publication bias, whereas the previous review used an Egger’s bias applied to sensitivity and specificity separately and found no evi-dence of bias, although their method may not be appro-priate for studies of test accuracy.17 Studies with a larger effective sample size tended to report higher diagnostic ORs. This may be due to publication bias in large laboratory cohort or case–control studies with a lack of systematic or consecutive sampling, or the fact that studies in the general obstetric population tend to have lower test accuracy and fewer cases. It may be partly due to our methods in that the zero-cell correction may dis-advantage small studies, or simply that the test is per-formed to a higher standard in larger studies, perhaps due to more advanced protocols used in later large scale studies.
The implications for policymakers and clinicians are that NIPT using cffDNA has very high sensitivity and spe-cificity, and can contribute to screening programmes for Down, Edwards and Patau syndromes. It is clear that test accuracy is very good but not perfect. This is particularly true when considering populations in terms of risk and gestational age. Our subgroup analyses showed that test performance is better in high-risk populations as well as in studies including pregnancies in the second and third trimester. Consideration of NIPT as a screening test for the general obstetric population primarily tested in the first trimester of pregnancy has to take into account the lower sensitivity of NIPT in this population. There is also some indication that higher maternal weight, and con-ception by in vitro fertilisation (IVF) are potential pre-dictors of NIPT test failure39 suggesting that NIPT may not work equally well in all subpopulations. We consider that for this reason cffDNA should not be regarded as a diagnostic test and that confirmation of a positive NIPT result by amniocentesis or CVS is necessary to make a diagnosis of trisomy. This is essential if parents are consid-ering termination of pregnancy on the basis of trisomy, because in the general obstetric population as many as 20% of positive NIPT results for Down syndrome may be false positive. This proportion will be higher for Edwards
and Patau syndromes. Because the source of cffDNA is the placenta, confined placental mosaicism may explain a proportion of discordant NIPT results.64 Furthermore, early fetal demise of an affected fetus53 64and unknown chromosomal abnormality in the mother5 64can lead to false positive results. Finally, in some cases discordance between NIPT and fetal karyotype results might be due to lab error.64The role of low fetal fraction as contributor to false positive or false negative results is unclear: Zhang
et al5 reported no major influence, whereas Quezada et al43 found lower fetal fractions in discordant than in
those with concordant results.
Communicating to clinicians and patients that this genetic test is not perfect will be key for safe implemen-tation, and pretest and post-test information provision and counselling for positive and negative NIPT results should be given careful consideration. The NIPT test may be particularly attractive to parents who are not con-sidering termination of pregnancy, but who would like to know in advance if their pregnancy is affected by a trisomy, since NIPT gives broadly accurate results, without the slightly increased risk of miscarriage asso-ciated with invasive procedures such as amniocentesis and CVS. The final consideration for implementation is the range of test failure rates from <1% to >12%, with some evidence that presence of trisomy may be a pre-dictor of test failure. Quality assurance to minimise test failures would minimise delays due to repeated testing, which may be a priority for pregnant women. However, if the test failure is due to insufficient fetal fraction a retest is also likely to fail.
This test is used worldwide, mostly provided directly by private providers rather than national health systems. Further research into how the test is being interpreted and understood by clinicians and pregnant women will be key to understanding the balance of benefits and harms from the provision of the test. In particular, how this understanding leads to decisions about whether to continue the pregnancy, and whether this may be infl u-enced by how the test is presented to parents both by companies, and by clinicians. Finally if it is implemented into national screening programmes, keeping accurate records of outcomes and test failures would enable the test performance to be evaluated in practice. This may differ from the test accuracy in the included studies in this paper, due to the high risk of bias in included studies of cffDNA, and the unexplained heterogeneity illustrating the uncertainties in transferring results from research studies into everyday practice.
Acknowledgements The authors would like to thank Jill Colquitt and Emma Loveman from Effective Evidence LLP, Eastleigh, for sourcing parameters for the economic model, Paul Hewitson for his work on the search strategy and sifting, Frances Taggart for her work on test accuracy at different thresholds, and Pam Royle for her work updating the searches.
Funding This is independent research commissioned by the UK National Screening Committee. Sian Taylor-Phillips is supported by a clinical trials fellowship from the National Institute for Health Research (NIHR). Aileen Clarke is supported by the National Institute for Health Research Collaboration for Leadership in Applied Health Research and Care West Midlands at University Hospitals Birmingham NHS Foundation Trust. The views expressed in this publication are those of the authors and not necessarily those of the NHS, the National Institute for Health Research, the UK National Screening Committee, Public Health England or the Department of Health. Any errors are the responsibility of the authors.
Competing interests None declared.
Provenance and peer review Not commissioned; externally peer reviewed.
Data sharing statement No additional data are available.
Open Access This is an Open Access article distributed in accordance with the terms of the Creative Commons Attribution (CC BY 4.0) license, which permits others to distribute, remix, adapt and build upon this work, for commercial use, provided the original work is properly cited. See: http:// creativecommons.org/licenses/by/4.0/
REFERENCES
1. Chandrasekharan S, Minear MA, Hung A,et al. Noninvasive prenatal testing goes global.Sci Transl Med2014;6:231fs15. 2. Chetty S, Garabedian MJ, Norton ME. Uptake of noninvasive prenatal testing (NIPT) in women following positive aneuploidy screening.Prenat Diagn2013;33:542–6.
3. Leighton JW, Valverde K, Bernhardt BA. The general public’s understanding and perception of direct-to-consumer genetic test results.Public Health Genomics2012;15:11–21.
4. Gil MM, Quezada MS, Revello R,et al. Analysis of cell-free DNA in maternal blood in screening for fetal aneuploidies: updated meta-analysis.Ultrasound Obstet Gynecol2015;45: 249–66.
5. Zhang H, Gao Y, Jiang F,et al. Non-invasive prenatal testing for trisomies 21, 18 and 13: clinical experience from 146,958 pregnancies.Ultrasound Obstet Gynecol2015;45:530–8.
6. Norton ME, Jacobsson B, Swamy GK,et al. Cell-free DNA analysis for noninvasive examination of trisomy.N Engl J Med
2015;372:1589–97.
7. Reitsma JB, Glas AS, Rutjes AW,et al. Bivariate analysis of sensitivity and specificity produces informative summary measures in diagnostic reviews.J Clin Epidemiol2005;58:982–90.
8. Hand DJ. Evaluating diagnostic tests: the area under the ROC curve and the balance of errors.Stat Med2010;29:1502–10.
9. Jackson D, Riley R, White IR. Multivariate meta-analysis: potential and promise.Stat Med2011;30:2481–98.
10. Whiting PF, Rutjes AW, Westwood ME,et al. QUADAS-2: a revised tool for the quality assessment of diagnostic accuracy studies.Ann Intern Med2011;155:529–36.
11. Leeflang MM, Deeks JJ, Gatsonis C,et al. Systematic reviews of diagnostic test accuracy.Ann Intern Med2008;149:889–97. 12. Dwamena BA.MIDAS: Stata module for meta-analytical integration
of diagnostic test accuracy studies. Boston, MA: Boston College Department of Economics, 2008.
13. Schuetz GM, Schlattmann P, Dewey M. Use of 3×2 tables with an intention to diagnose approach to assess clinical performance of diagnostic tests: meta-analytical evaluation of coronary CT angiography studies.BMJ2012;345:e6717.
14. Shinkins B, Thompson M, Mallett S,et al. Diagnostic accuracy studies: how to report and analyse inconclusive test results.BMJ 2013;346:f2778.
15. Glas AS, Lijmer JG, Prins MH,et al. The diagnostic odds ratio: a single indicator of test performance.J Clin Epidemiol 2003;56:1129–35.
16. Lijmer JG, Bossuyt PM, Heisterkamp SH. Exploring sources of heterogeneity in systematic reviews of diagnostic tests.Stat Med 2002;21:1525–37.
17. Deeks JJ, Macaskill P, Irwig L. The performance of tests of publication bias and other sample size effects in systematic reviews of diagnostic test accuracy was assessed.J Clin Epidemiol 2005;58:882–93.
18. Harbord RM, Higgins JPT. Meta-regression in Stata.Stata J
2008;8:493–519.
19. Harbord RM, Whiting P. metandi: Meta-analysis of diagnostic accuracy using hierarchical logistic regression.Stata J
2009;9:211–29.
20. White IR. Multivariate random-effects meta-regression: updates to mvmeta.Stata J2011;11:255–70.
21. Bianchi DW, Parker RL, Wentworth J,et al. DNA sequencing versus standard prenatal aneuploidy screening.N Engl J Med
2014;370:799–808.
22. Dan S, Ren J, Hu H,et al. Clinical application of massively parallel sequencing-based prenatal noninvasive fetal trisomy test for trisomies 21 and 18 in 11105 pregnancies with mixed risk factors. Prenat Diagn2012;32:1225–32.
23. del Mar Gil M, Quezada MS, Bregant B,et al. Cell-free DNA analysis for trisomy risk assessment in first-trimester twin pregnancies.Fetal Diagn Ther2014;35:204–11.
24. Huang X, Zheng J, Chen M,et al. Noninvasive prenatal testing of trisomies 21 and 18 by massively parallel sequencing of maternal plasma DNA in twin pregnancies.Prenat Diagn2014;34:335–40. 25. Jiang F, Ren J, Chen F,et al. Noninvasive Fetal Trisomy (NIFTY)
test: an advanced noninvasive prenatal diagnosis methodology for fetal autosomal and sex chromosomal aneuploidies.BMC Medical Genomics2012;5:57.
26. Lau TK, Chen F, Pan X,et al. Noninvasive prenatal diagnosis of common fetal chromosomal aneuploidies by maternal plasma DNA sequencing.J Matern Fetal Neonatal Med2012;25:1370–4. 27. Lau TK, Cheung SW, Lo PS,et al. Non-invasive prenatal testing for
fetal chromosomal abnormalities by low-coverage whole-genome sequencing of maternal plasma DNA: review of 1982 consecutive cases in a single center.Ultrasound Obstet Gynecol
2014;43:254–64.
28. Liang D, Lv W, Wang H,et al. Non-invasive prenatal testing of fetal whole chromosome aneuploidy by massively parallel sequencing. Prenat Diagn2013;33:409–15.
29. Nicolaides KH, Syngelaki A, Ashoor G,et al. Noninvasive prenatal testing for fetal trisomies in a routinely screened first-trimester population.Am J Obstet Gynecol2012;207:374.e1–6. 30. Nicolaides KH, Syngelaki A, Gil M,et al. Validation of targeted
sequencing of single-nucleotide polymorphisms for non-invasive prenatal detection of aneuploidy of chromosomes 13, 18, 21, X, and Y.Prenat Diagn2013;33:575–9.
31. Norton ME, Brar H, Weiss J,et al. Non-Invasive Chromosomal Evaluation (NICE) Study: results of a multicenter prospective cohort study for detection of fetal trisomy 21 and trisomy 18.Am J Obstet Gynecol2012;207:137.e1–8.
32. Pergament E, Cuckle H, Zimmermann B,et al. Single-nucleotide polymorphism-based noninvasive prenatal screening in a high-risk and low-risk cohort.Obstet Gynecol2014;124(2 Pt 1):210–18. 33. Porreco RP, Garite TJ, Maurel K,et al. Noninvasive prenatal
screening for fetal trisomies 21, 18, 13 and the common sex chromosome aneuploidies from maternal blood using massively parallel genomic sequencing of DNA.Am J Obstet Gynecol 2014;211:365.e1–12.
34. Shaw SW, Hsiao CH, Chen CY,et al. Noninvasive prenatal testing for whole fetal chromosomal aneuploidies: a multicenter prospective cohort trial in Taiwan.Fetal Diagn Ther2014;35:13–17.
35. Song Y, Liu C, Qi H,et al. Noninvasive prenatal testing of fetal aneuploidies by massively parallel sequencing in a prospective Chinese population.Prenat Diagn2013;33:700–6.
36. Stumm M, Entezami M, Haug K,et al. Diagnostic accuracy of random massively parallel sequencing for non-invasive prenatal detection of common autosomal aneuploidies: a collaborative study in Europe.Prenat Diagn2014;34:185–91.
37. Verweij EJ, Jacobsson B, van Scheltema PA,et al. European non-invasive trisomy evaluation (EU-NITE) study: a multicenter prospective cohort study for non-invasive fetal trisomy 21 testing. Prenat Diagn2013;33:996–1001.
38. Beamon CJ, Hardisty EE, Harris SC,et al. A single center’s experience with noninvasive prenatal testing.Genet Med 2014;16:681–7.
39. Bevilacqua E, Gil MM, Nicolaides KH,et al. Performance of screening for aneuploidies by cell-free DNA analysis of maternal blood in twin pregnancies.Ultrasound Obstet Gynecol2015;45:61–6. 40. Comas C, Echevarria M, Rodriguez MA,et al. Initial experience with
non-invasive prenatal testing of cell-free DNA for major chromosomal anomalies in a clinical setting.J Matern Fetal Neonatal Med2015;28:1196–201.
41. Jeon YJ, Zhou Y, Li Y,et al. The feasibility study of non-invasive fetal trisomy 18 and 21 detection with semiconductor sequencing platform.PLoS ONE2014;9:e110240.
42. Korostelev S, Totchiev G, Kanivets I,et al. Association of non-invasive prenatal testing and chromosomal microarray analysis
Taylor-Phillips S,et al.BMJ Open2016;6:e010002. doi:10.1136/bmjopen-2015-010002 11 Open Access group.bmj.com
on February 11, 2016 - Published by http://bmjopen.bmj.com/
for prenatal diagnostics.Gynecol Endocrinol2014;30(Suppl 1): 13–16.
43. Quezada MS, Gil MM, Francisco C,et al. Screening for trisomies 21, 18 and 13 by cell-free DNA analysis of maternal blood at 10–11 weeks’gestation and the combined test at 11–13 weeks.Ultrasound Obstet Gynecol2015;45:36–41.
44. Sago H, Sekizawa A. Nationwide demonstration project of next-generation sequencing of cell-free DNA in maternal plasma in Japan: one-year experience.Prenat Diagn2015;35:331–6. 45. Wax JR, Cartin A, Chard R,et al. Noninvasive prenatal testing:
impact on genetic counseling, invasive prenatal diagnosis, and trisomy 21 detection.J Clin Ultrasound2015;43:1–6.
46. Zhou Q, Pan L, Chen S,et al. Clinical application of noninvasive prenatal testing for the detection of trisomies 21, 18, and 13: a hospital experience.Prenat Diagn2014;34:1061–5.
47. Song Y, Huang S, Zhou X,et al. Non-invasive prenatal testing for fetal aneuploidies in the first trimester of pregnancy.Ultrasound Obstet Gynecol2015;45:55–60.
48. Ashoor G, Syngelaki A, Wagner M,et al. Chromosome-selective sequencing of maternal plasma cell-free DNA for first-trimester detection of trisomy 21 and trisomy 18.Am J Obstet Gynecol 2012;206:322.e1–5.
49. Bianchi DW, Platt LD, Goldberg JD,et al. Genome-wide fetal aneuploidy detection by maternal plasma DNA sequencing.Obstet Gynecol2012;119:890–901.
50. Chen EZ, Chiu RW, Sun H,et al. Noninvasive prenatal diagnosis of fetal trisomy 18 and trisomy 13 by maternal plasma DNA
sequencing.PLoS ONE2011;6:e21791.
51. Chiu RW, Akolekar R, Zheng YW,et al. Non-invasive prenatal assessment of trisomy 21 by multiplexed maternal plasma DNA sequencing: large scale validity study.BMJ2011;342:c7401. 52. Ehrich M, Deciu C, Zwiefelhofer T,et al. Noninvasive detection of
fetal trisomy 21 by sequencing of DNA in maternal blood: a study in a clinical setting.Am J Obstet Gynecol2011;204:205.e1–11. 53. Hall MP, Hill M, Zimmermann B,et al. Non-invasive prenatal
detection of trisomy 13 using a single nucleotide polymorphism- and informatics-based approach.PLoS ONE2014;9:e96677.
54. Palomaki GE, Deciu C, Kloza EM,et al. DNA sequencing of maternal plasma reliably identifies trisomy 18 and trisomy 13 as well as Down syndrome: an international collaborative study.Genet Med 2012;14:296–305.
55. Sehnert AJ, Rhees B, Comstock D,et al. Optimal detection of fetal chromosomal abnormalities by massively parallel DNA sequencing of cell-free fetal DNA from maternal blood.Clin Chem2011;57:1042–9. 56. Sparks AB, Struble CA, Wang ET,et al. Noninvasive prenatal
detection and selective analysis of cell-free DNA obtained from maternal blood: evaluation for trisomy 21 and trisomy 18.Am J Obstet Gynecol2012;206:319.e1–9.
57. Zimmermann B, Hill M, Gemelos G,et al. Noninvasive prenatal aneuploidy testing of chromosomes 13, 18, 21, X, and Y, using targeted sequencing of polymorphic loci.Prenat Diagn 2012;32:1233–41.
58. Alberti A, Salomon LJ, Le Lorc’h M,et al. Non-invasive prenatal testing for trisomy 21 based on analysis of cell-free fetal DNA circulating in the maternal plasma.Prenat Diagn2015;35:471–6. 59. Dhallan R, Guo X, Emche S,et al. A non-invasive test for prenatal
diagnosis based on fetal DNA present in maternal blood: a preliminary study.Lancet2007;369:474–81.
60. Futch T, Spinosa J, Bhatt S,et al. Initial clinical laboratory experience in noninvasive prenatal testing for fetal aneuploidy from maternal plasma DNA samples.Prenat Diagn2013;33:569–74. 61. Mersy E, Smits LJ, van Winden LA,et al. Noninvasive detection of
fetal trisomy 21: systematic review and report of quality and outcomes of diagnostic accuracy studies performed between 1997 and 2012.Hum Reprod Update2013;19:318–29.
62. Verweij EJ, van den Oever JM, de Boer MA,et al. Diagnostic accuracy of noninvasive detection of fetal trisomy 21 in maternal blood: a systematic review.Fetal Diagn Ther2012;31:81–6. 63. Berkey CS, Hoaglin DC, Antczak-Bouckoms A,et al. Meta-analysis
of multiple outcomes by regression with random effects.Stat Med 1998;17:2537–50.
review and meta-analysis
Edwards and Patau syndromes: a systematic
using cell-free DNA for detection of Down,
Accuracy of non-invasive prenatal testing
Aileen Clarke
Olalekan A Uthman, Jason Madan, Angus Clarke, Siobhan Quenby and Sian Taylor-Phillips, Karoline Freeman, Julia Geppert, Adeola Agbebiyi,
doi: 10.1136/bmjopen-2015-010002
2016 6:BMJ Open
http://bmjopen.bmj.com/content/6/1/e010002
Updated information and services can be found at:
These include:
Material
Supplementary
002.DC1.html
http://bmjopen.bmj.com/content/suppl/2016/01/18/bmjopen-2015-010
Supplementary material can be found at:
References
#BIBL
http://bmjopen.bmj.com/content/6/1/e010002
This article cites 63 articles, 6 of which you can access for free at:
Open Access
http://creativecommons.org/licenses/by/4.0/
use, provided the original work is properly cited. See:
others to distribute, remix, adapt and build upon this work, for commercial the Creative Commons Attribution (CC BY 4.0) license, which permits This is an Open Access article distributed in accordance with the terms of
service
Email alerting
box at the top right corner of the online article.
Receive free email alerts when new articles cite this article. Sign up in the
Collections
Topic
Articles on similar topics can be found in the following collections(221) Obgyn
(423) Health policy
(81) Genetics and genomics
Notes
http://group.bmj.com/group/rights-licensing/permissions
To request permissions go to:
http://journals.bmj.com/cgi/reprintform
To order reprints go to:
http://group.bmj.com/subscribe/
To subscribe to BMJ go to:
group.bmj.com on February 11, 2016 - Published by