R E S E A R C H
Open Access
Complex modulation of androgen responsive
gene expression by methoxyacetic acid
Gargi Bagchi
†, Yijing Zhang
†, Kerri A Stanley and David J Waxman
*Abstract
Background:Optimal androgen signaling is critical for testicular development and spermatogenesis.
Methoxyacetic acid (MAA), the primary active metabolite of the industrial chemical ethylene glycol monomethyl ether, disrupts spermatogenesis and causes testicular atrophy. Transcriptionaltrans-activation studies have indicated that MAA can enhance androgen receptor activity, however, whether MAA actually impacts the expression of androgen-responsive genesin vivo, and which genes might be affected is not known.
Methods:A mouse TM3 Leydig cell line that stably expresses androgen receptor (TM3-AR) was prepared and analyzed by transcriptional profiling to identify target gene interactions between MAA and testosterone on a global scale.
Results:MAA is shown to have widespread effects on androgen-responsive genes, affecting processes ranging from apoptosis to ion transport, cell adhesion, phosphorylation and transcription, with MAA able to enhance, as well as antagonize, androgenic responses. Moreover, testosterone is shown to exert both positive and negative effects on MAA gene responses. Motif analysis indicated that binding sites for FOX, HOX, LEF/TCF, STAT5 and MEF2 family transcription factors are among the most highly enriched in genes regulated by testosterone and MAA. Notably, 65 FOXO targets were repressed by testosterone or showed repression enhanced by MAA with testosterone; these include 16 genes associated with developmental processes, six of which areHox genes. Conclusions:These findings highlight the complex interactions between testosterone and MAA, and provide insight into the effects of MAA exposure on androgen-dependent processes in a Leydig cell model.
Background
Androgen signaling is critical for development of the male sexual phenotype, maturation of secondary sex characteristics and maintenance of muscle mass and bone density [1]. Disruption of androgen signaling can lead to a spectrum of developmental problems in male sexual characteristics and reproductive behavior [2]. Androgen action is mediated by androgen binding to androgen receptor (AR), a ligand-activated transcription factor that binds genomic regulatory elements associated with androgen responsive genes [3]. AR binding sites are often far (>10 kb) from transcription start sites of androgen-regulated genes, and many AR binding sites contain non-canonical androgen response elements [4-6]. Many transcription factors interact with AR,
including GATA factors [7], STAT5 [8], NF1 and SP1 [9], which can increase AR transcriptional activity, as well as Forkhead proteins [10-12], P53 [13] and LEF/ TCF factors [14], which are reported to exert both repression and enhancement of AR transcriptional activ-ity. Some of these effects may involve local interactions, as binding sites for GATA and Forkhead, as well as OCT family factors are often enriched nearby AR bind-ing sites [4-6]. These findbind-ings suggest that physiological or pathophysiological conditions that affect the expres-sion or activity of AR-interacting transcription factors such as these may impact AR activity.
Many foreign chemicals can modulate AR activity; these include drugs and environmental chemicals that bind directly to AR and antagonize its transcriptional activity [15,16]. AR activity can also be modulated by foreign chemicals that exert effects on AR indirectly,via
intracellular signaling [17,18]. One example is methox-yacetic acid (MAA), a testicular toxicant and the
* Correspondence: [email protected]
†Contributed equally
Division of Cell and Molecular Biology, Department of Biology, Boston University, Boston, MA 02215, USA
primary, active metabolite of the industrial chemical ethylene glycol monomethyl ether [19,20]. MAA enhances the transcriptional activity of several nuclear receptors [21,22], including AR [19,22-24], by a mechan-ism that involves tyrosine kinase activity and requires PI3-kinase signaling [22]. The inappropriate enhance-ment of AR transcriptional activity by MAA could con-tribute to the testicular toxicity associated with MAA exposure, given the importance of AR in somatic cells of the testis for spermatocyte survival [25].
Earlier studies of the potentiation of AR transcrip-tional activity by MAA used AR reporter gene assays to demonstrate enhancement of androgen response [22]. However, while reporter gene assays are an important tool for studying gene regulation, transfected reporter gene constructs do not always reflect the regulation of
endogenous genes in untransfected cells in vivo.
More-over, in the case of MAA, artefactual effects on the CMV promoter used in one study to express estrogen receptor required for reporter gene activity were reported [26]. It is therefore important to determine the effects of MAA on the expression of endogenous andro-gen responsive andro-genes to determine whether MAA can, indeed, potentiate androgen responses, to identify the specific genes whose expression is affected, and to eluci-date the nature and extent of interactions between MAA and androgen, both positive and negative.
In this study, we develop an androgen-responsive mouse testicular Leydig cell line, TM3-AR, and use it to investigate the impact of MAA on androgen responsive gene expres-sion by global transcriptional profiling. Our findings reveal that MAA alters the expression of large numbers of testos-terone-responsive genes. We also find that the androgenic environment can influence the effects of MAA on gene expression, with many examples of both stimulatory and inhibitory interactions between MAA and testosterone. Motif analysis identified binding sites for transcription fac-tors whose putative targets are enriched in genes showing either positive or negative interactions between MAA and testosterone, providing further insight into the mechanisms that govern these gene interactions. Enriched micro-RNA binding sites in the 3’-untranslated region (3’-UTR) of tar-get genes were also identified. These findings demonstrate that the impact of MAA on androgen gene responses is complex and suggest target genes and pathways through which MAA may exert toxicity to somatic cells of the testis.
Methods
Chemicals and reagents
MAA, horse serum and testosterone were purchased from Sigma Chemical Co, St. Louis, MO. DMEM-F12 culture medium, fetal bovine serum (FBS), HEPES buffer and TRIzol reagent were purchased from Invitrogen Corp. (Carlsbad, CA).
Cell culture and TM3-AR cell preparation
Mouse TM3 Leydig cells and LNCaP cells were obtained from American Type Culture Collection, Manassas, VA. TM3 and TM3-AR cells (see below) were grown in DMEM-F12 medium containing 5% horse serum and 2.5% FBS. LNCaP cells were maintained in RPMI 1640 containing 10% FBS. RNA was isolated using TRIzol
reagent using the manufacturer’s protocol. Mouse TM3
cells stably expressing human AR cDNA were prepared by retroviral infection of TM3 cells, as follows. The cod-ing sequence of AR was excised from plasmid pSV-ARO (Dr. A.O. Brinkmann, University Medical Center Rotter-dam, The Netherlands) and subcloned by blunt end liga-tion into the retroviral plasmid vector pWZL-Blast (Dr. D. White, Millenium Pharmaceuticals, Cambridge MA) to yield pWZL-Blast-AR. pWZL-Blast is based on the pBabe plasmid [27] and encodes a blasticidin-resistance gene transcribed from the retroviral long terminal repeat. Retroviral particles were generated as described [28] by transfecting the packaging cell line HEK293 with pWZL-Blast-AR. Culture medium containing retroviral particles was collected 48 h later and applied to TM3 cells. Pools of blasticidin-resistant cells were selected for 4 days using blasticidinS-hydrochloride and then veri-fied as expressing AR by qPCR.
To obtain samples for microarray analysis, TM3-AR cells were treated for 24 hr with either testosterone (10 nM) or MAA (5 mM), or with testosterone in combination with MAA. The concentration of testosterone was chosen to saturate AR, and the concentration of MAA was chosen based on considerations described in our earlier studies [22,29], and based on its correspondence to the plasma concentration associated with ethylene glycol monomethyl ether-induced germ cell toxicity in mice [30]. The concen-tration of MAA used did not alter the cell growth rate or cause any loss of cell viability over the course of at least 48 hr. RNA was isolated and validated by RNA integrity num-ber >8.5, as determined using an Agilent Bioanalyzer 2100 instrument (Agilent Technologies, Santa Clara, CA).
qPCR
Microarray analysis
Each RNA sample used for microarray analysis was a pool prepared from three independent TM3-AR cell cul-tures (three different passages), each treated as described above. Two such pools of TM3-AR cell RNA (represent-ing a total of 5 independent treated cell cultures) were prepared and used in two independent sets of microar-rays, each of which represented 3 of the 5 independent cultures. Each set of microarrays was comprised of four separate competitive hybridization arrays (i.e., four microarray experiments): testosterone vs. control, MAA vs. control, testosterone + MAA vs. testosterone, and testosterone + MAA vs. MAA. This approach, employ-ing pools of biological replicates, minimizes the impact of culture-to-culture variations that are unrelated to the
treatments per se. cDNAs transcribed from each pooled
RNA sample were labeled with Alexa 647 or Alexa 555 dyes in a fluorescent reverse pair design (dye swap) for competitive hybridization to Agilent Whole Genome Mouse Microarrays (Agilent Technology, array platform G4122F). Sample labeling, hybridization to microarrays, scanning, analysis of TIFF images using Agilent’s feature extraction software, calculation of linear and LOWESS
normalized expression ratios and p-value calculation
using Rosetta Resolver (version 5.1, Rosetta Biosoftware) were carried out as described [32,33]. For dye swapping experiments, the Alexa 555-labeled RNA from one of the treatment conditions (testosterone and/or MAA treated) was mixed with Alexa 647-labeled RNA for the appropriate reference control (as specified above), and vice versa. Features flagged as saturated in both fluores-cence channels or flagged as non-uniformity outliers in either channel were excluded from analysis. The full set of normalized expression ratios andp-values is available at the Gene Expression Omnibus web site of NCBI [34] as GEO series GSE27410.
Microarray annotation and statistical analysis
Agilent mouse microarray G4122F contains 41,174 mouse probes (features), each 60-nt in length. Accession numbers were obtained for 39,355 out of the 41,174 probes, of which 33,011 were assigned gene names. An additional 3,570 probes were assigned gene names using the microarray probe annotation tool AILUN [35], which maps microarray probes to Entrez genes. Each probe cor-responding to a distinct mouse transcript is referred to as representing a separate gene/gene product. For each
microarray probe, a mean fold-change andp-value was
calculated based on the set of microarray expression ratios using the Rosetta Resolver-based error model [32]. The error model uses technology-specific data para-meters to stabilize intensity variation estimates, along with error-weighted averaging of replicates. This approach has been demonstrated to provide an effective
increase in statistical power [32]. The statistical signifi-cance of differential expression of each gene was
deter-mined by application of a filter (p < 0.005) to the
Rosetta-generatedp-values. Next, a |fold-change| filter of >2-fold was combined with the above p-value filter to determine the number of probes that were differentially regulated in any of the four microarray experiments. In total, 6,416 probes met the combined thresholds for dif-ferential expression (|fold-change| >2) and statistical
sig-nificance (p < 0.005) in at least one of the four
experiments. In those cases where two or more differen-tially expressed probes mapped to the same gene and gave the same pattern of expression across all four microarrays (reflecting probe redundancy in the array platform), a single representative probe was retained in the final data set. A total of 884 redundant probes were thus eliminated, giving a total of 5,532 non-redundant probes that met the threshold criteria for both differential expression (|fold-change| >2) and statistical significance (p< 0.005) in at least one of the four experiments (Addi-tional file 2, Table S2A). The number of probes expected to meet the combined threshold by chance is 0.005 × 6,416, or 32 probes. The actual number of probes meet-ing the combined threshold was 7,811, correspondmeet-ing to an apparent false discovery rate of 32/7,811, or 0.41%. Commonly used multiple testing correction methods such as Bonferroni or Holm step-down were not applied as these eliminate a large number of true positives and introduce an inappropriate overcorrection.
A system of binary and decimal flags, termed total flag sum (TFS), was used to cluster the differentially regulated genes into subgroups based on their patterns of expres-sion across the four microarray experiments [36]. Briefly,
all genes that met the above fold-change andp-value
+ MAA vs. MAA, respectively), but not in array experi-ments 2 and 3 (MAA vs. control, and testosterone + MAA vs. testosterone). The whole number portion of the TFS group number, 9, equals the sum of the binary flag values 1 + 8, i.e., significant regulation on the 1stand 4th array experiments. Similarly, TFS group 6.0220 indicates down regulation in the 2ndand 3rdarray experiments, etc.
Gene Ontology (GO) and motif enrichment analysis GO term enrichment analysis for each TFS group was carried out using DAVID data sets [37]. Briefly, genes in each TFS group were iteratively compared with genes in each gene set that share a common GO term, and the number of overlapping genes was used to calculate an enrichment score and a Fisher’s exact test p-value for each TFS group and each gene set. GO terms enriched
atp< 0.001 and containing >5 genes with the specific GO term for at least one TFS group were selected, and TFS groups with at least one enriched GO term were selected. A total of 156 unique GO terms enriched in 17 TFS groups were obtained (Additional file 3, Table S3A). Hierarchical clustering was implemented using Cluster [38], and a corresponding heat map was drawn using Java Treeview [39]. Cis-regulatory elements asso-ciated with the gene expression changes induced by tes-tosterone and MAA were identified by gene set enrichment analysis (GSEA) by searching each group of genes against the 836 motif gene sets and against the 221 predicted microRNA (miRNA) target gene sets that comprise the C3 module of the Molecular Signatures database [40]. The motif gene sets contain genes sharing a cis-regulatory motif conserved across the human, Table 1 Classification of TFS groups of genes responding to testosterone and/or MAA
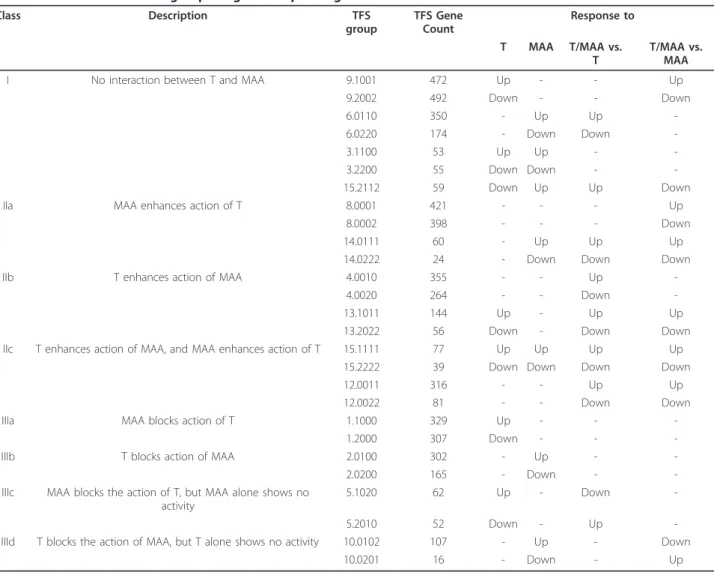
Class Description TFS
group
TFS Gene Count
Response to
T MAA T/MAA vs. T
T/MAA vs. MAA
I No interaction between T and MAA 9.1001 472 Up - - Up
9.2002 492 Down - - Down
6.0110 350 - Up Up
-6.0220 174 - Down Down
-3.1100 53 Up Up -
-3.2200 55 Down Down -
-15.2112 59 Down Up Up Down
IIa MAA enhances action of T 8.0001 421 - - - Up
8.0002 398 - - - Down
14.0111 60 - Up Up Up
14.0222 24 - Down Down Down
IIb T enhances action of MAA 4.0010 355 - - Up
-4.0020 264 - - Down
-13.1011 144 Up - Up Up
13.2022 56 Down - Down Down
IIc T enhances action of MAA, and MAA enhances action of T 15.1111 77 Up Up Up Up
15.2222 39 Down Down Down Down
12.0011 316 - - Up Up
12.0022 81 - - Down Down
IIIa MAA blocks action of T 1.1000 329 Up - -
-1.2000 307 Down - -
-IIIb T blocks action of MAA 2.0100 302 - Up -
-2.0200 165 - Down -
-IIIc MAA blocks the action of T, but MAA alone shows no activity
5.1020 62 Up - Down
-5.2010 52 Down - Up
-IIId T blocks the action of MAA, but T alone shows no activity 10.0102 107 - Up - Down
10.0201 16 - Down - Up
mouse, rat, and dog genomes, and the motifs represent known or likely transcription factor binding sites in a 4 kb genomic region centered on the transcription start site of each gene. The miRNA target gene sets are com-prised of genes with the corresponding miRNA binding sites present in 3’-UTR sequences.
Results
Generation of TM3-AR cells and AR expression
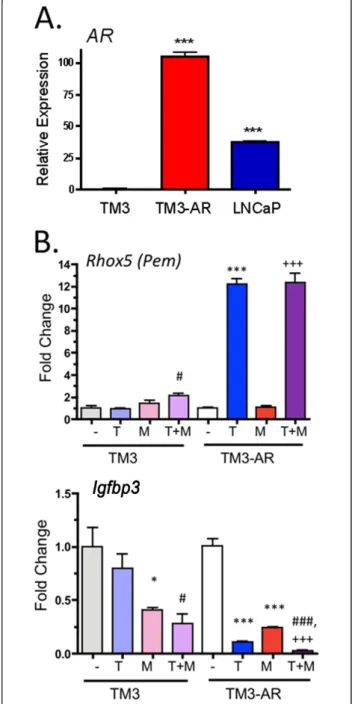
TM3 mouse Leydig cells are reported to be MAA responsive [19], however, we found AR expression to be very low, and correspondingly, the androgen responsive-ness of these cells was very weak, as judged by qPCR analysis (Figure 1). To increase the androgen response, AR cDNA was stably transfected into TM3 cells using a retroviral vector. The resulting pool of TM3-AR cells showed a marked increase in AR expression, comparable to that of the widely studied androgen responsive cell line LNCaP (Figure 1A). The androgen responsiveness of TM3-AR cells was confirmed by the ~5-fold increase
in expression of Rhox5 (Pem) and by the ~10 fold
decrease in expression ofIgfbp3 following testosterone
treatment; neither gene showed a significant response to
testosterone in TM3 cells, but the repression ofIgfbp3
by MAA [22] was evident in both cell lines (Figure 1B).
Impact of MAA on TM3-AR cell gene expression
The global impact of MAA on androgen-responsive gene expression was evaluated by microarray analysis. TM3-AR cells were treated for 24 h either with testos-terone, MAA, a combination of testosterone and MAA, or vehicle control. Total RNA from each group was then analyzed on whole-mouse genome two-color expression microarrays for the following four compari-sons: Array 1, testosterone vs. control; Array 2, MAA vs. control; Array 3, testosterone + MAA vs. testosterone; Array 4, testosterone + MAA vs. MAA. Normalized
expression ratios and p-values were determined, and
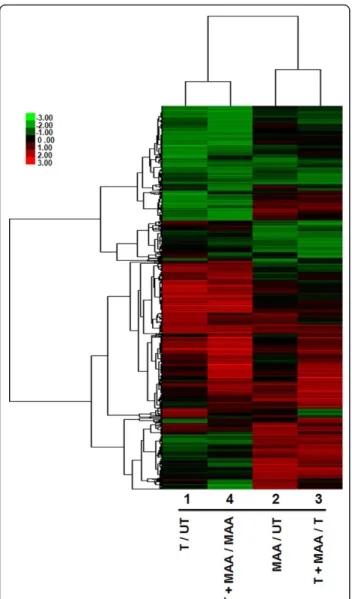
genes meeting our combined threshold for significance (|fold-change| > 2 and p< 0.005; see Methods) for at least one of the four microarray comparisons were iden-tified. A total of 5,532 genes of interest were thus obtained after elimination of redundant probes. Hier-archical clustering of these 5,532 genes revealed closest correlation between arrays 1 and 4 (effects of testoster-one in the absence and presence of MAA, respectively), and, to a lesser extent, between arrays 2 and 3 (effects of MAA in the absence and presence of testosterone, respectively) (Figure 2). A complete listing of these genes, along with their expression ratios, measured sig-nal intensities and gene annotations is provided in Addi-tional file 2, Table S2A. Testosterone induced 1,233 genes and repressed 1,205 genes (array 1), while MAA induced 1,206 genes and repressed 525 genes (array 2).
The combination of testosterone + MAA induced 1,553 genes and repressed 748 genes when compared with tes-tosterone treatment alone (array 3), while 1,587 genes were induced and 1,396 genes were repressed by testos-terone + MAA, when compared with MAA treatment alone (array 4). Among the genes induced by
testoster-one wereRhox5(Pem) [41] andAmotl1[42], two
well-characterized androgen-inducible genes. 87% of the MAA-responsive genes in TM3-AR cells identified on array 2 overlap with the set of MAA-responsive genes that we previously identified in TM3 cells that do not express AR [29], validating the robustness of the MAA response. Ingenuity Pathway Analysis revealed testoster-one related gene networks that respond to MAA; these
include cell death and cellular development, reproduc-tive system disease, and small molecule biochemistry (Figure 3 and Additional file 4, Figure S1).
MAA affects androgen response in multiple ways: clustering by significance and differential expression The impact of MAA on testosterone gene responses was investigated by classification of the regulated genes using a binary flagging system [36], whereby each gene was assigned to a specific category, termed TFS (total flagging sum), based upon its expression ratio andp-value in each of the four microarray experiments (Additional file 2, Table S2B). This system provides a simple way to identify gene groups that responded to testosterone or MAA and to determine whether there is any interaction between them. Of the 5,532 genes of interest, 5,230 (95%) could be grouped into four major classes based on the interac-tions of testosterone and MAA (Table 1 and Additional file 2, Table S2C). Class I is comprised of 1,655 genes (30% of the total) distributed into 7 TFS gene groups. These genes responded to testosterone and/or MAA but showed no interaction between testosterone and MAA. Class II is comprised of 2,235 genes (40%) distributed into 12 TFS groups. These genes displayed positive inter-actions between testosterone and MAA, i.e., testosterone
Figure 2Heat map displaying the effects of testosterone, MAA or both in combination on TM3-AR cell gene expression. Shown is the hierarchical clustering heat map of 5,532 responsive genes based on log2 ratios, with the scale as shown at the bottom, right. T, testosterone; UT, untreated.
enhanced responses to MAA, and/or vice versa, or the combination of both agents induced gene responses not observed with the individual treatments. Class III is com-prised of 1,240 genes (24%) distributed into 8 TFS groups. These genes showed negative interactions between testosterone and MAA, i.e., the response to tes-tosterone could either be blocked or reversed by MAA, or vice versa. The remaining 302 genes were distributed into 25 small TFS groups and were not considered further (Additional file 2, Table S2C).
It should be noted that the induction or repression observed by treating with testosterone + MAA is being compared with that obtained with testosterone alone (array 3) or to MAA alone (array 4), and not to the vehi-cle-treated control. In case of class III genes, this is of par-ticular importance, as in some cases, testosterone alone may cause gene induction, while treatment with testoster-one + MAA might cause repression relative to the level of expression with testosterone alone but not when com-pared to vehicle control. For example, in case ofCep70in TFS group 5.2010, the microarray signal intensities (corre-sponding to expression levels) in the control, testosterone, and testosterone + MAA samples were 6,815, 3,303 and 7,092, respectively (Additional file 2, Table S2A). These values indicate repression by testosterone and induction by testosterone + MAA as compared to testosterone, but not when compared to vehicle control. The net result, however, is that MAA blocks the repressive action of tes-tosterone. Patterns such as these, where testosterone or MAA block or reverse the response to the other agent, characterize the genes in class III.
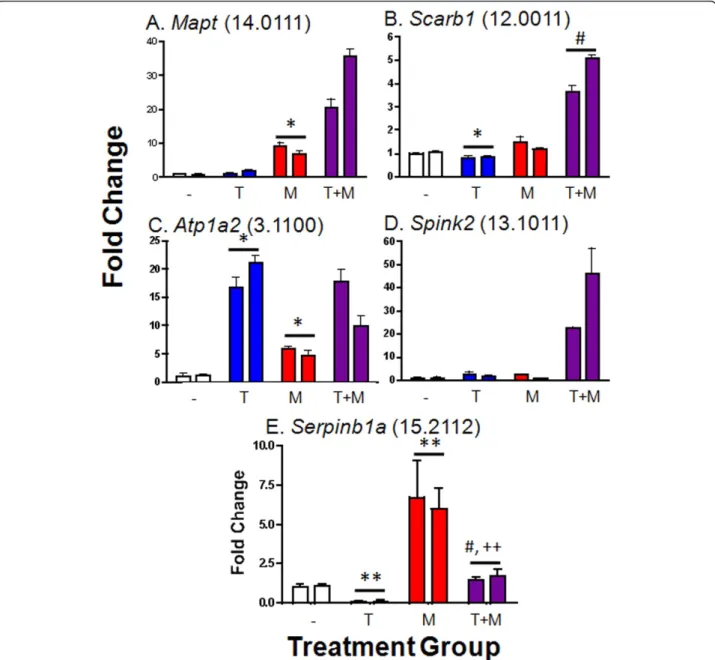
Real time qPCR validation
To confirm the results of the microarrays, qPCR analysis was carried out for 15 genes representing five different TFS groups (Figure 4 and Additional file 5, Table S4). Results were in close agreement, although in several cases fold-change values determined by qPCR were greater than those obtained by microarray (e.g.,
38.6-fold induction ofTulp2by testosterone + MAA vs.
tes-tosterone alone by qPCR, vs. 7.6-fold induction by microarray; Additional file 5, Table S4). This finding is consistent with the compression of expression ratios commonly seen using microarrays.
Functional impact of MAA on androgen responsive gene expression
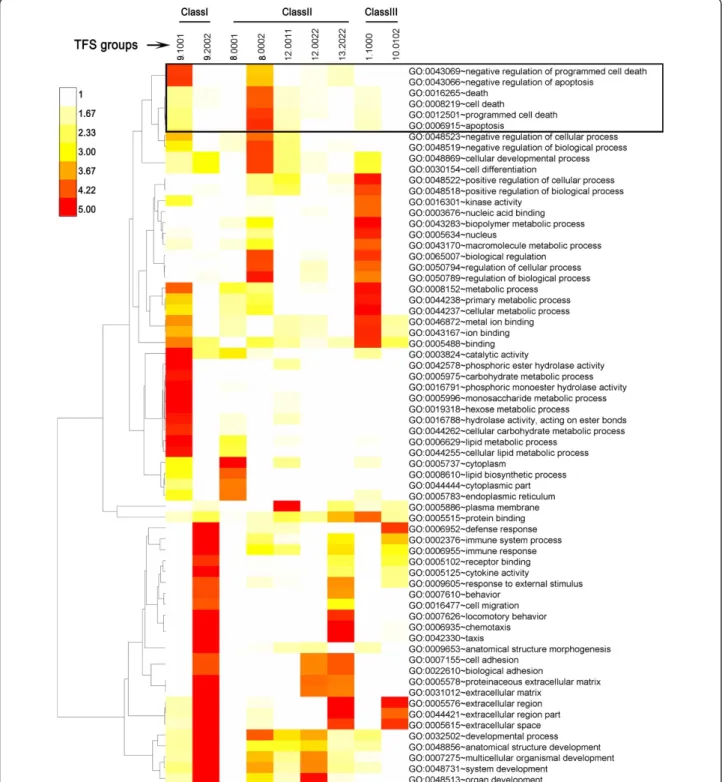
Gene Ontology (GO) term analysis was carried out to identify the functional gene categories (i.e., the GO terms) enriched in the sets of genes that comprised each major TFS group. These analyses were useful for eluci-dating the functional consequences of testosterone and MAA treatment and their interactions. A summary of the major results is presented in Figure 5, with full
details provided in Additional file 3, Table S3A. Among the gene groups showing no interaction between MAA and testosterone (class I genes), 964 genes responded to testosterone but not to MAA. The 472 class I genes up regulated by testosterone (TFS group 9.1001) were most highly enriched in GO terms associated with negative regulation of apoptosis, ion binding and lipid metabo-lism (Figure 5). In contrast, the 492 class I genes down regulated by testosterone (TFS 9.2002) were enriched for immune response, cytokine activity, chemotaxis and extracellular matrix and developmental processes (Figure 5). Class II genes, whose responses are enhanced by tes-tosterone and/or MAA, were distributed into three sub-classes (Table 1), based on whether MAA enhanced responses to testosterone (class IIa, 819 genes), testos-terone enhanced responses to MAA (class IIb, 619 genes), or the enhancement was mutual (class IIc, 734 genes). Class IIa genes showed the highest enrichment for lipid biosynthesis (TFS 8.0001), apoptosis, cell differ-entiation, and regulation of biological processes (TFS 8.0002). Class IIb genes showed highest enrichment for extracellular matrix, cell adhesion and chemotaxis (TFS 13.022), while class IIc genes showed highest enrich-ment for plasma membrane (TFS 12.0011) and for extracellular matrix, cell adhesion, and organ develop-ment (TFS 12.0022). Class III genes were distributed into subclasses, based on whether MAA blocked the response to testosterone (IIIa, IIIc) or testosterone blocked the response to MAA (IIIb, IIId) and whether testosterone and MAA are active alone (IIIa, IIIb), or not (IIIc, IIId). The largest TFS group in class IIIa (TFS 1.1000; 329 genes) showed greatest enrichment for cel-lular and biopolymer metabolic processes, nucleic acid binding, kinase activity and metal ion binding, and included 55 genes that encode nuclear factors, indicating a wide range of impact of MAA on testosterone responses. Finally, the genes in class IIId, TFS group 10.0102, whose induction by MAA was blocked by tes-tosterone, and whose suppression by testosterone was only manifested when MAA was present, showed great-est enrichment for extracellular region and defense response (Figure 5 and Additional file 3, Table S3A).
Motif enrichment analysis
Species-conserved transcription factor binding site
motifs and 3’-UTR miRNA binding sites enriched in the
genes belonging to each TFS group were identified by GSEA [40], as described under Methods. A total of 64 motifs enriched in 13 TFS groups were identified after filtering out motifs not showing enrichment atp< 0.001
and TFS groups with no enriched motifs at p< 0.001.
motif and miRNA-binding site, including enrichment scores, is provided in Additional file 3, Table S3B. Motifs enriched in the promoters of class I genes in TFS group 9.2002 including binding sites for FOXO and other forkhead family transcription factors, with FOXO motifs showing the most significant enrichment (p= 3.2
E06). SixHoxgenes that were repressed by testosterone
(TFS 9.2002) or whose repression was mutually enhanced by MAA and testosterone (TFS 12.0022), i.e.,
Hoxb5, Hoxb9, Hoxc6, Hoxc8, Hoxd3and Hoxd13, are putative targets of FOXO (Additional file 2, Table S2D),
suggesting an important role forFox andHox genes in
the modulation of AR activity by MAA. Motifs for MEF2A, TCF/LEF and STAT5 factors were also
enriched among the class I TFS groups, as were 3’-UTR
binding sites for several miRNAs. The enriched motifs for class II genes, whose response to testosterone and MAA showed mutual enhancement, include binding
Figure 5GO term enriched in TFS groups. Shown is a hierarchical clustering of GO terms that were significantly enriched (p< 0.0001, and number of included genes >10) in at least one TFS group. GO terms are displayed at the right and TFS group numbers are shown across the top. The color bar at the top left represents -log10p-values, with higher numbers (darker colors) indicating more significant enrichment. A complete list of enriched GO terms,p-values, enrichment scores and regulated genes in each GO term is provided in Additional file 2, Table S2A. GO terms associated with apoptosis are in the boxed region at the top. TFS groups represent the following groups of genes 9.1001, genes induced by testosterone, both without and with MAA present; 9.2002, genes suppressed by testosterone, both without and with MAA present; 8.0001, genes induced by testosterone, but only in the presence of MAA; 8.0002, genes suppressed by testosterone but only in the presence of MAA; 12.0011, genes induced by testosterone + MAA, relative to testosterone alone and relative to MAA alone; 12.0022, genes suppressed by testosterone + MAA, relative to testosterone and relative to MAA alone; 13.2022, genes suppressed by testosterone either alone or in
sites for MEF2, HOXA4, E2F, TCF, GATA, and others, distributed among several TFS groups (Table 2). Binding sites for STAT5, TCF/LEF, FOXF2, PGR, MYCN and several miRNAs were enriched in class III (TFS groups 1.1000, 2.0100 and 2.0200). These analyses also revealed a large number of miRNA binding sites that are
com-mon to the 3’-UTR sequences of testosterone-regulated
genes.
Discussion
MAA, the active metabolite of the industrial chemical ethylene glycol monomethyl ester, is an established testi-cular toxicant. Earlier studies suggested that MAA could potentiate AR transcriptional activity without signifi-cantly altering the dose-response curve for androgen activity, as determined in reporter gene studies [22]. Presently, the impact of MAA on expression of andro-gen-regulated genes was characterized globally in a mouse Leydig cell model. Mouse TM3 cells stably expressing AR were treated with testosterone, MAA, or with both chemicals in combination, and 5,532 genes responding to one or more treatments were identified and then classified, and sub-classified, based on their patterns of response to each treatment. GO term and motif enrichment analysis were carried out for genes in each subgroup to help identify the biological functions and pathways affected by MAA as it impacts cellular responses to testosterone.
MAA has a wide range of impact on androgen responses AR activated by testosterone can have direct effects on target gene transcription [43], as well as indirect effects
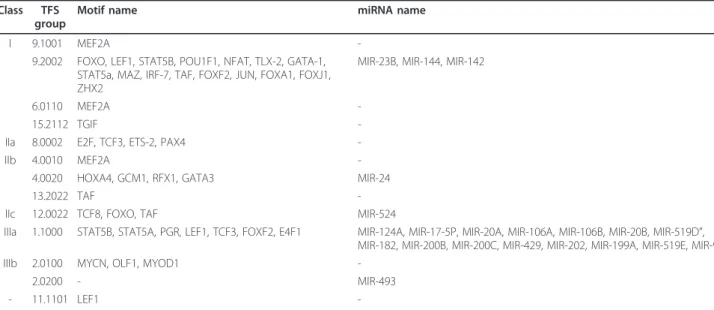
mediated by intracellular signaling pathways. These range from stimulation of protein kinases, to direct modulation of voltage- and ligand-gated ion channels and transporters [44], some of which may lead to changes in gene expression [44]. Here, our microarray analysis identified large numbers of genes that responded to testosterone, a subset of whose responses were modulated by MAA. These genes contribute to a wide range of biological processes, including cell death, development, ion binding, kinase activities and tran-scription. These findings may help explain some of the previous findings about the toxicities of MAA. For example, MAA stimulates apoptosis of male germ cells [19,23,45-48] by mechanisms proposed to involve var-ious kinases and ion transporters [45,47]. Ion transport is important for the maintenance of intracellular pH, perturbation of which can affect germ cell fertility [49]. Proteins involved in transport comprise a large group of MAA regulated genes, including genes whose expression is affected by MAA alone, and genes that are additively or synergistically regulated by MAA and testosterone. For instance, GO term enrichment analysis identified 52 ion binding protein and 19 kinase genes that were sig-nificantly enriched in the set of genes induced by testos-terone whose induction is blocked by MAA (TFS group 1.1000). This same gene set showed enrichment for genes that negatively regulate apoptosis. In contrast, both positive and negative regulators of apoptosis were enriched in the set of genes repressed by testosterone in the presence of MAA (TFS group 8.0002). Further investigation will be required to determine whether these gene responses contribute to the testicular Table 2 Transcription factors and miRNAs showing enrichment and potentially contributing to expression responses in the indicated gene classes and TFS groups
Class TFS group
Motif name miRNA name
I 9.1001 MEF2A
-9.2002 FOXO, LEF1, STAT5B, POU1F1, NFAT, TLX-2, GATA-1, STAT5a, MAZ, IRF-7, TAF, FOXF2, JUN, FOXA1, FOXJ1, ZHX2
MIR-23B, MIR-144, MIR-142
6.0110 MEF2A
-15.2112 TGIF
-IIa 8.0002 E2F, TCF3, ETS-2, PAX4
-IIb 4.0010 MEF2A
-4.0020 HOXA4, GCM1, RFX1, GATA3 MIR-24
13.2022 TAF
-IIc 12.0022 TCF8, FOXO, TAF MIR-524
IIIa 1.1000 STAT5B, STAT5A, PGR, LEF1, TCF3, FOXF2, E4F1 MIR-124A, MIR-17-5P, MIR-20A, MIR-106A, MIR-106B, MIR-20B, MIR-519D”, MIR-182, MIR-200B, MIR-200C, MIR-429, MIR-202, MIR-199A, MIR-519E, MIR-9
IIIb 2.0100 MYCN, OLF1, MYOD1
-2.0200 - MIR-493
- 11.1101 LEF1
toxicities of MAA seen in mouse models, as well as their relevance to humans exposed to MAA.
Transcription factors involved in MAA modulation of testosterone response
TM3-AR cells showed complex patterns of response to testosterone and MAA (Table 1), indicating that multi-ple mechanisms likely contribute to MAA modulation of responses to testosterone, and to testosterone modu-lation of responses to MAA. One mechanisms could involve effects of MAA on the expression of AR, whose levels were increased ~2-fold by MAA, both in the absence and in the presence of testosterone. While this effect could conceivably contribute to the positive effects of MAA on responses to testosterone (e.g., gene classes IIa, IIc, and IIId; Table 1), it does not explain the inhibi-tory effects of MAA on responses to testosterone seen in gene classes IIIa and IIIc. Moreover, for many genes in classes IIa, IIc and IIId, where MAA enhances responses to testosterone, the magnitude of the effect of MAA is greater than the observed ~2-fold increase in AR expression. These findings suggest the involvement of other transcription factors in the effects of MAA on testosterone-responsive genes.
FOXO proteins can associate with AR and other nuclear/steroid hormone receptors, leading to either inhibition or enhancement of receptor transcriptional activity [12]. These interactions have the potential to impact the development of hormone-dependent cancers, including prostate, breast and ovarian cancer [12]. Here, we found that FOXO motifs were enriched in 53 genes repressed by testosterone irrespective of whether MAA was present (11% of the genes in TFS group 9.2002), and in 12 genes down-regulated by testosterone, but only when MAA was present, and vice versa (15% of genes in TFS group 12.0022) (Additional file 2, Table S2D). These findings suggest that FOXO factors plays an important role in cellular responses to testosterone and their modulation by MAA. 18 of the potential FOXO targets are involved in transcription regulation,
including 6 Hox genes (Hoxb5, Hoxb9, Hoxc6, Hoxc8,
Hoxd3 andHoxd13) (Additional file 2, Table S2D). Of
note, loss ofHoxc6has been reported to induce
apopto-sis [50]. Moreover, 16 of the 65 FOXO target genes down regulated by testosterone are associated with developmental processes, as indicated by their GO terms. Based on our microarray signal intensity data, at least three FOXO genes are either highly expressed (Foxo1) or moderately expressed in untreated TM3-AR cells (Foxo6,Fox3a), suggesting these factors may med-iate the effects on FOXO target genes. FOX family genes are primarily regulated through the phosphoinosi-tide-3-kinase (PI3k)-Akt pathway via phosphorylation and nuclear exclusion [11], which is consistent with our
earlier finding that the PI3K/Akt pathway is required for the effects of MAA on AR transcriptional activity [22]. Two other transcription factors that are expressed in TM3-AR cells and may be involved in the interactions between testosterone and MAA are LEF/TCF and STAT5. Binding sites for LEF/TCF are significantly enriched in several sets of genes that are regulated by testosterone and MAA, while binding sites for STAT5 are enriched in genes repressed by testosterone (TFS group 9.2002) and in genes whose induction by testos-terone was blocked by MAA (TFS group 1.1000) (Table 2; Additional file 3, Table S3B). These findings are con-sistent with reports that STAT5 and LEF/TCF can mod-ulate AR-regmod-ulated gene responses, with STAT5 showing positive interactions with AR [8], and LEF/TCF either repressing or enhancing AR activity [14]. Simi-larly, our finding that binding sites for MEF2 are enriched in TFS groups responsive to testosterone or MAA (Table 2) is consistent with the finding that bind-ing sequences for MEF2 family transcription factors are commonly found near binding sites for AR, at least in muscle cells [51].
Possible roles for miRNAs in MAA and testosterone responses
miRNAs are short, ~22 nucleotides long RNAs that
gen-erally bind to 3’-UTR sequences of target mRNAs,
resulting in post-transcriptional mRNA down regulation and translational repression [52]. Here, we identified several miRNAs whose putative target sites are over-represented in genes responsive to MAA or testoster-one, suggesting a possible role for these miRNAs in mediating responses to MAA and and testosterone. Genes in TFS group 1.1000, whose induction by
testos-terone was blocked by MAA, were enriched in 3’-UTR
miRNAs, and their impact of spermatogenesis and the toxicities associated with MAA exposure.
Impact of testosterone and MAA on expression ofCYP andGSTgenes
CYP (cytochrome P450) and GST (glutathione S-trans-ferase) enzymes metabolize a broad range of endogen-ous and exogenendogen-ous compounds. Here, we found that the
expression of 20CYPand 12GSTgenes was affected by
either MAA or testosterone (Additional file 2, Table S2E). Nine of these genes were induced by MAA alone (Cyp2d22, Cyp26a1, Cyp26b1, Gstk1, Gstm6, Gstm7, Gstt2, Mgst2and Mgst3), while four genes were induced
by MAA but down regulated by testosterone (Cyp1a1,
Cyp2s1, Cyp2f2 and Mgst3). Three CYPs that show female-predominant expression in mouse liver [55] were further induced by testosterone in the presence of MAA
compared to testosterone treatment alone (Cyp2b9,
Cyp2b10 and Cyp2b13). Further studies are needed to determine whether these enzymes play a metabolic role in MAA modulation of testosterone signaling and/or the detoxification of MAA.
Conclusions
This study investigated on a genome-wide basis the impact of MAA on AR activity in a cultured Leydig cell model. MAA displayed widespread effects on androgen-responsive genes associated with diverse cellular pro-cesses, including apoptosis, ion transport, cell adhesion, phosphorylation and transcription. Binding sites for FOXO, HOX, LEF/TCF, STAT5 and MEF2 family tran-scription factors, as well as those of several miRNAs, were found to be enriched in various groups of genes regulated by testosterone and/or MAA. These findings highlight the complex interactions, both positive and negative, between androgen- and MAA-responsive genes, and provide insight into molecular mechanisms that may contribute to the toxicities associated with exposure to MAA in testicular cells in vivo.
Additional material
Additional file 1: Table S1: Mouse primer sequences for all genes analyzed by qPCR.
Additional file 2: Table S2: Detailed listings, classification and summary of genes that respond to testosterone and/or MAA.
Additional file 3: Table S3: Enrichment analysis of GO terms (A) and motifs (B)
Additional file 4: Figure S1: Networks associated with genes impacted by MAA, as identified by Ingenuity Pathway Analysis. (A) Network involved in reproductive system disease, small molecule biochemistry and lipid metabolism; (B) Small molecule biochemistry, lipid metabolism and drug metabolism. Dashed arrows indicate regulation of gene expression, arrows with solid lines represent protein-DNA interactions, and solid lines indicate protein-protein interactions. Lines in blue identify processes and factors directly connected to testosterone.
Additional file 5: Table S4: Comparison of gene expression ratios determined by qPCR and microarray analysis for 15 genes representing five TFS groups.
Additional file 6: Figure S2: Motifs enriched in different TFS groups. Shown are motifs (A) and miRNAs (B) with enrichment p-value < 0.001 in at least one TFS group and TFS groups which have at least one motif enriched withp< 0.001 are selected. TFS numbers are shown on the top of the heat map. Please refer to Additional file 2, Table S2C for the biological description of each TFS group. Numbers on the top of the color bar represent -log10Pvalue, with higher numbers indicating greater enrichment.
Acknowledgements
Supported in part by National Institutes of Health grant 5 P42 ES07381, Superfund Research Program at Boston University (to D.J.W.). The authors thank Dr. Alan Dombkowski, Wayne State University, for initial processing of microarray data sets using Rosetta Resolver.
Authors’contributions
GB and DJW conceived and designed the experiments, GB and KS performed the experiments, YZ, GB and DJW analyzed the data and wrote the paper, and DJW managed the overall design and execution of the project. All authors read and approved the final manuscript.
Competing interests
The authors declare that they have no competing interests.
Received: 10 February 2011 Accepted: 31 March 2011 Published: 31 March 2011
References
1. Szafran AT, Szwarc M, Marcelli M, Mancini MA:Androgen receptor functional analyses by high throughput imaging: determination of ligand, cell cycle, and mutation-specific effects.PLoS ONE2008,3:e3605. 2. Quigley CA, De Bellis A, Marschke KB, el-Awady MK, Wilson EM, French FS:
Androgen receptor defects: historical, clinical, and molecular perspectives.Endocr Rev1995,16:271-321.
3. Brinkmann AO, Blok LJ, de Ruiter PE, Doesburg P, Steketee K, Berrevoets CA, Trapman J:Mechanisms of androgen receptor activation and function.J Steroid Biochem Mol Biol1999,69:307-313.
4. Wang Q, Li W, Liu XS, Carroll JS, Jänne OA, Keeton EK, Chinnaiyan AM, Pienta KJ, Brown M:A Hierarchical Network of Transcription Factors Governs Androgen Receptor-Dependent Prostate Cancer Growth.Molec Cell2007,27:380-392.
5. Wang Q, Li W, Zhang Y, Yuan X, Xu K, Yu J, Chen Z, Beroukhim R, Wang H, Lupien M, Wu T, Regan MM, Meyer CA, Carroll JS, Manrai AK, Jänne OA, Balk SP, Mehra R, Han B, Chinnaiyan AM, Rubin MA, True L, Fiorentino M, Fiore C, Loda M, Kantoff PW, Liu XS, Brown M:Androgen Receptor Regulates a Distinct Transcription Program in Androgen-Independent Prostate Cancer.Cell2009,138:245-256.
6. Lin B, Wang J, Hong X, Yan X, Hwang D, Cho JH, Yi D, Utleg AG, Fang X, Schones DE, Zhao K, Omenn GS, Hood L:Integrated Expression Profiling and ChIP-seq Analyses of the Growth Inhibition Response Program of the Androgen Receptor.PLoS ONE2009,4:e6589.
7. Bhardwaj A, Rao MK, Kaur R, Buttigieg MR, Wilkinson MF:GATA factors and androgen receptor collaborate to transcriptionally activate the Rhox5 homeobox gene in Sertoli cells.Mol Cell Biol2008,28:2138-2153. 8. Tan SH, Dagvadorj A, Shen F, Gu L, Liao Z, Abdulghani J, Zhang Y,
Gelmann EP, Zellweger T, Culig Z, Visakorpi T, Bubendorf L, Kirken RA, Karras J, Nevalainen MT:Transcription Factor Stat5 Synergizes with Androgen Receptor in Prostate Cancer Cells.Cancer Res2008,68:236-248. 9. Darne CH, Morel L, Claessens F, Manin M, Fabre S, Veyssière G,
Rombauts W, Jean CL:Ubiquitous transcription factors NF1 and Sp1 are involved in the androgen activation of the mouse vas deferens protein promoter.Molec Cell Endocrinol1997,132:13-23.
11. Reagan-Shaw S, Ahmad N:The role of Forkhead-box Class O (FoxO) transcription factors in cancer: A target for the management of cancer.
Toxicol Appl Pharmacol2007,224:360-368.
12. van der Vos KE, Coffer PJ:FOXO-binding partners: it takes two to tango.
Oncogene2008,27:2289-2299.
13. Cronauer MV, Schulz WA, Burchardt T, Ackermann R, Burchardt M:
Inhibition of p53 function diminishes androgen receptor-mediated signaling in prostate cancer cell lines.Oncogene2004,23:3541-3549. 14. Chesire DR, Isaacs WB:Ligand-dependent inhibition of beta-catenin/TCF
signaling by androgen receptor.Oncogene2002,21:8453-8469. 15. Mohler ML, Bohl CE, Jones A, Coss CC, Narayanan R, He Y, Hwang DJ,
Dalton JT, Miller DD:Nonsteroidal selective androgen receptor modulators (SARMs): dissociating the anabolic and androgenic activities of the androgen receptor for therapeutic benefit.J Med Chem2009,
52:3597-3617.
16. Gray LE Jr, Wilson VS, Stoker T, Lambright C, Furr J, Noriega N, Howdeshell K, Ankley GT, Guillette L:Adverse effects of environmental antiandrogens and androgens on reproductive development in mammals.Int J Androl2006,29:96-104, discussion 105-108. 17. Wilson VS, Blystone CR, Hotchkiss AK, Rider CV, Gray LE Jr:Diverse
mechanisms of anti-androgen action: impact on male rat reproductive tract development.Int J Androl2008,31:178-187.
18. Henley DV, Korach KS:Endocrine-disrupting chemicals use distinct mechanisms of action to modulate endocrine system function.
Endocrinology2006,147:S25-32.
19. Bagchi G, Waxman DJ:Toxicity of ethylene glycol monomethyl ether: impact on testicular gene expression.Int J Androl2008,31:269-274. 20. Welsch F:The mechanism of ethylene glycol ether reproductive and
developmental toxicity and evidence for adverse effects in humans.
Toxicol Lett2005,156:13-28.
21. Jansen MS, Nagel SC, Miranda PJ, Lobenhofer EK, Afshari CA, McDonnell DP:
Short-chain fatty acids enhance nuclear receptor activity through mitogen-activated protein kinase activation and histone deacetylase inhibition.Proc Natl Acad Sci USA2004,101:7199-7204.
22. Bagchi G, Hurst CH, Waxman DJ:Interactions of methoxyacetic acid with androgen receptor.Toxicol Appl Pharmacol2009,238:101-110.
23. Tirado OM, Martinez ED, Rodriguez OC, Danielsen M, Selva DM, Reventos J, Munell F, Suarez-Quian CA:Methoxyacetic acid disregulation of androgen receptor and androgen-binding protein expression in adult rat testis.
Biol Reprod2003,68:1437-1446.
24. Tirado OM, Selva DM, Toran N, Suarez-Quian CA, Jansen M, McDonnell DP, Reventos J, Munell F:Increased expression of estrogen receptor beta in pachytene spermatocytes after short-term methoxyacetic acid administration.J Androl2004,25:84-94.
25. Wang RS, Yeh S, Tzeng CR, Chang C:Androgen receptor roles in spermatogenesis and fertility: lessons from testicular cell-specific androgen receptor knockout mice.Endocr Rev2009,30:119-132. 26. Henley DV, Mueller S, Korach KS:The short-chain fatty acid methoxyacetic
acid disrupts endogenous estrogen receptor-alpha-mediated signaling.
Environ Health Perspect2009,117:1702-1706.
27. Morgenstern JP, Land H:Advanced mammalian gene transfer: high titre retroviral vectors with multiple drug selection markers and a complementary helper-free packaging cell line.Nucleic Acids Res1990,
18:3587-3596.
28. Jounaidi Y, Hecht JE, Waxman DJ:Retroviral transfer of human cytochrome P450 genes for oxazaphosphorine-based cancer gene therapy.Cancer Res1998,58:4391-4401.
29. Bagchi G, Zhang Y, Waxman DJ:Impact of methoxyacetic acid on mouse Leydig cell gene expression.Reprod Biol Endocrinol2010,8:65.
30. Terry KK, Elswick BA, Stedman DB, Welsch F:Developmental phase alters dosimetry-teratogenicity relationship for 2-methoxyethanol in CD-1 mice.Teratology1994,49:218-227.
31. Holloway MG, Laz EV, Waxman DJ:Codependence of growth hormone-responsive, sexually dimorphic hepatic gene expression on signal transducer and activator of transcription 5b and hepatic nuclear factor 4alpha.Mol Endocrinol2006,20:647-660.
32. Weng L, Dai H, Zhan Y, He Y, Stepaniants SB, Bassett DE:Rosetta error model for gene expression analysis.Bioinformatics2006,22:1111-1121. 33. Holloway MG, Miles GD, Dombkowski AA, Waxman DJ:Liver-specific
hepatocyte nuclear factor-4alpha deficiency: greater impact on gene
expression in male than in female mouse liver.Mol Endocrinol2008,
22:1274-1286.
34. Barrett T, Troup DB, Wilhite SE, Ledoux P, Evangelista C, Kim IF, Tomashevsky M, Marshall KA, Phillippy KH, Sherman PM, Muertter RN, Holko M, Ayanbule O, Yefanov A, Soboleva A:NCBI GEO: archive for functional genomics data sets–10 years on.Nucleic Acids Res2011,39: D1005-1010[http://www.ncbi.nlm.nih.gov/geo/].
35. Chen R, Li L, Butte AJ:AILUN: reannotating gene expression data automatically.Nat Methods2007,4:879.
36. Clodfelter KH, Holloway MG, Hodor P, Park SH, Ray WJ, Waxman DJ: Sex-dependent liver gene expression is extensive and largely Sex-dependent upon signal transducer and activator of transcription 5b (STAT5b): STAT5b-dependent activation of male genes and repression of female genes revealed by microarray analysis.Mol Endocrinol2006,
20:1333-1351.
37. Huang da W, Sherman BT, Lempicki RA:Systematic and integrative analysis of large gene lists using DAVID bioinformatics resources.Nat Protoc2009,4:44-57.
38. Eisen MB, Spellman PT, Brown PO, Botstein D:Cluster analysis and display of genome-wide expression patterns.Proc Natl Acad Sci USA1998,
95:14863-14868.
39. Saldanha AJ:Java Treeview–extensible visualization of microarray data.
Bioinformatics2004,20:3246-3248.
40. Subramanian A, Tamayo P, Mootha VK, Mukherjee S, Ebert BL, Gillette MA, Paulovich A, Pomeroy SL, Golub TR, Lander ES, Mesirov JP:Gene set enrichment analysis: a knowledge-based approach for interpreting genome-wide expression profiles.Proc Natl Acad Sci USA2005,
102:15545-15550.
41. Sutton KA, Maiti S, Tribley WA, Lindsey JS, Meistrich ML, Bucana CD, Sanborn BM, Joseph DR, Griswold MD, Cornwall GA, Wilkinson MF:
Androgen regulation of the Pem homeodomain gene in mice and rat Sertoli and epididymal cells.J Androl1998,19:21-30.
42. Zhou Q, Shima JE, Nie R, Friel PJ, Griswold MD:Androgen-regulated transcripts in the neonatal mouse testis as determined through microarray analysis.Biol Reprod2005,72:1010-1019.
43. Cheung E, Kraus WL:Genomic Analyses of Hormone Signaling and Gene Regulation.Annual Review of Physiology2010,72:191-218.
44. Michels G, Hoppe UC:Rapid actions of androgens.Front Neuroendocrinol 2008,29:182-198.
45. Barone F, Aguanno S, D’Agostino A:Modulation of MAA-induced apoptosis in male germ cells: role of Sertoli cell P/Q-type calcium channels.Reprod Biol Endocrinol2005,3:13.
46. Barone F, Aguanno S, D’Alessio A, D’Agostino A:Sertoli cell modulates MAA-induced apoptosis of germ cells throughout voltage-operated calcium channels.FASEB J2004,18:353-354.
47. Jindo T, Wine RN, Li LH, Chapin RE:Protein kinase activity is central to rat germ cell apoptosis induced by methoxyacetic acid.Toxicol Pathol2001,
29:607-616.
48. Li LH, Wine RN, Chapin RE:2-Methoxyacetic acid (MAA)-induced spermatocyte apoptosis in human and rat testes: an in vitro comparison.J Androl1996,17:538-549.
49. Roos A, Boron WF:Intracellular pH.Physiol Rev1981,61:296-434. 50. Ramachandran S, Liu P, Young AN, Yin-Goen Q, Lim SD, Laycock N,
Amin MB, Carney JK, Marshall FF, Petros JA, Moreno CS:Loss of HOXC6 expression induces apoptosis in prostate cancer cells.Oncogene2005,
24:188-198.
51. Wyce A, Bai Y, Nagpal S, Thompson CC:Research Resource: The androgen receptor modulates expression of genes with critical roles in muscle development and function.Mol Endocrinol2010,24:1665-1674. 52. Djuranovic S, Nahvi A, Green R:A parsimonious model for gene
regulation by miRNAs.Science2011,331:550-553.
53. Ostling P, Leivonen SK, Aakula A, Kohonen P, Makela R, Hagman Z, Edsjo A, Kangaspeska S, Edgren H, Nicorici D, Bjartell A, Ceder Y, Perala M, Kallioniemi O:Systematic Analysis of MicroRNAs Targeting the Androgen Receptor in Prostate Cancer Cells.Cancer Res2011,71(5):1956-1967. 54. Nicholls PK, Harrison CA, Walton KL, McLachlan RI, O’Donnell L, Stanton PG:
Hormonal Regulation of Sertoli Cell Micro-RNAs at Spermiation.
Endocrinology2011,152(4):1670-1683.
56. Lindsey JS, Wilkinson MF:Pem: a testosterone- and LH-regulated homeobox gene expressed in mouse Sertoli cells and epididymis.Dev Biol1996,179:471-484.
doi:10.1186/1477-7827-9-42
Cite this article as:Bagchiet al.:Complex modulation of androgen
responsive gene expression by methoxyacetic acid.Reproductive Biology and Endocrinology20119:42.
Submit your next manuscript to BioMed Central and take full advantage of:
• Convenient online submission
• Thorough peer review
• No space constraints or color figure charges
• Immediate publication on acceptance
• Inclusion in PubMed, CAS, Scopus and Google Scholar
• Research which is freely available for redistribution