The Happy Heels Study: Testing Whether Positive Exercises Improve Mental Health, Happiness and Academics in First-Year Students
Ronald Harris Jr
Senior Honors Thesis
Faculty Advisor: Dr. Barbara Fredrickson Department of Psychology and Neuroscience
Abstract
College students face increasing amounts of stress related to navigating and thriving at universities. With increasing levels of anxiety, depressive symptoms and the strain placed on college counseling and psychological services, new creative ways are needed to assist students with their mental health and well-being. Three Good Things and a variant that focuses on social connection, are two exercises shown to improve mental and physical well-being, as well as reduce loneliness. 160 UNC first-year and transfer students participated in a two-week intervention where they performed Three Good Things (3GT) or an adapted Positivity
Resonance exercise (3GT-Social). Results showed that while no significant changes in academic performance or visits to counseling services emerged, students did report significant
improvements in loneliness, positivity resonance with strangers and acquaintances, and
The Happy Heels Study: Testing Whether Positive Exercises Improve Mental Health, Happiness and Academics in First-year University Students
Undergraduate college students are facing higher levels of stress and anxiety than ever before. From adjusting to college life, classes, exams, making friends, and pressures to succeed, more students are finding it difficult to thrive in the college environment. In 2013, the American College Health Association National College Health Assessment found that 61% of students, in a sample of over 63,000, had experienced overwhelming anxiety in the previous year. Fifty-three percent of students reported academics being “very difficult or even traumatic” to handle (American College Health Association, 2013). Since 2013, all measures of mental health for students on the assessment have worsened. In the spring of 2018, 55% of students felt hopeless, 88.1% felt overwhelmed by what they had to do, 84.6% felt exhausted, 64.4% felt lonely, 69.9% felt very sad, 42.9% felt so depressed it was difficult to function, 64.3% felt overwhelming anxiety, 13% seriously considered suicide, 8.5% committed self-harm, and 1.9% attempted suicide (American College Health Association, 2018).
Rates of depression in undergraduates have risen concurrently with anxiety (American College Health Association, 2013). Over time, more students have begun to seek out mental health and psychological services. There has been a 30% increase in the number of students going to counseling and psychological services between 2009 and 2015 (Center for Collegiate Mental Health, 2016). This trend may point to society becoming more aware of the necessity for mental health resources and reduced stigma behind psychological services. However, the
growing number of students. Many have hired additional staff, partnered with private clinics and therapists, resorted to triage-like methods to reduce appointment wait-times, and assigned clinicians for same-day care (Reilly, 2018). Despite these efforts, the volume of students is still staggering, which results in longer wait-times for appointments and the inevitability that these services will not get to every student in a timely manner. The students missed may end up developing serious mental health complications, needing to withdraw from school or even hospitalized from self-harm or suicide attempts.
Mental Health at UNC-Chapel Hill
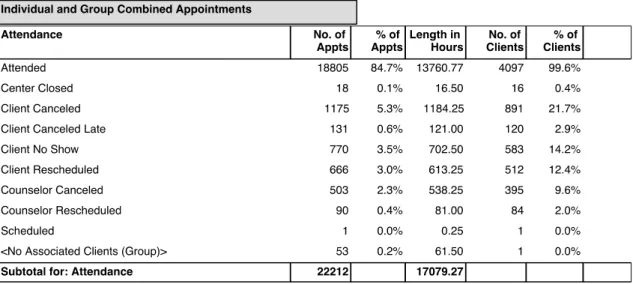
The University of North Carolina at Chapel Hill has exhibited similar trends in mental health compared to the rest of the nation. An increasing number of students face mental health challenges during their undergraduate career and more students are seeking out and utilizing Counseling and Psychological Services (CAPS) on campus. Since 2012, the number of students going to CAPS, for all appointment types (medical evaluation, medical check, telephone/web appointments, academic interventions, triage, brief therapy, and urgent crisis) has increased (Counseling and Psychological Services Appointment Statistics, 2018). The exhaustive reports from CAPS are provided in Appendix A. Notably, the rise in the number of academic
interventions, urgent crises, and triage appointments have more than doubled between the 2012-2013 and 2016-2017 academic year (+113%, +104%, +101% increase respectively) (Counseling and Psychological Services Appointment Statistics, 2018). Between July 1st, 2017 and June 30th,
2018, CAPS had 18,805 attended appointments and saw a total of 4,097 clients (Counseling and Psychological Services Appointment Statistics, 2018) or roughly equivalent to an entire
Personal conversations with Carolina Counseling and Psychological Services (CAPS), academic advisors, and admissions staff have corroborated the increases in symptoms of anxiety and depression in students. Staff members at CAPS have noted that making friends on campus, adjusting to college life, imposter syndrome, homesickness, and social anxiety are among common concerns of students. One academic advisor noted that students have anxiety due to familial pressure to perform at the perceived standard of what is considered academically “normal” at UNC (D. Robinson, personal communication, September 2018). There is sufficient evidence to suggest that more students are facing challenges while on campus and though more are seeking help, university resources struggle to assist such a high volume of students. Improving Mental Health in Healthcare Workers (HCW)
A particular psychological exercise has had documented success in alleviating burnout, depression, improving happiness and work-life balance in HCW. The Three Good Things (3GT) exercise is a short intervention that has been shown to reduce depressive symptoms, burnout, and increase happiness for six months (Seligman et al., 2005). 3GT is a short exercise in which participants write three things that went well during their day. They are typically prompted with the question “What went well today?” or slight variations of it. A recent study done at the Duke Patient Safety Center in Duke Hospital found that healthcare workers who performed 3GT for 15 days had significant improvements in burnout, depressive symptoms, happiness and work-life balance six months to a year following the intervention (Sexton & Adair, 2017). The success of this exercise in healthcare demonstrates that small interventions can have long-lasting impacts on the mental health of participants. Additional cohorts of healthcare workers have partaken in 3GT with similar results, and the Patient Safety Office continues its research into 3GT’s efficacy. Multiple units at Duke Hospital have seen improvements in their staff after partaking in the intervention.
Positivity Resonance Improves Mental Health
Research has shown that positive emotions affect a person’s mental and physical health. In particular, shared positive emotions are integral for general well-being, social interaction and health (Fredrickson, 2016). Based on this research, Dr. Barbara Fredrickson proposed positivity resonance theory, which states that these shared positive interactions can result in increases in psychological well-being, mental flourishing, and lower levels of loneliness (Major, Lundberg, & Fredrickson 2019). Positivity resonance is a brief experience that occurs when two or more individuals share an interpersonal connection with: shared positive affect, mutual care and concern, and behavioral or biological synchrony (Major et al., 2019). A recent study by Major and colleagues revealed these findings in a cohort of 81 undergraduate students at UNC-Chapel Hill. Students in the treatment condition underwent a two-week social intervention, where they were encouraged to create more positive interpersonal connections with others (Major et al., 2019). Because the study demonstrated that behaviors promoting positivity resonance can improve well-being in students, it is hypothesized that first-year students who experience more positivity resonance during their first semester will have higher levels of happiness, flourishing and general well-being.
Current Study
Recent data and research show that both universities and hospitals are currently ill-equipped to handle the increase in individuals seeking mental health services. Both healthcare workers and undergraduate students have experienced increases in anxiety, depressive
symptoms, burnout and difficulties balancing work and home. However, two simple, free interventions have provided measurable improvements to many mental health issues in
concrete intervention for healthcare workers. As a result, it may be a useful tool for
undergraduate students to use, in the same way the healthcare workers have utilized it in the hospital. In addition, in Fredrickson, Major and Lundberg’s study with undergraduates, those students who cultivated more positivity resonance not only showed lower levels of loneliness following the two-week intervention, but also displayed higher levels of flourishing mental health and psychological well-being. This positivity resonance exercise follows the same two-week duration as 3GT. As a result, in the present study, the exercise was adapted to mimic the daily reminders of 3GT, while also encouraging students to focus specifically on cultivating moments of positivity resonance with others. In maintaining the format of 3GT, participants were asked “What social interactions went well today?” While slightly different from the original positivity resonance exercise, this offers a more direct comparison between 3GT and positivity resonance. The new condition is termed 3GT-Social throughout the study.
The present study aimed to investigate if 3GT and 3GT-Social would have positive effects on first-year students embarking on their first year of college. It tested whether either of the exercises would improve the overall mental health of first-years and also affect academic performance. Improvements in students within the 3GT group stood to increase the
generalizability of the 3GT exercise to populations outside of healthcare. Improvements in students within the 3GT-Social group would further test whether increases in positivity resonance lead to better health and well-being.
It was hypothesized that students in the 3GT and 3GT-Social conditions, in comparison to an active control group, would show improved scores on a core set of measures representing mental health: burnout, depressive symptoms, school-life balance, subjective happiness and anxiety, at the conclusion of the semester. It was also hypothesized that these improvements would have observable effects on students’ academic performance as well—manifesting in a higher cumulative GPA for the fall semester. Thus, students in the treatment conditions would have a higher cumulative GPA than students in the active control group. Finally, it was
hypothesized that the two treatment groups would also have significantly fewer visits to CAPS than those in the active control condition.
These exercises may provide incoming first-year undergraduate students with a new way to cope with the stress of adjusting to college life in the same way that healthcare professionals have used 3GT in the hospital. Given that the exercises are free and require minimal time to complete, they stand to serve as an additional tool for university counseling services to use with students who require mental health support. They have the potential to be used as large-scale interventions by on-campus counseling services.
Methods Participants
excluded if they were not 18 years of age, were not a first-year or transfer student, did not consent, or did not complete the pre-survey in its entirety (see CONSORT diagram in Figure 1). Following these exclusion criteria, the remaining participants (N = 160) were randomized into an active control (n = 53) or one of two treatment groups: Three Good things (3GT; n = 54) or Positivity Resonance (3GT-Social; n = 53). The average age of participants was (M = 18.5; SD = 2.31). The final sample contained 150 first-year students and 10 transfer students (see Table 1). 130 out of 160 students in the final sample consented to allow their fall cumulative GPA to be accessed by the researchers in the spring. Participants were incentivized to complete the daily surveys by having the option to receive a customized study-specific stress ball, free of charge, at the beginning of the study, as well as be entered into a random drawing for 1 of 20 $50 Visa gift cards. Drawings for gift cards were done at random among participants who consented and provided an email to receive daily reminders throughout the study. Drawings occurred following the last follow-up survey in January. Stress balls were delivered to students via the on-campus packaging centers. Students living off campus were able to pick up their stress ball from Davie Hall at their earliest convenience.
Measures
Anxiety & Depressive symptoms: To assess anxiety and depressive symptoms in students, short forms of the Patient-Reported Outcomes and Measurement System (PROMIS®) items for anxiety and depression were used (Pilkonis et al., 2011). Participants responded to eight and seven items respectively for depressive symptoms and anxiety, indicating the
frequency that they experienced each item on a 5-level ordinal scale (never, rarely, sometimes, often, always). Example items included: “I felt worthless” (depressive symptoms) or “I felt worried” (anxiety). Cronbach’s alpha for anxiety and depressive symptoms at the pre-survey survey for the current sample were .892. and .930 respectively.
Burnout: The Maslach Burnout Inventory is the most widely used instrument to assess
burnout. A 5-item variant of the 9-item scale was used to measure emotional exhaustion in participants (Schaufeli, Bakker, Hoogduin, Schaap, & Kladler, 2001). Participants responded on a scale of 1-5 (1 = strongly disagree; 5 = strongly agree) to items such as “I feel burned out from my work”. Cronbach’s alpha at pre-survey for the current sample was .802
Gratitude: Gratitude/grateful disposition was assessed using the Gratitude
Questionnaire—6 (McCullough, Emmons, and Tsang, 2002). Participants responded to six items on a seven-point scale (1= strongly disagree to 7 = strongly agree). Example items included: “I have so much in my life to be thankful for” and “I am grateful to a wide variety of people”. Cronbach’s alpha at pre-survey for the current sample was .770.
Loneliness: Loneliness was assessed with the UCLA Loneliness Scale (version 3)
School-life balance: Students were assessed on how well they balanced various aspects of college life using the College Activities and Behaviors Questionnaire (CABQ) (Pennebaker, 2013). Students indicated the number of times they had experienced each item over the past week. Example items include: “Number of times had difficulty falling asleep___” and “Number of times exercised strenuously___”. Raw scores were aggregated into four larger categories: unhealthy behaviors, unhealthy consumption, self-care and social. Final scores were computed by subtracting the sum of the unhealthy habits (consumption and behaviors) from the positive ones (self-care and social).
Sense of belonging: Students’ sense of belonging while on campus was measured using
the 12-item General Belongingness Scale (GBS) (Malone et al., 2012). Participants responded on a seven-point Likert scale to items such as: “When I am with other people, I feel included” and “I feel accepted by others”. Cronbach’s alpha at pre-survey for the current sample was .926
Subjective Happiness: Measures of participants’ subjective happiness were done using
the Lyubomirsky and Lepper’s subjective happiness scale (SHS) (Lin J-D, Lin P-Y and Wu C-L., 2010; Sexton and Adair, 2017; Lyubomirsky and Lepper, 1999). Participants responded to items such as “In general I consider myself…” (1= not a very happy person to 7 = a very happy person). Cronbach’s alpha at pre-survey for the current sample was .866
Perceived Positivity Resonance: Positivity resonance was measured using a 7-item scale
(from 0 to 100 percent)...” for positivity resonance with close friends or romantic partners. Participants indicated how much they experienced each item as a percentage ranging from 0-100 percent. Responses from each item were averaged to make an individual score. Positivity
Resonance for romantic partners and close friends was denoted as PosRes_RC. Positivity Resonance for strangers/acquaintances was denoted as PosRes_SA. Cronbach’s alpha at the pre-survey for the current sample were .962 for PosRes_SA and .978 for PosRes_RC.
Social Curiosity: Social curiosity was measured using the 10-item Social Curiosity Scale
(SCS) (Renner, 2006). Participants responded to items such as “I like to learn about the habits of others” and “When people quarrel, I like to know what’s going on” on a 5-point Likert scale (1= Does not describe me to 5= Describes me extremely well). Cronbach’s alpha at pre-survey for the current sample was .760.
Positive Empathy: Positive empathy was measured using the Positive Empathy Scale
(Morelli, Lieberman, & Zaki, 2015). Participants responded on a 5-point Likert scale to items such as “When someone is else is enthusiastic, I can’t help but be enthusiastic too”. Cronbach’s alpha at pre-survey for the current sample was .853.
Satisfaction with Life: Satisfaction with life was measured using the Riverside
Satisfaction with Life Scale (Margolis, Schwitzgebel, Ozer, & Lyubomirsky, 2018). Participants responded on a 7-point Likert scale (1= Strongly Disagree to 7= Strongly Agree) to items such as “I like how my life is going” and “I am content with my life.” Cronbach’s alpha at pre-survey for the current sample was .836.
Design
Qualtrics survey containing the consent form, option to receive a stress ball as incentive, and the pre-survey. In the consent form, students could choose to: consent to the study and share their fall semester GPA at the end of the study; consent to the study and NOT share their fall semester GPA at the end of the study; or not consent to be in the study. Students who were not 18 or did not classify as first-years or transfer students, were screened out, while those meeting the requirements continued to the pre-survey. Participants received all correspondences through email and text and all data was collected via Qualtrics.
Consenting participants completed the pre-survey in Qualtrics assessing initial levels of anxiety, burnout, depressive symptoms, school-life balance, gratitude, loneliness, sense of belonging, subjective happiness, positivity resonance, and positive empathy. Following the pre-survey, they were randomly assigned into an active control or one of two treatment conditions: Three Good Things (3GT) or Positivity Resonance (3GT-Social). All groups began their
respective intervention on November 1st, during which they received an email and text message
(if participants opted in to provide a phone number) each evening, asking them to complete their daily exercise. Messages were sent at 7pm daily.
Participants in the active control condition were asked “What did you do today?”, those in the Three Good Things (3GT) condition were asked “What went well today?”, and those in the positivity resonance condition (3GT-Social) were asked “What social interactions went well today?”. In each condition, participants were encouraged to provide a minimum of three
responses but could list up to six. The intervention period lasted 15 days—concluding on November 15th. An error in the survey distribution also resulted in participants in the active
Within the intervention period, all participants were presented with repeat assessments of anxiety, burnout, depressive symptoms, school-life balance, gratitude, loneliness, sense of belonging, subjective happiness, positivity resonance, and positive empathy on days 7 and 15. After the intervention period, follow up measures of all mental health measures were collected two (Follow-up 1), four (Follow-up 2) and eight (Follow-up 3) weeks after the intervention. Participants were also asked if they had visited Counseling and Psychological Services (CAPS) throughout the semester. In January, fall 2018 cumulative GPAs of consenting participants (n = 130) were obtained through the UNC Registrar’s Office. All students were sent a debriefing email and offered to attend an additional debriefing session to learn the results of the study.
Results Statistical Analysis
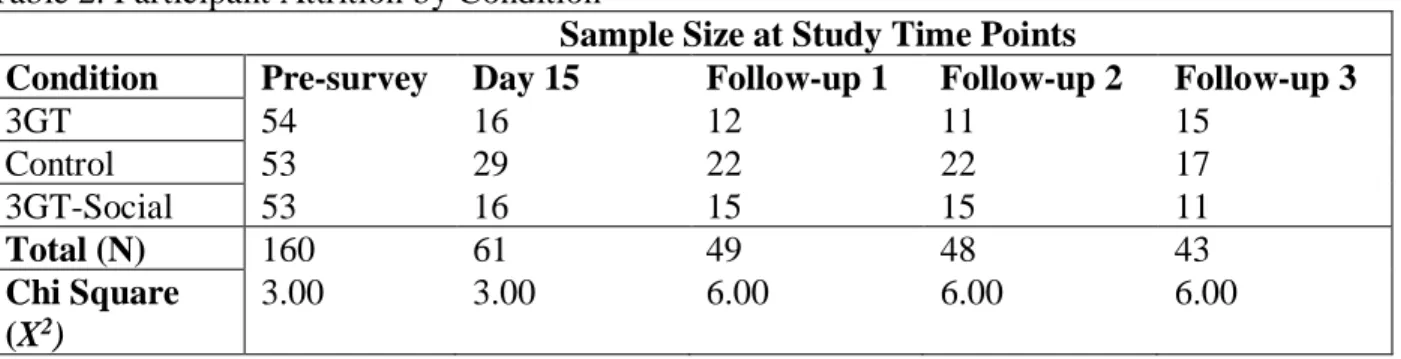
Attrition
Collapsing across conditions over the intervention period, attrition rates through the intervention period were 69.1% compared to Sexton and Adair’s, 2017 3GT study, which had attritions rates averaging 53% following their intervention. Table 2 shows the sample size of each condition as the study progressed. A Chi Square analysis determined that attrition rates at each time point were not significantly different across conditions. However, because there was a large amount of participant drop-out, additional analysis of pre-survey results examined whether students who dropped out of the study had markedly different scores on pre-survey mental health measures. A one-way ANOVA tested all pre-survey measures against whether or not participants dropped out at Day 15. Results determined that students who dropped out had higher levels of anxiety than those who completed the intervention period (F = 5.892 p < .05). For all other measures, there was no difference in pre-survey scores between those who dropped out and those who remained in the study. Thus, the group of students who did not complete the intervention were more anxious prior to its start (M = 18.13) compared to those who were retained (M = 16.03), but did not differ in other measures assessing mental health.
Student Mental Health Pre-Intervention
100-point scale. A threshold of 50 was used to mark moderate levels of burnout and considered percent concerning (Schaufeli et al., 2001). Raw scores for depressive symptoms were converted to t-scores and scores beyond 1 standard deviation (60+) were considered moderate levels of depressive symptoms and marked as percent concerning (Choi, Schalet, Cook & Cella, 2014). Percent concerning for sense of belonging was determined by comparing the scores for inclusion and rejection questions within the scale; inclusion scores were summed separately from
rejection. A difference score was calculated by subtracting inclusion scores from rejection scores, with a positive difference score indicating higher feelings of rejection and isolation. A difference score of 10 or higher was considered a percent concerning level of isolation. Individual items for happiness were averaged across all responses. A score below 5 marked percent concerning in line with data on various populations (Lyubomirsky, 1999). A score of 50 or higher for loneliness was considered a moderate level of loneliness by Perry and was used as the threshold of percent concerning for students (Perry, 1990). A score below -2 for school-life balance was marked as percent concerning and indicated that students were engaging in greater proportion of negative habits than positive ones on campus.
More than half of participants met the percent concerning criteria for happiness and loneliness (64.4% and 62.5%) and 31.1% of students had difficulties with school-life balance. Overall, this shows that as new students begin the second half of the semester in November, more than one in two students feels at least moderately unhappy and lonely, and that nearly a third are having difficulties balancing the various aspects of college life.
Mental Health Measures Post Intervention
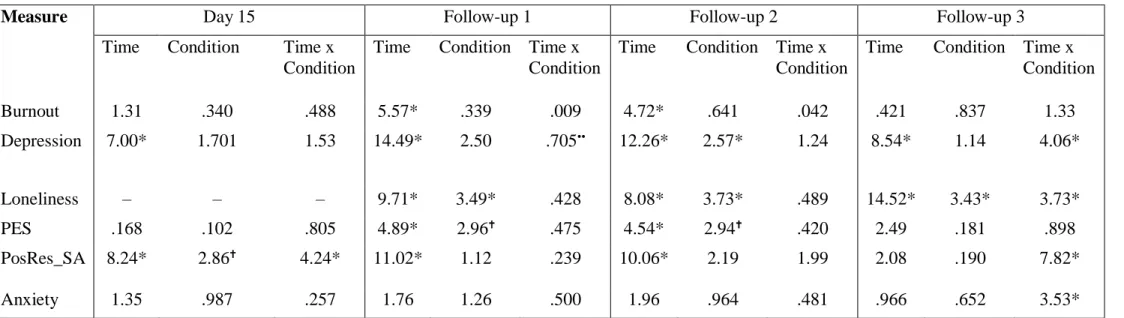
account for sphericity were used to determine between-group differences while controlling for pre-survey results. As shown, significant differences were observed in burnout, depressive symptoms, loneliness, anxiety, positive empathy, and positivity resonance for
strangers/acquaintances at various timepoints post-intervention. All unlisted measures were not significantly different at all post-intervention timepoints. Graphs depicting the change in scores over time for both significant and nonsignificant measures are displayed in Figure 4 of Appendix B.
Students in all conditions improved their scores in depressive symptoms throughout the exercise. Within-subject effects showed a main effect of time from the pre-survey to Day 15 (F = 7.00, p < .05).
Repeated measures showed a significant main effect for time (F= 14.51, p < .05) and moderating effect by condition (F= 3.734, p < .05) for loneliness from the pre-survey to Day 15. Post hoc tests showed that at Day 15, students in the 3GT-Social condition (M = 35, SD = 13.4) were significantly different in their improvement from the active control and 3GT conditions (M = 55.35, SD = 13.4) (M = 52.64, SD = 19.6) respectively.
Repeated measures showed a significant main effect for time (F= 8.24, p < .05) and time x condition (F= 4.24, p < .05) for positivity resonance with strangers/acquaintances at Day 15. Post hoc tests revealed that self-reported scores for positivity resonance with
of 74.89 at Day 15. This improvement was maintained at the 8-week follow-up, with students in this condition reporting a mean score of 74.36.
Academic performance
During the spring semester, fall cumulative GPA was obtained from the registrar for consenting participants (n = 130). A one-way ANOVA determined that there was no significant difference between each condition’s average GPA at the end of the fall semester (F = 1.92, p = .151). Due to attrition throughout the intervention period, a second ANOVA tested if students who dropped out differed significantly in their GPA from those who remained in the study. Results showed that those who dropped out of the study were not significantly different in the fall cumulative GPA than those who were retained in the study (F = .039, p > .05). The average cumulative GPA for all students was a 3.40 with a standard deviation of .628, 95% CI [3.22, 3.45].
CAPS Visits
After the intervention, participants were asked whether or not they had visited Counseling and Psychological Services (CAPS) during the semester. Of the 41 students that responded, two students went one time and six more than once. There was no difference between groups in the number of visits.
Discussion
findings suggest that students improved over the semester in certain measures and not others. In particular, loneliness and positivity resonance with strangers and acquaintances showed
significant improvements by virtue of the 3GT-Social exercise. Not only did students improve on these measures, but a number of these differential improvements were maintained after the intervention period into the start of the spring semester. Students continued to feel significantly less lonely and had warmer social connections with individuals that were not already close friends or romantic partners in the spring. In addition to loneliness and positivity resonance with strangers and acquaintances, students in the 3GT-Social condition also had significant
improvements in anxiety between the start and 8-week follow up from the study. They also saw improvements in depressive symptoms following the intervention, with between-group
differences that approached significance at the 2-week follow-up. It should be noted that attrition of research participants throughout the study was high and resulted in fewer students completing the follow-up measures as time progressed. Studies done by the Duke Patient Safety Center with 3GT report attrition rates of 50% to be typical of such study designs (Sexton and Adair, 2017). The incentives provided in this study served to encourage the completion of the daily surveys, though did not guarantee 100% participation by all students.
Students in the 3GT-Social condition improved from the pre-survey to the end of the exercise in loneliness and positivity resonance with strangers and acquaintances. Then after the intervention period, they had larger decreases in anxiety than the control or 3GT condition at the 8-week follow up. Thus, students who were encouraged to reflect on, and implicitly create, positive social interactions with strangers or acquaintances in the fall semester, came back in January with lower anxiety levels than those who did not. And though the college environment does provide a space to meet new people, it was students in this condition who saw significant improvements in loneliness. Fredrickson’s (2016) theory on positivity resonance is supported by studies indicating that positivity resonance is correlated with improvements in flourishing mental health, decreases in depressive symptoms, and loneliness. Additionally, in Fredrickson, Major, and Lundberg’s (2019) study, students in the experimental (positivity resonance) condition had increased positivity resonance, which predicted lower levels of loneliness after the two-week intervention (Major et al., 2019). Taken into consideration, the results of the present study further support that social interventions can increase positivity resonance and decrease
loneliness. This is pertinent considering that UNC students who initially met percent concerning levels for loneliness (62.5%) is comparable to the spring 2018 national average of 64.4%. There may be broader applications for such interventions beyond UNC-Chapel Hill: levels of loneliness are high in colleges across the country. Other schools could adopt similar interventions for students to address high levels of loneliness on their respective campuses.
individuals to reflect on positive aspects (and/or interactions) of their lives can have long-lasting impacts on mental health and well-being (Sexton and Adair, 2017).
This study also provided a platform for over 100 students to be reached continuously for two weeks, while simultaneously tracking their mental health status throughout the entirety of the semester. Funding to disseminate the survey was at no cost to students and minimal costs to the researchers. Participating students were able to receive daily email links to the surveys and could opt in for additional reminders via text messages. Given that students did in fact have significant improvements by virtue of the interventions, this framework could be adapted as a type of wellness-intervention for students, as well as provide quality metrics for university entities wishing to assess the well-being of students during the semester. For counseling and psychological services, an exercise of this type could be used to help a vast number of students feel less lonely on campus by gently encouraging them to reflect on social interactions they had each day. Social interactions with peripheral members of our social network i.e. classmates, a cashier, old friends or colleagues, have been shown to promote well-being (Sandstorm and Dunn, 2014). At UNC alone, staff and students alike are aware that meeting new people can be a
Some limitations of this study include the attrition of research participants throughout the study. Maintaining a larger sample size for each condition would likely increase the reliability of significant findings. Allowing students to complete the daily exercises via mobile devices, as opposed to only receiving reminders via their phones, could allow for more consistent
participation. Additionally, students may require more reminders to complete the follow-up surveys. Students may also be more inclined to continue participating if each completed daily survey accrued a reward. For example: completing seven days meant a participant would receive a stress ball and completing 15 days entered them into the drawing for a visa gift card. An error in the survey distribution also resulted in participants in the control condition not receiving the loneliness scale for Day 15. Thus, changes from the pre-survey to Day 15 were not able to be obtained. More transfer students in the population would allow for stronger analysis of possible differences between first-year and transfer students’ mental health and academic performance.
The Happy Heels Study sought to test if Three Good Things and a new positivity resonance exercise—3GT-Social, would improve the mental health and academic performance of first-year and transfer students. Results showed improvements in loneliness and positivity resonance with strangers and acquaintances, and had changes approaching significance for depressive symptoms. A number of students were able to receive an exercise improving some aspects of their mental health without visiting a CAPS office on campus. This method of
References
American College Health Association. American College Health Association-National College Health Assessment II: Reference Group Executive Summary Spring 2013. Hanover, MD: American College Health Association; 2013.
American College Health Association. American College Health Association-National College Health Assessment II: Reference Group Executive Summary Fall 2015. Hanover, MD: American College Health Association; 2015
American College Health Association. American College Health Association-National College Health Assessment II: Reference Group Executive Summary Spring 2016. Hanover, MD: American College Health Association; 2016
American College Health Association. American College Health Association-National College Health Assessment II: Reference Group Executive Summary Fall 2017. Hanover, MD: American College Health Association; 2017
American College Health Association. American College Health Association-National College Health Assessment II: Reference Group Executive Summary Spring 2018. Hanover, MD: American College Health Association; 2018
Andresen EM, Malmgren JA, Carter WB, Patrick DL. Screening for depression in well older adults: evaluation of a short form of the CES-D (Center for Epidemiologic Studies Depression Scale). Am J Prev Med. 1994;10(2):77-84.
Blanc, A. L., Bruce, L. C., Heimberg, R. G., Hope, D. A., Blanco, C., Schneier, F. R., &
Liebowitz, M. R. (2014). Evaluation of the Psychometric Properties of Two Short Forms of the Social Interaction Anxiety Scale and the Social Phobia Scale. Assessment,21(3), 312-323. doi:10.1177/1073191114521279
Björgvinsson, T., Kertz, S. J., Bigda-Peyton, J. S., Mccoy, K. L., & Aderka, I. M. (2013). Psychometric Properties of the CES-D-10 in a Psychiatric Sample. Assessment,20(4), 429-436. doi:10.1177/1073191113481998
Center for Collegiate Mental Health. (2016, January). 2015 Annual Report (Publication No. STA 15-108).
Center for Collegiate Mental Health. (2017, January). 2016 Annual Report (Publication No. STA 17-74).
Choi, S.W., Schalet, B., Cook, K.F., & Cella, D. (2014). Establishing a Common Metric for Depressive Symptoms: Linking the BDI-II, CES-D, and PHQ-9 to PROMIS Depression. Psychological Assessment, 26(2), 513-527.
Denizet-lewis, B. (2017, October 11). Why Are More American Teenagers Than Ever Suffering From Severe Anxiety? Retrieved from
https://www.nytimes.com/2017/10/11/magazine/why-are-more-american-teenagers-than-ever-suffering-from-severe-anxiety.html
Feldt, R. C., & Koch, C. (2011). Reliability and Construct Validity of the College Student Stress Scale. Psychological Reports,108(2), 660-666. doi:10.1037/e566842012-547
Lin J-D, Lin P-Y, Wu C-L. Wellbeing perception of institutional caregivers working for people with disabilities: use of Subjective Happiness Scale and Satisfaction with Life Scale analyses. Res Dev Disabil. 2010;31(5):1083-1090.
Lyubomirsky S, Lepper HS. A Measure of Subjective Happiness: Preliminary Reliability and Construct Validation. Soc Indic Res. 1999;46(2):137-155.
Major, B. C., Le Nguyen, K. D., Lundberg, K. B. & Fredrickson, B. L. (in press). Well-being correlates of perceived positivity resonance: Evidence from trait and episode-level assessments. Personality and Social Psychology Bulletin.
Major, B., Lundberg, K. B., & Fredrickson, B. L. (2019). Cultivating positivity resonance in daily social interactions: Testing the effects of a social intervention on well-being. Unpublished manuscript.
Malone, G. P., Pillow, D. R., & Osman, A. (2012). The General Belongingness Scale (GBS): Assessing achieved belongingness. Personality and Individual Differences,52(3), 311-316. doi:10.1016/j.paid.2011.10.027
Margolis, S., Schwitzgebel, E., Ozer, D. J., & Lyubomirsky, S. (2018). A new measure of life satisfaction: The Riverside Life Satisfaction Scale. Journal of Personality Assessment. https://doi.org/10.1080/00223891.2018.1464457
Maslach, Christina, and Susan E. Jackson. "Maslach Burnout Inventory--ES Form." PsycTESTS Dataset, 1981. doi:10.1037/t05190-000.
McCullough, M. E., Emmons, R. A., & Tsang, J. (2002). The grateful disposition: A
Morelli, S. A., Lieberman, M. D., & Zaki, J. (2015). The Emerging Study of Positive Empathy. Social and Personality Psychology Compass,9(2), 57-68.
doi:10.1111/spc3.12157
Reilly, K. (2018, March 19). Anxiety and Depression: More College Students Seeking Help. Retrieved from http://time.com/5190291/anxiety-depression-college-university-students/ Renner, B. (2006). Curiosity About People: The Development of a Social Curiosity Measure in
Adults, Journal of Personality Assessment, 87:3, 305-316, DOI: 10.1207/ s15327752jpa8703_11
Pennebaker, J.W. (2013). College Activities and Behaviors Questionnaire (CABQ).
Measurement Instrument Database for the Social Science. Retrieved from www.midss.ie Perlman, B., & Hartman, E. A. (1982). Burnout: Summary and Future Research. Human
Relations,35(4), 283-305. doi:10.1177/001872678203500402
Perry G. Loneliness and coping among tertiary level adult cancer patients in the home (1990). Cancer Nursing, 13, 293–302.
Pilkonis, P. A., Choi, S. W., Reise, S. P., Stover, A. M., Riley, W. T., & Cella, D. (2011). Item Banks for Measuring Emotional Distress From the Patient-Reported Outcomes
Measurement Information System (PROMIS®): Depression, Anxiety, and Anger. Assessment,18(3), 263-283. doi:10.1177/1073191111411667
Russell, D. (1996). UCLA Loneliness Scale (Version 3): Reliability, validity, and factor structure. Journal of Personality Assessment, 66, 20-40.
Schaufeli WB, Bakker AB, Hoogduin K, Schaap C, and Kladler A. On the clinical validity of the maslach burnout inventory and the burnout measure. Psychol Health. 2001;16(5):565-582.
Seligman, M. E., Steen, T. A., Park, N., & Peterson, C. (2005). Positive Psychology Progress: Empirical Validation of Interventions. American Psychologist,60(5), 410-421.
doi:10.1037/0003-066x.60.5.410
Sexton, J. B., & Adair, K. C. (2017). 45 Good Things: Assessing and Improving Healthcare Worker Resilience using the Three Good Things Intervention for 15 Days. Manuscript submitted for publication.
Sexton JB., Schwartz S.P., Chadwick W.A., Rehder K.J., Bae J., Bokovoy J., . . . Profit J. (2017). The associations between work–life balance behaviours, teamwork climate and safety climate: cross-sectional survey introducing the work–life climate scale, psychometric properties, benchmarking data and future directions. BMJ Qual Saf, 26, 632-640. doi:10.1136/bmjqs-2016-006032
Shanafelt, T. D., Balch, C. M., Bechamps, G., Russell, T., Dyrbye, L., Satele, D., . . . Freischlag, J. (2010). Burnout and Medical Errors Among American Surgeons. Annals of
Surgery,251(6), 995-1000. doi:10.1097/sla.0b013e3181bfdab3
Shanafelt, T. D., Hasan, O., Dyrbye, L. N., Sinsky, C., Satele, D., Sloan, J., and West, C. P. (2015). Changes in Burnout and Satisfaction with Work-Life Balance in Physicians and the General US Working Population Between 2011 and 2014. Mayo Clinic
Welp, A., Meier, L. L., and Manser, T. (2015). Emotional exhaustion and workload predict clinician-rated and objective patient safety. Frontiers in Psychology,5.
Appendix A. Table 1.
Participant Demographics by Condition
3GT (N=54) Control (N=53) 3GT-Social (N=53) Chi Square
Significance
M SD M SD M SD X2 p
Age (years) 18.6 .231 18.2 .233 18.2 .243 9.379 .639 Class Year
(# of students)
First Year
Transfer First Year
Transfer First Year
Transfer
51 3 50 3 49 4 .228 .892
Table 2. Participant Attrition by Condition
Sample Size at Study Time Points
Condition Pre-survey Day 15 Follow-up 1 Follow-up 2 Follow-up 3
3GT 54 16 12 11 15
Control 53 29 22 22 17
3GT-Social 53 16 15 15 11
Total (N) 160 61 49 48 43
Chi Square (X2)
3.00 3.00 6.00 6.00 6.00
Note: * p < .05
Table 3.
Students with Percent Concerning Scores at Pre-Survey Measure Students with % Concerning at
Pre-survey
Anxiety 8.8 % (14 of 160) Burnout 16.9% (27 of 160) Belonging 7.5% (12 of 160) Depression 18.8% (30 of 160) Happiness 64.4% (103 of 160) Loneliness 62.5% (100 of 160) School-life
balance
Table 4. Summary of Significant Mental Health Changes from Pre-Survey to After Intervention Period
Measure Day 15 Follow-up 1 Follow-up 2 Follow-up 3
Time Condition Time x Condition
Time Condition Time x Condition
Time Condition Time x Condition
Time Condition Time x Condition
Burnout 1.31 .340 .488 5.57* .339 .009 4.72* .641 .042 .421 .837 1.33
Depression 7.00* 1.701 1.53 14.49* 2.50 .705•• 12.26* 2.57* 1.24 8.54* 1.14 4.06*
Loneliness – – – 9.71* 3.49* .428 8.08* 3.73* .489 14.52* 3.43* 3.73*
PES .168 .102 .805 4.89* 2.96 .475 4.54* 2.94 .420 2.49 .181 .898
PosRes_SA 8.24* 2.86 4.24* 11.02* 1.12 .239 10.06* 2.19 1.99 2.08 .190 7.82*
Anxiety 1.35 .987 .257 1.76 1.26 .500 1.96 .964 .481 .966 .652 3.53*
Figure 1.
Figure 2.
UNC-Chapel Hill CAPS Appointment Trends from 2012-2017
CAPS ANNUAL VISIT COUNTS BY APPOINTMENT TYPE
650 829 777 788 819
2012-13 2013-14 2014-15 2015-16 2016-17
Med Eval
1867 2396 2511
2842 3154
2012-13 2013-14 2014-15 2015-16 2016-17
Med Check
4490 4657
5270 5557 6430
2012-13 2013-14 2014-15 2015-16 2016-17
Tele/Web
168
279 278 287 358
2012-13 2013-14 2014-15 2015-16 2016-17
Academic Intervention
3185 3238 3372 5557
6430
2012-13 2013-14 2014-15 2015-16 2016-17
Triage
5272 5552 5398 5837 6767
2012-13 2013-14 2014-15 2015-16 2016-17
Brief Therapy
169 171 202 257
346
2012-13 2013-14 2014-15 2015-16 2016-17
Urgent Crisis
Percentages of Change: 2012-13 v 2016-17
Med Eval: + 24.4%
Med Check: + 68.9%
Tele/Web Encounters: +43.2%
Academic Intervention: + 113%
Brief Therapy: +28.3%
Triage: +101%
Appendix B.
Figure 4. Mean Change in Mental Health Measures Over the Course of the Study. Note: Error bars denote standard deviations
10 15 20 25 30
0 10 20 30 40 50 60 70 80
Mean S
cor
e
Day
Happiness
3GT Control 3GT-Social
40 45 50 55 60 65 70 75 80
0 10 20 30 40 50 60 70 80
M
ean S
core
Day
Belonging
0 5 10 15 20 25
0 10 20 30 40 50 60 70 80
Mean S cor e Day
Burnout
3GT Control 3GT-Social 25 30 35 40 450 10 20 30 40 50 60 70 80
M ean S core Day
Gratitude
3GT Control 3GT-Social 0 5 10 15 20 250 10 20 30 40 50 60 70 80
5 10 15 20 25 30
0 10 20 30 40 50 60 70 80
M ean S core Day
Depressive Symptoms
3GT Control 3GT-Social 15 20 25 30 35 400 10 20 30 40 50 60 70 80
M
ean S
core
Day
Satisfaction with Life
3GT Control 3GT-Social 20 30 40 50 60 70 80
0 10 20 30 40 50 60 70 80
20 30 40 50
0 10 20 30 40 50 60 70 80
M ean S core Day
Social Curiosity
3GT Control 3GT-Social 15 20 25 30 35 400 10 20 30 40 50 60 70 80
M ean S core Day
Positive Empathy
3GT Control 3GT-Social 20 30 40 50 60 70 80 90 1000 10 20 30 40 50 60 70 80
M
ean S
core
Day
Positivity Resonance Stranger/Acquaintance
40 70 100
0 10 20 30 40 50 60 70 80
M
ean S
core
Day
Positivity Resonance Romantic Partner/Close Friend
3GT Control 3GT-Social
-30 -20 -10 0 10 20 30 40
0 10 20 30 40 50 60 70 80
M
ean S
core
Day