The role of hybridization in the range expansion of
the Plains spadefoot toad
By
Rafael Gutierrez
Senior Honors Thesis Biology Department
University of North Carolina at Chapel Hill 04/20/2016
Aproved:
Gutierrez et al., page 2
Introduction
The evolution of species ranges is fundamental to understanding how biodiversity is
distributed and maintained (Minelli 2005). However, we still do not fully know how species
geographic ranges evolve and what factors fuel range expansions when they do occur. The range
of a species is influenced by biotic factors such as predation, parasitism, competition, and abiotic
factors such as climate, food availability, soil type, etc.(Gaston 2003, Chunco et al. 2012). These
factors lead to variation in biodiversity by favoring one species and allowing its expansion while
hindering the range of others. This fact is increasingly important as evidence shows that modern
climate change is altering the distribution of animal and plants species around the world
(Parmesan and Yohe 2003). As the range of a particular species increases, it can invade the
territory of other species and drive them into extinction, thereby diminishing
biodiversity(Colautti and Barrett 2013). Invasive species cause substantial damage to the
environment, leading to changes in the structure and composition of communities (O’Dowd et al.
2003, Whitney and Gabler 2008).
Most commonly, the range of species is limited by the inability of the population at the
range edge to adapt to novel environments before becoming extinct (Sexton et al. 2009). It is
expected that new alleles would arise through mutations or gene flow to provide edge
populations with the adaptive capabilities to survive (Edmonds et al. 2004, Sexton et al. 2011).
However, the time frame for adaptive mutations is too long to have an effect on the survival of
edge populations, and gene flow from conspecifics from the center of the range often contribute
maladaptive alleles for the habitat in the range edge (Stearns and Sage 1980, Brussard 1984,
Hardie and Hutchings 2010). An often unidentified alternative source of adaptive gene flow may
originate from hybridization with closely related species that already are adapted to the new
due to the fact that hybrid offspring tend to have congenital defects (Rhymer and Simberloff
1996), it may provide populations at the range edges crucial traits for their survival and
expansion.
To better understand the mechanisms behind range expansion and whether hybridization
plays a role in it, we used the Plains spadefoot toads, Spea bombifrons,as a model. S. bombifrons
occupy a wide range throughout the western and central United States (Fig. 1) and is thought to
be ancestral to the central plains region (Stebbins 1985). After the most recent glacial retreat, S.
bombifrons expanded its range northward into a similar grassland, with a further northern
expansion taking place in current populations (Stebbins 1985). Even though most of the northern
expansion has been towards similar habitats, a remarkable expansion by S. bombifrons is taking
place southwestward into an entirely different environment, a desert. The southern expansion is
striking because a limiting environmental factor for these amphibians is the existence of water
that lasts long enough for their larvae to metamorphose, and ponds in the deserts last for a
significantly shorter amount of time than in grasslands.
To overcome the challenges presented to deserts amphibians, closely related species have
evolved shorter developmental times that allow them to metamorphose before the ponds dry. S.
multiplicata is one of the species of spadefoot toads that are native to the southwestern desert
area, and is noteworthy for their rapid development (Banbury and Maglia 2006). It has been
shown that when S. multiplicata and S. bombifrons hybridize their hybrid offspring are not only
viable, but develop faster than pure S. bombifrons tadpoles, which is beneficial trait for survival
in the desert habitat (Pfennig 2007). Therefore, we hypothesize that S. bombifrons was able to
expand into the desert habitat by hybridizing with the related toad species S. multiplicata.
Gutierrez et al., page 4
bombifrons expanded its range not only to the south western desert region but also to the
northern grasslands in order to identify the different mechanisms fueling this expansion.
To effectively device how the range expansion of S. bombifrons took place we used
neutral microsatellite markers. These enable us to study the geographical origin of S. bombifrons
as well as the route of its range expansion. Microsatellites- also referred to as short tandem
repeats (STRs) or simple sequence of repeats (SSRs) -are sequences of repetitive non-coding
DNA (2-6 bases long) that are useful genetic markers. Their usefulness comes from the fact that
they show high levels of variation among populations because microsatellite loci are
characterized by high mutation rates (Hardy et al. 2003). Mutations increase or decrease the
number of repeats at a specific locus and therefore contribute to the number of alleles in a
population. In fact, the high polymorphism of microsatellites make them sensitive to changes in
gene flow and effective population size, which can be used to track a range expansion
(Rodrigáñez et al. 2008).
In a range expansion, the expanding populations are expected to contain lower levels of
genetic variation and higher levels of genetic difference with the source population due to serial
founder effects and genetic drift (Eckert et al. 2008, Slatkin and Excoffier 2012). Taking this into
consideration, we measured the fraction of individuals carrying two different alleles
(heterozygosity), the level of difference between alleles (genetic diversity), and the average
number of alleles (allelic richness) of each population in order to track the range expansion of S.
bombifrons. In addition, we used specialized software to measure visualize the effects of
hybridization. The results of this research will shed light on a novel way in which species can
Methods
Spade Foot Toad Collections
For this study we obtained 207 samples of S. bombifrons from 20 locations across the
central and southwest United States (Fig. 1).We analyzed samples of S. bombifrons populations
living towards the northern range (Purdum, NE (n = 18); Twin Starts, NE (n = 8);Limon, CO
(n = 15); Burlington, CO (n = 6); Last Chance (n = 20); Finney, KS (n = 7); Johnson County, KS
(n = 6) ), the center range (Payne, OK (n = 7); Ellis, OK (n = 10); Roger Mills, OK (n = 11);
Cimarron County, OK (n= 8) ), and towards the southern range populations (Amarillo, TX
(n = 13); Hereford, TX (n = 5); Springlake, TX (n = 15); Arnett, TX (n = 6); Kermit, TX
(n = 12); Falfurrias, TX (n = 3): Sulphur Draw, AZ (n = 11); Shrimp, AZ (n = 14); Zent, AZ
(n = 12) ) (Fig. 1). Our samples from Johnson County, KS were provided by the University of
Kansas Natural History Museum; the ones from Cimarron County, OK and Ellis County, OK
were provided by the Sam Noble Oklahoma Museum of Natural History; the ones from Finney
County, KS were from Fort Hayes State; and the rest were obtained from Dr. Karin Pfennig’s
collections. Additionally, we obtained 67 S. multiplicata samples from 4 locations across
Arizona from Dr. Karin Pfennig’s collections.
Genetic work
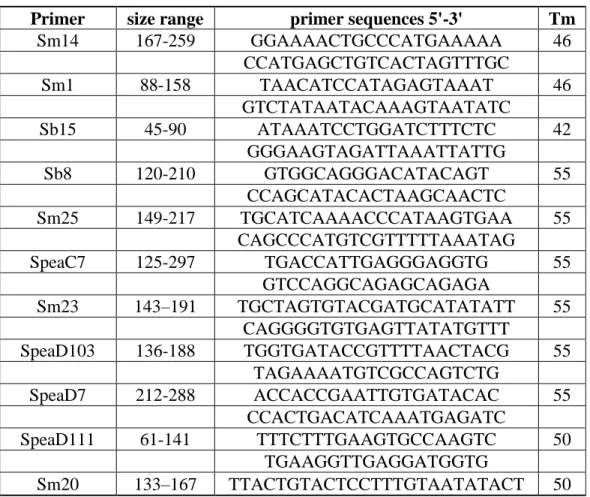
We used 10 polymorphic microsatellite markers to genotype each of our samples (Table
A1). For PCR, genomic DNA was extracted from toe clips using the DNeasy Blood and Tissue
Kit from Qiagen (Valencia, CA, USA) and quantified using a Nanodrop 2000. PCR was carried
out in 15 μL multiplex reactions using the Type-It Microsatellite PCR kit (Qiagen). Each
reaction contained 0.2 μM of each primer and 20–50 ng DNA template. Thermal cycling
reactions for multiplex amplifications consisted of an initial 5 min at 95 C, followed by 28 cycles
Gutierrez et al., page 6
final step of 30 min at 60 C was included to complete any partial polymerizations. Amplified
DNA was genotyped on a 3730XL sequencing machine at Eton Bioscience (Research Triangle
Park, NC) and alleles were scored using Genemarker v.2.6.3 (SoftGenetics LLC., State College,
PA, USA).
Microsatellite analysis
We determined the genotype of each of the toads at each of the 10 microsatellite loci.
Subsequently, we used the software Arlequin v 3.5 (Excoffier and Lischer 2010) to calculate
observed heterozygosity in each of the 20 locations that we analyzed. Additionally we calculated
the observed and expected heterozygosity for all of our sampling locations and calculate
deviation from Hardy Weinberg equilibrium for each locus in each population. Additionally, we
used Arlequin v 3.5 to calculate FST and RST, which are genetic distance values, in order to
measure genetic differentiation between toad populations. In this analysis levels of 0 indicate that
individuals are from the same population, and levels higher than zero indicate that the two
individuals genetically differentiated.
Figure 1. Map showing the location where
S. bombifrons (grey area) and S.
multiplicata (dark area) reside, and where
they coexist in sympatry (dashed area).
Points represent collection sites of S.
bombifrons, and labels describe the name
assigned to the collection sites based on
Population Genetic Analysis
In order to obtain a clear visualization of the population structure of S. bombifrons , we
used the software STRUCTURE v. 2.3.3 (Pritchard et al. 2000) and implemented 100 000
burn-ins and 200 000 Markov Chain Monte Carlo runs after the burn-in. We used an admixture model
with uncorrelated allele frequencies to avoid the risk of overestimating the number of
populations and used the LOCPRIOR model to provide the software with location information
for each toad to ensure the detection of subtle population structure. We started simulations with
K 1-18, to reflect the 18 sampling locations, and then ran simulations for K values of 18 through
1. For each K, we ran 10 simulations to check for consistency between runs, and used the log
likelihood (Pritchard et al. 2000) and delta K method (Evanno et al. 2005) to determine the most
likely number of genetic populations. Furthermore, we repeated the process after including 4 S.
multiplicata samples and therefore ran simulations for K values of 22 through 1.
To identify the possible routes of dispersal, we utilized toads from each location and used
Poptools (Hood 2011) to standardize sample size among the collection sites (n=7) before
comparing the relative levels of genetic diversity (using the value 1-Qinter, the inter-individual
diversity within populations), which were measured using Genepop version 4.1.0. We also
calculated allelic richness, which is the average number of alleles in the selected locus, using
ADZE-1.0 (Rousset 2008), which utilizes a rarefaction approach to account for differences in
sample size. Locations with fewer than 7 samples were excluded from these analyses, and
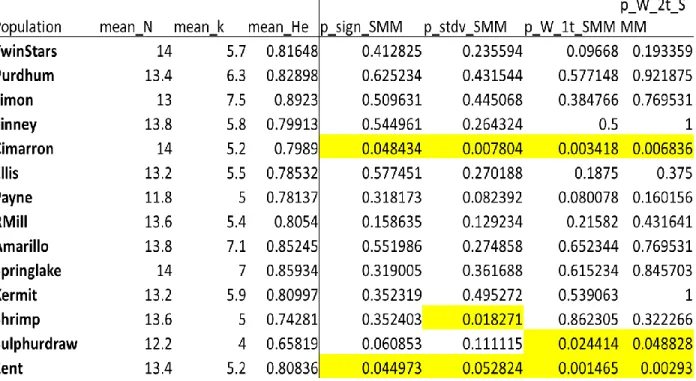
therefore Hereford, TX, Arnett, TX, and Burlington, CO were excluded. To test if a recent
population bottleneck occurred, we used the program Bottleneck (Piry et al. 1999).
Results
Gutierrez et al., page 8
To study the range expansion of S. bombifrons we used 10 microsatellites to measure the
levels of heterozygosity, genetic diversity, and allelic richness among the different locations.
The heterozygosity analysis performed yielded that there is high levels of heterozygosity among
all tested populations, and not one of the populations is significantly different from the other
(Fig. 2A). Similarly, the genetic diversity analysis also showed high levels of genetic diversity
among all populations and did not point to any significantly different location (Figure 2B). On
the other hand, allelic richness analysis showed that the northern location of Purdum, NE and the
southern locations of Shrimp, AZ and Zent, AZ had a significantly (p < 0.05) lower level of
allelic richness than the rest of the populations (Fig. 2C).
Figure 2. Levels of (A) heterozygosity, (B) genetic diversity, and (C) allelic richness measured
using 10 microsatellite markers among populations from the 20 different collection sites in order
from the most northern to the most southern location.
A
B
r
c
o
r
r
(l
a
ti
t
u
d
e
,
m
a
l
e
s
h
a
p
e
)
FST and RST Values
FST and RST values were calculated using the microsatellite data in order to identify how
genetically distant was each population from the other (Table A3). The trend seen here is
consistent with the idea of a colonization event that started in the center region, as it shows larger
difference with the southern than center regions. Furthermore, the northern and center regions
we found to be genetically similar to each other. However, there is a high level of genetic
difference between the rest of the range and the locations within Arizona. Additionally,
regardless of the fact that most of the Arizona locations are a short distance away from each
other, we additionally see significant levels of differentiation among those locations. This is
especially striking given the genetic similarities in the rest of the range. In fact, the populations
of Shrimp, AZ, Zent, AZ and Sulphur Draw, AZ are significantly different from one another (p <
0.05) while being less than 8 Km away from each other. A hypothesis is that this high level of
differentiation among the northern populations of S. bombifrons, which are the ones living in
close proximity to S. multiplicata, is due to a novel source of new allelic variation.
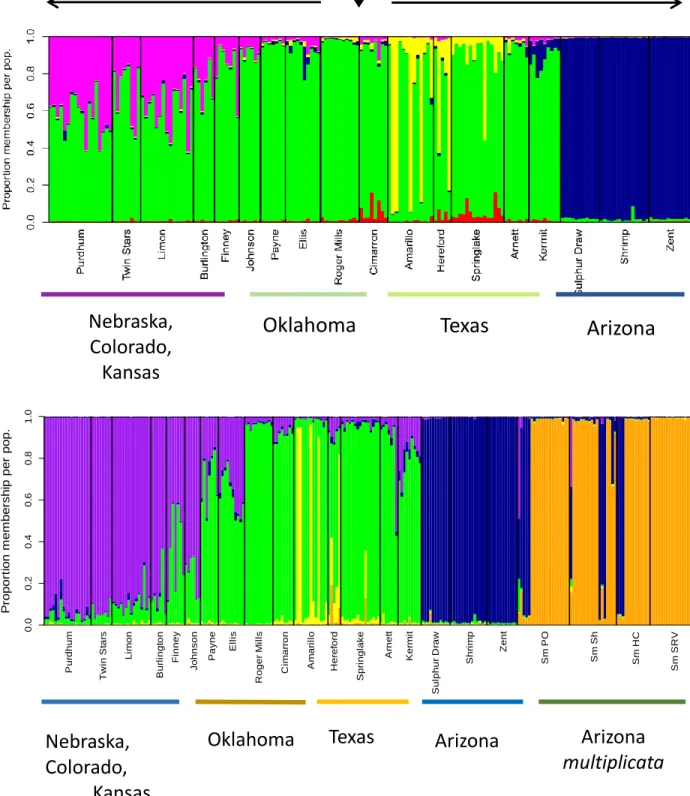
S. bombifrons Structure Analysis
We used the software STRUTURE to visualize the distinct characteristics of the
population structure of S. bombifrons (Fig. 3A). STRUCTURE analyses pointed to the existence
of 4 genetically distinct S. bombifrons populations, which included the
Nebraska-Colorado-Kansas, Oklahoma, Texas, and Arizona populations. The locations in the north showcased a
higher level of genetic differentiation moving northward. This is seen as the proportion of
membership to the Oklahoma population (green) decreases and the proportion of membership to
the Nebraska-Colorado-Kansas population (pink) increases moving northward across sample
Gutierrez et al., page 10
the other hand, the southern collection sites showcased an unusual structural organization (Fig.
3A). Instead of obtaining the trend observed in the north of a gradual progression of genetic
differetiation towards the edge of the range, in the southwest we see a sudden change towards the
Arizona population (dark blue). These results reveal that there are multiple unusual factors
influencing the southward range expansion of S. bombifrons.
Testing for Hybridization Using Structure Analysis
In order to decipher whether the hybridization of S. bombifrons with its closely related
species S.multiplicata played a role in its southern expansion we created a structure plot
containing 18 S. bombifrons and 4 S.multiplicata sample sites (Fig. 3B). This plot reaffirmed the
previous S. bombifrons population structure findings. Importantly, it supports the idea of gene
flow between the southern S. bombifrons (Sulphur Draw, AZ, Shrimp, AZ, and Zent, AZ) and
the Arizona S.multiplicata population. This can be visualized by identifying traces of the
Arizona S. bombifrons populations (purple) in the Arizona S.multiplicata populations.
Importantly, we see this trend happening within the S. multplicata populations PO, HC, and Sh,
which are all in sympatry with S. bombifrons. This provides evidence of hybridization and gene
Arizona
multiplicata
Fig. 3. Structure plotshowing (A) 4 distinct populations along the range of S. bombifrons and
(B) 5 distinct populations along the range of S. bombifrons and S.multiplicata. Each color is
representative of a distinct population composed of similar genetic characteristics. The x-axis contains each of the sampling locations organized from north to south and the lines on the top
represent the believed directions of the range expansion of S. bombifrons (northward and
southward from the center region). The y-axis denotes proportions of each of the locations that pertain to either one of the distinct populations. The gradual change of one color towards another is a classic representation of a range expansion, as the further a species move from the
Arizona
Texas
Oklahoma
Nebraska,
Colorado,
Kansas
Arizona
multiplicata
Arizona
Texas
Oklahoma
P ro p o rt io n m e m b e rsh ip p e r p o p . 0 .0 0 .2 0 .4 0 .6 0 .8 1 .0 P u rd h u m T w in S ta rs L im o n B u rl in g to n F in n e y Jo h n so n P a yn e E ll is R o g e r M il ls C im a rr o n A m a ri ll o H e re fo rd S p ri n g la ke A rn e tt K e rm it S u lp h u r D ra w S h ri m p Z e n t S m P O S m S h S m H C S m S R VNebraska,
Colorado,
Kansas
Gutierrez et al., page 12
Discussion
The Northern Expansion
Based on a strong body of evidence obtained by our results we are able to paint an image
of how S. bombifrons expanded its range northward and southward from the central region of the
United States. Their expansion to the north is evident from results of the structure plot, as it
shows a greater level of genetic specification as the distance from the center range increases
northward (Fig. 3). In fact, this suggests that even though the northern populations originated
from the center of the range, they are now becoming distinctly different. However, this is not an
indication that they are completely isolated from their origin of expansion, as heterozygosity and
genetic diversity levels remain high among all populations, and FST/RST values through the north
and central regions indicate that the populations remain genetically similar (Fig. 2A&B, Table
A3). This suggests that there is still a mechanism in which new alleles are being carried out
throughout the range that helps to maintain a high level of genetic diversity. A promising
hypothesis for the maintenance of high levels of gene flow across a vast range is the possibility
that the rivers help transport eggs, tadpoles or the toads themselves across the range as seen in
the Lower Solimes River (Schiesari et al. 2003). Nevertheless, the effect of being at the range
edge in the north was identified in the population of Purdum, NE, as it contains a significantly
lower (p < 0.05) level of allelic than the other locations. This is unlikely to have been due to
bottleneck effects, as testing did not confirm this, and may therefore be due to genetic drift or the
lack of sufficient gene flow (Table A2). In general, the northern expansion of S. bombifrons
happened through multiple colonization events that allowed room for the maintenance of gene
The Southern Expansion
The mechanisms in S. bombifrons was able to expand southward were more complicated
because to do so it had confront the harsh realities of becoming a desert amphibian. The structure
plot in this case shows the effects of the harsher environment by showcasing that the Arizona
populations towards the most northern part of the range are highly differentiated from the other
populations. This fact is further proven by the FST/RST data showing the great genetic differences
between closely located populations in the Arizona area (Table A3). In addition this
specialization was proven to be influenced by bottleneck events, which can be due to the extreme
weather condition allowing only limited amount of alleles to survive (Table A2). This is also
showcased in the fact that 2 of the most southern populations (Shrimp, AZ and Zent, AZ) had
significantly lower (p < 0.05) allelic richness than the other populations. However, it is
interesting that regardless of limitations on diversity placed by the harsh weather in the desert
areas, our results showed that the Arizona populations still maintained high levels of
heterozygosity and genetic diversity. In fact, this high level of genetic diversity may be
maintained by the hybridization of S. bombifrons with S.multiplicata. Moreover, the structure
plot that included the 4 S. multiplicata samples also pointed to the existence of hybridization by
showcasing high levels genetic similarities between the S. bombifrons with certain S.
multiplicata individuals in sympatric populations. Therefore, it can be concluded that our initial
hypothesis is supported and hybridization is occurring and affecting the population genetics of
these species. Future work can be done to examine how these genetic differences may impact
traits relevant to range expansion and desert adaptation, such as dispersal abilities or
Gutierrez et al., page 14
References
Banbury, B., and A. M. Maglia. 2006. Skeletal development of the mexican spadefoot, Spea multiplicata (Anura: Pelobatidae). Journal of Morphology 267:803–821.
Brussard, P. F. 1984. Geographic patterns and environmental gradients: the central-marginal model in drosophila revisited. Annual Review of Ecology and Systematics 15:25–64.
Chunco, A. J., T. Jobe, and K. S. Pfennig. 2012. Why do species co-occur? A test of alternative hypotheses describing abiotic differences in sympatry versus allopatry using spadefoot toads. PloS one 7:e32748.
Colautti, R. I., and S. C. H. Barrett. 2013. Rapid adaptation to climate facilitates range expansion of an invasive plant. Science (New York, N.Y.) 342:364–6.
Eckert, C. G., K. E. Samis, and S. C. Lougheed. 2008. Genetic variation across species’ geographic ranges: the central-marginal hypothesis and beyond. Molecular Ecology 17:1170–1188.
Edmonds, C. A., A. S. Lillie, and L. L. Cavalli-Sforza. 2004. Mutations arising in the wave front of an expanding population. Proceedings of the National Academy of Sciences of the United States of America 101 :975–979.
Evanno, G., S. Regnaut, and J. Goudet. 2005. Detecting the number of clusters of individuals using the software STRUCTURE: A simulation study. Molecular Ecology 14:2611–2620.
Excoffier, L., and H. E. L. Lischer. 2010. Arlequin suite ver 3.5: A new series of programs to perform population genetics analyses under Linux and Windows. Molecular Ecology Resources 10:564–567.
Gaston, K. J. 2003. The Structure and Dynamics of Geographic Ranges. Oxford Series in Ecology and Evolution.
Minelli, A. (2005). Biodiversity: Species and species ranges. Diversity and Distributions, 361- 361.
Stebbins RC (1985). A field guide to western reptiles and amphibians: Field marks of all species in western North America, including Baja California. Boston, MA: Houghton Mifflin Company. 336.
Hardie, D. C., and J. a. Hutchings. 2010. Evolutionary ecology at the extremes of species’ ranges. Environmental Reviews 18:1–20.
Hardy, O. J., N. Charbonnel, H. Fréville, and M. Heuertz. 2003. Microsatellite allele sizes: A simple test to assess their significance on genetic differentiation. Genetics 163:1467–1482.
Holsinger, K. E., and B. S. Weir. 2009. Genetics in geographically structured populations: defining, estimating and interpreting F(ST). Nature reviews. Genetics 10:639–650.
O’Dowd, D. J., P. T. Green, and P. S. Lake. 2003. Invasional “meltdown” on an oceanic island. Ecology Letters 6:812–817.
Parmesan, C., and G. Yohe. 2003. A globally coherent fingerprint of climate change impacts across natural systems. Nature 421:37–42.
Pfennig, K. S. 2007. Facultative mate choice drives adaptive hybridization. Science (New York, N.Y.) 318:965–967.
Piry, S., G. Luikart, and J.-M. Cornuet. 1999. BOTTLENECK: a program for detecting recent effective population size reductions from allele data frequencies. Journal of Heredity 90:502–503.
Pritchard, J. K., M. Stephens, and P. Donnelly. 2000. Inference of population structure using multilocus genotype data. Genetics 155:945–59.
Rhymer, J. M., and D. Simberloff. 1996. Extinction By Hybridization and Introgression. Annual Review of Ecology and Systematics 27:83–109.
Rodrigáñez, J., C. Barragán, E. Alves, C. Gortázar, M. A. Toro, and L. Silió. 2008. Genetic diversity and allelic richness in Spanish wild and domestic pig population estimated from microsatellite markers. Spanish Journal of Agricultural Research 6:107–115.
Rousset, F. 2008. GENEPOP’007: A complete re-implementation of the GENEPOP software for Windows and Linux. Molecular Ecology Resources 8:103–106.
Sexton, J. P., P. J. McIntyre, A. L. Angert, and K. J. Rice. 2009. Evolution and Ecology of Species Range Limits. Annual Review of Ecology, Evolution, and Systematics 40:415–436.
Sexton, J. P., S. Y. Strauss, and K. J. Rice. 2011. Gene flow increases fitness at the warm edge of a species’ range. Proceedings of the National Academy of Sciences of the United States of America 108:11704–11709.
Slatkin, M. 1995. A measure of population subdivision based on microsatelite allele frequencies. Genetics 139:457–462.
Slatkin, M., and L. Excoffier. 2012. Serial founder effects during range expansion: A spatial analog of genetic drift. Genetics 191:171–181.
Stearns, S. C., and R. D. Sage. 1980. Maladaptation in a marginal population of the mosquito
fish, Gambusia affinis. Evolution 34:65–75.
Szpiech, Z. A., M. Jakobsson, and N. A. Rosenberg. 2008. ADZE: a rarefaction approach for counting alleles private to combinations of populations. Bioinformatics 24:2498–2504.
Whitney, K. D., and C. a. Gabler. 2008. Rapid evolution in introduced species, “invasive traits” and recipient communities: Challenges for predicting invasive potential. Diversity and Distributions 14:569–580.
Gutierrez et al., page 16
Appendix
Table A1. Microsatellite primer sequences used in the study, together with their name, size range and the annealing temperature used to conduct PCR.
Primer size range primer sequences 5'-3' Tm
Sm14 167-259 GGAAAACTGCCCATGAAAAA 46
CCATGAGCTGTCACTAGTTTGC
Sm1 88-158 TAACATCCATAGAGTAAAT 46
GTCTATAATACAAAGTAATATC
Sb15 45-90 ATAAATCCTGGATCTTTCTC 42
GGGAAGTAGATTAAATTATTG
Sb8 120-210 GTGGCAGGGACATACAGT 55
CCAGCATACACTAAGCAACTC
Sm25 149-217 TGCATCAAAACCCATAAGTGAA 55
CAGCCCATGTCGTTTTTAAATAG
SpeaC7 125-297 TGACCATTGAGGGAGGTG 55
GTCCAGGCAGAGCAGAGA
Sm23 143–191 TGCTAGTGTACGATGCATATATT 55
CAGGGGTGTGAGTTATATGTTT
SpeaD103 136-188 TGGTGATACCGTTTTAACTACG 55
TAGAAAATGTCGCCAGTCTG
SpeaD7 212-288 ACCACCGAATTGTGATACAC 55
CCACTGACATCAAATGAGATC
SpeaD111 61-141 TTTCTTTGAAGTGCCAAGTC 50
TGAAGGTTGAGGATGGTG
Gutierrez et al., page 18
Table A3. Calculated RST and FST values. Highlighted sections mean significantly different
populations (p < 0.05).
Location Purdham TwinStars Limon Burlington Finney KU Payne Cimmaron Ellis RMills Kermit Arnett Amarillo HE Springlake Fulfurria SulphurDraw Shrimp TwinStars RST: 0.01323
FST: 0.03079
Limon RST: 0.04064RST: 0.1119
FST: 0.01625FST: -0.00886
Burlington RST: 0.03266RST: -0.04992RST: 0.12782
FST: 0.00782FST: 0.0121 FST: -0.00618
Finney RST: -0.00415RST: -0.01155RST: 0.1268 RST: -0.03385
FST: 0.05919FST: 0.02889FST: 0.02276FST: 0.03036
KU RST: 0.02449RST: -0.04759RST: 0.06652RST: -0.02611RST: 0.05176
FST: 0.05447FST: 0.03845FST: 0.02317FST: 0.04285FST: 0.0394
Payne RST: 0.01001RST: -0.00417RST: 0.0429 RST: 0.00076RST: 0.10573RST: 0.07178
FST: 0.00345FST: 0.00501FST: -0.00006FST: 0.00784FST: 0.04065FST: 0.03215
Cimarron RST: 0.06691RST: -0.00643RST: 0.08983RST: 0.03603RST: 0.13481RST: -0.02649RST: 0.06161
FST: 0.06546FST: 0.0362 FST: 0.03446FST: 0.03938FST: 0.04349FST: 0.03492FST: 0.01697
Ellis RST: 0.03012RST: 0.12038RST: 0.01754RST: 0.1468 RST: 0.13607RST: 0.11843RST: 0.04202RST: 0.10869
FST: 0.03974FST: 0.00138FST: 0.0041 FST: 0.00898FST: 0.01694FST: 0.02857FST: -0.00097FST: 0.01949
RMill RST: 0.0405 RST: 0.13198RST: -0.00298RST: 0.03603RST: 0.14138RST: 0.14216RST: 0.04919RST: 0.13644RST: -0.01583
FST: 0.04365FST: 0.01435FST: 0.01188FST: 0.01809FST: 0.01444FST: 0.02512FST: -0.01014FST: 0.01676FST: -0.00349
Kermit RST: 0.07651RST: 0.16587RST: 0.01571RST: 0.14889RST: 0.25874RST: 0.19392RST: 0.13178RST: 0.14555RST: -0.02389RST: 0.03689
FST: 0.04646FST: 0.0282 FST: 0.01236FST: 0.00175FST: 0.05299FST: 0.04564FST: 0.01413FST: 0.01434FST: 0.01472FST: 0.0137
Arnett RST: 0.12577RST: 0.21692RST: 0.09845RST: 0.14762RST: 0.32182RST: 0.29553RST: 0.24509RST: 0.26842RST: 0.04012RST: 0.15377RST: 0.02506
FST: 0.04069FST: 0.03709FST: 0.03184FST: 0.03624FST: 0.03328FST: 0.07521FST: 0.02224FST: 0.05377FST: 0.00905FST: 0.0144 FST: 0.02765
Amarillo RST: 0.10628RST: 0.16604RST: 0.09725RST: 0.19665RST: 0.22802RST: 0.18287RST: 0.02709RST: 0.1097 RST: 0.03466RST: 0.07197RST: 0.00127RST: 0.05441
FST: 0.06047FST: 0.03798FST: 0.04497FST: 0.03778FST: 0.05882FST: 0.07159FST: 0.01052FST: 0.04376FST: 0.02779FST: 0.02045FST: 0.02876FST: 0.03859
HE RST: 0.01928RST: 0.03938RST: -0.02845RST: 0.19665RST: 0.11306RST: 0.08117RST: -0.069 RST: 0.05267RST: -0.07139RST: -0.04127RST: -0.05148RST: -0.00282RST: -0.06761
FST: 0.0342 FST: 0.04632FST: 0.01504FST: 0.02244FST: 0.02374FST: 0.04723FST: 0.033 FST: 0.02511FST: 0.02303FST: -0.00842FST: 0.03259FST: 0.04208FST: 0.00747
Springlake RST: 0.05121RST: 0.08977RST: 0.00662RST: 0.11726RST: 0.13208RST: 0.05985RST: 0.0176 RST: 0.04014RST: -0.00565RST: 0.00841RST: -0.03233RST: 0.02679RST: -0.01033RST: -0.04772
FST: 0.06127FST: 0.02171FST: 0.0236 FST: 0.02247FST: 0.03631FST: 0.0529 FST: 0.01444FST: 0.03119FST: 0.00974FST: -0.00461FST: 0.01772FST: 0.03505FST: 0.01329FST: -0.00422
Fulfurria RST: -0.01058RST: -0.07358RST: -0.06033RST: -0.14883RST: 0.12708RST: 0.00782RST: -0.10696RST: 0.00944RST: -0.02681RST: 0.01874RST: 0.07091RST: 0.16216RST: -0.02216RST: -0.08828RST: -0.09743
FST: 0.16658FST: 0.1404 FST: 0.12808FST: 0.17241FST: 0.1105 FST: 0.13088FST: 0.19149FST: 0.14602FST: 0.11931FST: 0.08686FST: 0.15298FST: 0.18078FST: 0.13824FST: 0.09032FST: 0.10979
Sulphurdraw RST: 0.13256RST: 0.22958RST: 0.10982RST: 0.12886RST: 0.14437RST: 0.17115RST: 0.11912RST: 0.12425RST: 0.12643RST: 0.11883RST: 0.10436RST: 0.15075RST: 0.09866RST: 0.10267RST: 0.11983RST: 0.23378
FST: 0.13256FST: 0.13752FST: 0.10982FST: 0.12886FST: 0.14437FST: 0.17115FST: 0.11912FST: 0.12425FST: 0.12643FST: 0.11883FST: 0.10436FST: 0.15075FST: 0.09866FST: 0.10267FST: 0.11983FST: 0.23378
Shrimp RST: 0.13122RST: 0.277 RST: 0.10117RST: 0.12668RST: 0.14104RST: 0.14749RST: 0.09633RST: 0.13092RST: 0.11359RST: 0.10315RST: 0.10421RST: 0.13442RST: 0.08931RST: 0.09111RST: 0.15732RST: 0.21037RST: 0.08139
FST: 0.13122FST: 0.12593FST: 0.10117FST: 0.12668FST: 0.14104FST: 0.14749FST: 0.09633FST: 0.13092FST: 0.11359FST: 0.10315FST: 0.10421FST: 0.13442FST: 0.08931FST: 0.09111FST: 0.10615FST: 0.21037FST: 0.08139
Zent RST: 0.17988RST: 0.30303RST: 0.22511RST: 0.30645RST: 0.38607RST: 0.39972RST: 0.22368RST: 0.33609RST: 0.13286RST: 0.22211RST: 0.13037RST: 0.15833RST: 0.05588RST: 0.10342RST: 0.12009RST: 0.29093RST: 0.12734RST: 0.0014