Government agencies use program evaluations as a
means for improving and justifying the existence of
programs. This evaluation will be used to improve the
Coast Guard waterfront facility inspection program. This
evaluation was deemed necessary by the program manager
upon recognition that program guidance was too limited and
failed to reflect the current program roles and missions
stated in the Port Safety and Security Operating Program
Plan. The outputs desired from this evaluation were
recommendations which could be used in developing program
policies, guidance and standards and a recommendation on
the feasibility of using this evaluation methodology for
future Coast Guard program evaluations.
In conducting this evaluation, past program
evaluations were examined; current program policies,
guidance and standards were reviewed; and selected program
field participants were interviewed and observed. These
findings conclude that: the waterfront facility program
is a low priority Coast Guard program; there are no
outside agencies able or willing to assist the Coast Guard
in implementing the waterfront facility inspection
facilities; and there are no output measures for the
waterfront facility program.
The methodology used in this evaluation was adequate but it should be slightly modified before using it to
evaluate other Coast Guard programs. Based on the
research findings, recommendations were made to change
some federal regulations and portions of the waterfront
facility program. The most important program
recommendation of this evaluation was to establish program output measures. Without output measures, it is
Pacfe
LIST OF TABLES... vi
LIST OF FIGURES ... vii
ACKNOWLEDGEMENTS ... viii
I. INTRODUCTION ... 1
II. LITERATURE REVIEW ... 3
Evaluation Methodology ... 3
Legislative Background ... 11
USCG Organization ... 14
Federal, State and Industry Roles ... 21
Trends and Databases ... 28
III. RESEARCH METHODS ... 41
Nature of Evaluation ... 41
Evaluation Design and Strategy ... 44
Strengths and Weaknesses of the Design... 48
IV. RESEARCH FINDINGS AND DISCUSSION ... 50
Methodology ... 50
Field Office Interviews ... 51
Industry Interviews ... ... 61
Program Training ... 62
Statistical Analysis ... 63
V. CONCLUSIONS AND RECOMMENDATIONS ... 68
General Conclusions ... 68
Recommendations ... 70
BIBLIOGRAPHY ... 72
APPENDIX A... 74
APPENDIX B ... 76
APPENDIX C ... 95
APPENDIX D ... 101
APPENDIX E ... 136
APPENDIX F ... 153
APPENDIX G ... 165
APPENDIX H ... 181
APPENDIX I ... 198
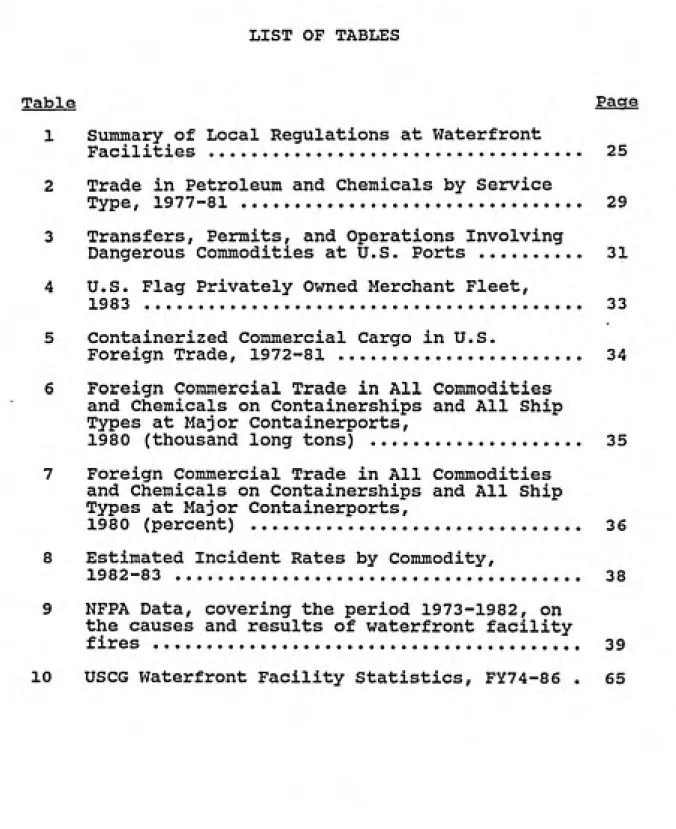
Table Pacfe
1 Summary of Local Regulations at Waterfront
Facilities ... 25
2 Trade in Petroleum and Chemicals by Service
Type, 1977-81 ... 29
3 Transfers, Permits, and Operations Involving
Dangerous Commodities at U.S. Ports ... 31 4 U.S. Flag Privately Owned Merchant Fleet,
1983 ... 33 5 Containerized Commercial Cargo in U.S.
Foreign Trade, 1972-81 ... 34 6 Foreign Commercial Trade in All Commodities
and Chemicals on Containerships and All Ship Types at Major Containerports,
1980 (thousand long tons) ... 35
7 Foreign Commercial Trade in All Commodities
and Chemicals on Containerships and All Ship
Types at Major Containerports,
1980 (percent) ... 36
8 Estimated Incident Rates by Commodity,
1982-83 ... 38
9 NFPA Data, covering the period 1973-1982, on the causes and results of waterfront facility
fires ... 39 10 USCG Waterfront Facility Statistics, FY74-86 . 65
Figure Page 1 Coast Guard Organization ... 15
2 Typical Marine Safety Office Organization... 17
3 Schedule of Events... 43I would like to thank the following people for their
contributions to this thesis.
Professors Morris A. Shiffman, Alvis G. Turner, Jr.,
Milton S. Health, Jr., and Richard N.L. Andrews for their
thoughtful guidance, review, and comments on all phases of this work.
Lieutenant David G. Westerholm for his encouragement
and his substantial efforts to provide statistical
analyses and reference materials.
Lieutenant Commander Clayton W. Evans for his efforts
to provide reference materials and liaison with different
offices within the Coast Guard.
Those members of the Coast Guard and various
corporations for their valuable time and information.
Donna C. Simmons for her patience and understanding.
Two of the U.S. Coast Guard's (USCG) mission areas are
port safety and marine environmental protection. The
USCG's waterfront facility inspection program deals with
both issues and is the focus of this evaluation. Theprimary goal of this program is to reduce the incidence
and magnitude of fires, explosions or other serious
casualties on designated waterfront facilities.
It is common for government agencies and non-profit
service organizations to conduct program evaluations.
This paper proposes an evaluation methodology for the
Coast Guard's waterfront facility inspection program and
presents the findings of the evaluation. The evaluation
will address the following:1. Are the objectives of the program being
accomplished?
2. Will the current regulations and inspection program
effectively deal with the issues of the future?
3. Are USCG resources being used efficiently?
4. Are other agencies available and willing to assist
in administering the program?
7. Should the program be continued?
In the Coast Guard's no growth environment, all
programs are competing for scarce resources. Program
evaluations are important to policy makers and programmanagers because they assess the effectiveness of an on¬
going program, identify the effects of a program, and aid
in program improvement. They also provide justification
when budget priorities are made.
Problems with the waterfront facility program have been recognized for at least a decade. Several proposed
revisions to the waterfront facility regulations were
introduced between 1977 and 1982 but none of these wereimplemented. Another working group has been started and
this evaluation will be considered when the applicable
regulations and policies are updated.The overall objective of this report is to evaluate
the waterfront facility inspection program, identify
problem areas, and make recommendations to improve the
quality of the program. In reaching the final objective,
several evaluation methodologies were examined and one was
selected. The effectiveness of this methodology will be
assessed for its possible use in future evaluations of
Evaluation Methodolocfv
Program evaluation combines an evaluation method and
experience with a program to determine the effectiveness
of a program's activities. The primary purpose of
evaluation is to provide objective information on thecosts and effects of a program so program managers and
policy makers can effectively manage and allocate scarce
resources. Evaluation findings are also used to provide
feedback on the results of past decisions, reshape similar
programs and upgrade programs (Wholey et al., 1970).Profit-oriented companies can easily measure success, but non-profit service organizations and government
agencies have difficulty measuring their "product's"
success. This difficulty does not lessen the importance
of determining the quality of their programs. Programevaluations have become a common tool used by non-profit
organization and government agencies to determine if the
target population is benefiting from their programs and to
improve their programs (Posavac et al., 1980).evaluations seek to improve services, raise outcomes and
increase efficiency. Summative evaluations determine
whether or not a program should be started or continued.
Questions asked of a program during an evaluation are (1)
does the program meet the needs of the community (need)?;
(2) is the program operating as designed and serving the
target population (process)?; (3) are there positive
effects from the program that are measurable (outcome)?;
and (4) is the objective of the program being achieved at
a reasonable cost (efficiency)? (Posavac et al., 1980).
Wholey identifies four types of evaluations. Program
impact evaluations assess the overall effectiveness of a
national program in meeting its objectives. They are
designed to assist in decisions on funding levels or
redirection of a program. These evaluations depend on the
availability of appropriate output variables. They are
feasible for all programs but are probably best suited for
comparing two programs. Program strategy evaluations
assess the relative effectiveness of different techniques
used in a national program. These are the most difficult
and costly type of evaluation for on-going programs.
Program strategy evaluations depend on measurement of the
appropriate environmental, input, process, and output
variables. These are more feasible for evaluating
individual projects in obtaining their objectives. These
evaluations require the measurement of output variables
and use comparison groups. The last type of evaluation
identified by Wholey is a project rating evaluation. This
evaluation assesses the relative effectiveness ofdifferent local projects within a national program in
achieving program objectives.Posavac and Beigel (Beigel et al., 1975) offer another
approach, simple and inexpensive program evaluation.
In-depth evaluation of any program cannot be done until
management adequately defines the program, the population
to be served, and the programmatic effects desired; and
establishes a useful database for data collection andstatistical analysis (Beigel et al., 1975). These goals
can be met effectively by a simple evaluation that
carefully selects the information to be gathered (Beigel
et al., 1975). Two examples of simple evaluations are a
test design and a pretest-test design. A
post-test design is the simplest form of program evaluation and
it reports on how well the participants function at the
end of a program and how close they came to meeting the
minimum output standards. A pretest-post-test design will
do everything in a post-test design plus indicate the
change between the start and the end of a program. A
Three activities closely related to evaluations are
monitoring, reporting systems and cost analysis. These
activities differ from evaluations because they focus only
on program inputs. Monitoring is the documentation of the
effort being put into a program. The usual objectives of
monitoring are to give program managers a broad view of a
program and indicate whether staff personnel are competent
and acting within program guidelines. Reporting systems
which generate routine reports provide program managers
with important data on services provided, populations
served and costs of providing services. Comparative cost
analysis of similar projects or programs is a way of
obtaining information when measurement of benefits is
difficult. These activities are not evaluations but
provide program managers with valuable management tools
(Wholey et al., 1970).
Wholey introduces two alternatives to evaluations of
on-going programs, comparable evaluations of two groups
and experimental demonstrations. In comparable
evaluations, the treatment and control groups are randomly
selected, the input and process variables are controlled,
and then the input, process and output variables are
carefully measured. Experimental demonstrations use
input, process and output variables are carefully
measured. These evaluation designs are ideally conducted
prior to implementing the operating program.
The evaluator plays an important role in the
evaluation process and will usually come from within the
organization (in-house) or from a private firm
(consultant). The advantages for using one will usually
be disadvantages for using the other. In-house evaluators
will normally know more about the organization and may
find it easier to ask pertinent questions. They are more
likely to be sensitive to the program's needs and treated
as part of the team. This may help in getting more candid
answers and information. In-house evaluators will
probably have a greater desire to improve the
organization, thus, are better suited for formative
evaluations (Posavac et al., 1980).
Unlike in-house evaluators, consultants do not work
alone and will have an opportunity for helpful feedback
from their colleagues. Consultants are likely to have
greater technical skills than in-house evaluators and will
probably be more objective. Objectivity is important for
an evaluation's credibility. Although consultants can do
either formative or summative evaluations, they should be
the choice for summative evaluations because of their
an evaluation. The relevant people must be identified and
then assembled for a preliminary meeting. Several
questions must be asked and answered at this meeting. Why
is an evaluation desired? What type of an evaluation is
needed? When is the evaluation desired? What resourcesare available to conduct the evaluation? After answering
these questions, a decision must be made on whether or not
the evaluation will be done. After the decision to go
forward with an evaluation, the evaluator must review
previous evaluations of the program. These evaluations
should be examined to determine the methods used, the
statistical data used, the findings, and the issues not
addressed. The next step is to determine the methodology
of the current evaluation. The methodology will include a
strategy and design, the target population and sampling
procedures, methods for data collection, applicable
statistical analysis, and selection of measures. The
final step in planning the evaluation is for the evaluator
to present an evaluation proposal to the relevant people.
Successful evaluation of a program will only occur if
what happened as a result of the program can be isolated
from what would have happened anyway. This isolation of
program effect can be achieved only if there are clear
measures of program accomplishment (Wholey et al., 1970).
Posavac offers four types of measurement instruments.
provide the most information per evaluation hour. Survey
questions should be simple, clear and focused on one
issue. The more objective the information requested, the
higher the probability that responses will be valid
estimates of the issue. A rating system can be used as a
measurement instrument by comparing similar programs or
projects within a program and ranking them. An interview
is the third type of measurement instrument, but it is not
routinely used by evaluators because it is expensive (in
terms of information per evaluation hour). An effective
interview starts by making the respondent comfortable and
relaxed and is followed by clear, simple and direct
interrogatories. A letter or telephone call preceeding
the evaluator's visit may improve the respondent's
receptivity and minimize the time lost in preliminary
discussion. The fourth measurement instrument isbehavioral obseirvation. Posavac feels this approach may
have the greatest potential for providing valid
information. The evaluator is actually observing the
behavior expected to be changed and this produces an
evaluation with high credibility. When assessing the
validity of a measurement instrument, the evaluator must
consider if something important is being measured; if the
measure is sensitive to changes; if the measure is
Multiple sources of information is a characteristic of
a valid and useful evaluation. Considering only one
criterion may distort the findings and give an inaccurate
indication of a program's success (Posavac et al., 1980).
Wholey offers the following five categories of criteria
for measuring a program's success:
(1) effort - It assesses input only by measuring the
quantity of work.(2) effectiveness - It measures the results of
effort. The program must have a clear statement
of objectives to use this criterion.
(3) impact - It measures how close the effective
performance of a program comes to meeting the
needs of the target population.(4) cost effectiveness - This criterion represents a
ratio between effort and impact and can be used
in evaluating alternative methods in terms of
costs.
(5) process - It analyzes why a program produces its
results. It is qualitative in nature and
searches for negative and positive side-effects
of the program.
Program impact and strategy evaluations should produce
long-term and short-term measures of effectiveness.
Long-term measures, such as effectiveness, efficiency and
cost-effectiveness, are the true test for a program's success.
A program should be continually evaluated to ensure the
short-teirm measures are good indicators of the long-term
inspection program are: recording the number of facility
inspections conducted; recording the number of facility
surveys completed; and recording the number of facility
violations processed (Appendix I).
Wholey maintains that most federal programs fail
because there was no research and development prior to the
implementation of the program. To help overcome the lack
of research and development, Wholey recommends that
program management ask two questions. Has the program
manager specified the objectives of the program? Does the
program have activities that can be measured to indicate
whether or not the stated objectives are being met?
Lecfislative Background
The USCG is the federal agency with jurisdiction over
the navigable waters of the U.S., the coastal zone and the
Great Lakes. Authority for the USCG to regulate different
aspects pertaining to structures in the coastal zone
originates from the Espionage Act (1917), the Magnuson Act
(1950), Executive Order 10173 (1950), and the Ports and
Waterways Safety Act (1972). Other legislation pertaining
to marine environmental protection and giving the USCG
authority to act include the Port and Tanker Safety Act
(1978), the Clean Water Act (original version was FWPCA of
1972) , the Outer Continental Shelf Lands Act (1978) , the
Deepwater Port Act (1974), and the Comprehensive
1980, as amended (CERCLA). These laws encompass the
prevention and detection of accidental or intentional
discharges of oil, hazardous substances, pollutants and
contaminants into the environment. Under these laws, the
USCG is the federal agency which assures that discharges
into the coastal zone are cleaned up and that the
discharges are investigated and penalties are assessed
where appropriate.
The Magnuson Act (1950) authorized the President to
require the protection of U.S. harbors, ports, and waters
including all vessels and waterfront facilities, whenever
he finds the security of the U.S. to be endangered by
subversive activity. Executive Order 10173 (1950) was
issued pursuant to the Magnuson Act and declared the
security of the U.S. to be at risk and authorized the
Commandant (USCG) to enforce 33 CFR 6 and to designate
waterfront facilities for the handling, storage, and
loading and discharging of explosives, flammable or
combustible liquids in bulk, and other dangerous articles.
It also authorized the Commandant to prescribe conditions
or restrictions for safety on waterfront facilities and
vessels in port, as deemed necessary.
Waterfront facilities are regulated by 33 CFR 126,
33 CFR 154 and 33 CFR 156. 33 CFR 126 implements 33 CFR 6
and applies to all designated waterfront facilities and
facilities of particular hazard. Authorization to
have remained basically unchanged since the 1950's and
1960's. These regulations apply to three broad categories
of hazardous materials: dangerous cargoes, designated
dangerous cargoes, and cargoes of particular hazard
(definitions can be found in the appendix). Part 12 6
describes the conditions which must be met in order for a
waterfront facility to be deemed a "designated waterfront
facility" and a "facility of particular hazard." Only
designated waterfront facilities may handle designated
dangerous cargoes and dangerous cargoes, and only
facilities of particular hazard may handle cargoes of
particular hazard. The regulations of 33 CFR 12 6 deal
with subjects such as security, fire prevention, fire
fighting, cargo permit requirements, liquid cargo
transfer, and cargo arrangement.
In addition to 33 CFR 12 6, waterfront oil transfer
facilities must also comply with the more specific 33 CFR
154 and 156. Parts 154 and 156 were promulgated after the
passage of the Ports and Waterways Safety Act of 1972 and
the Federal Water Pollution Control Act of 1972, and they
apply to all onshore and offshore facilities engaged in
the transfer of oil in bulk to or from any vessel with a
capacity of 250 or more barrels. Parts 154 and 156 cover
basically the same areas as Part 126 but in more detail.
equipment specifications, guidelines for facility
operations, and pollution prevention.
49 CFR 170-179 (promulgated under the Hazardous
Materials Transportation Act) were promulgated by the
Materials Transportation Bureau (MTB) and regulate the
handling, storing, stowing, loading, discharging, or
transporting of dangerous cargo in bulk, portable tanks,
containers or packages at designated waterfront
facilities. USCG inspectors use 49 CFR 170-179 to ensure
cargo located on a designated waterfront facility, a
facility of particular hazard, or a vessel moored
alongside one of these facilities is being handled in a
safe manner.
USCG Organization
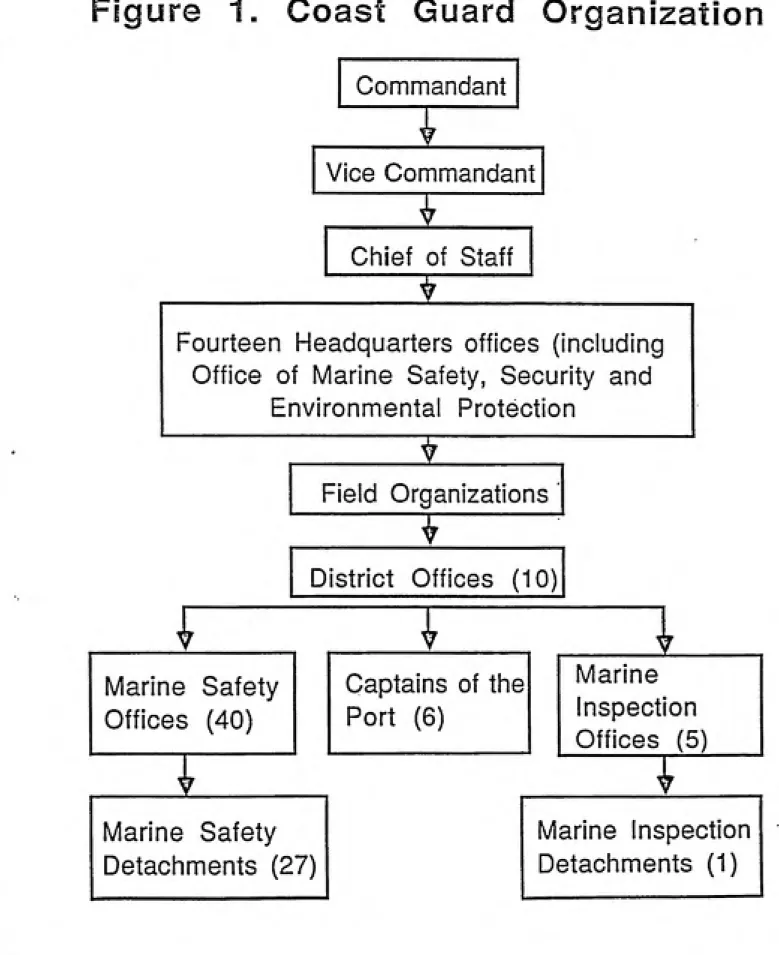
The basic organization of the USCG is depicted in
Figure 1. The headquarters, area, and district offices
are primarily policy makers and advisers for the field
units. The field units are the primary enforcers,
responders and implementers. This is the basic
organization for all USCG mission areas; thus, this is the
basic organization for the marine environmental protection
mission area.
The waterfront facility inspection program is
implemented by Marine Safety Offices (MSO) and Captain of
Figure 1. Coast Guard Organization
Commandant
I
Vice Commandant
Chief of Staff
T
Fourteen Headquarters offices (including
Office of Marine Safety, Security and
Environmental Protection
T
Field Organizations
I
District Offices (10)
i
Marine Safety
Offices (40)
I
T
Captains of the
Port (6)
1
Marine
Inspection
Offices (5)
Marine Safety
Detachments (27)
J
supervised by a junior officer or a Chief Petty officer
(Figure 2). The actual inspections and field work are
conducted by petty officers.
Training for the program is carried out at the unit
level, at USCG Reserve Training Center (RTC), Yorktown,
VA, and at industry and EPA schools. RTC has introductory
courses in marine environmental protection for officers
and petty officers. It also has advanced schools in
hazardous materials and explosive loadings. Students
learn jurisdictional authority, inspection techniques,
investigation techniques, USCG policy, and the location of
related reference material. Unit training basically
reemphasizes material taught at RTC. Additional training
is obtained from various industry schools and from EPA
courses.USCG policy for the marine safety field is
communicated primarily in two ways: the Marine Safety
Manual (MSM) and Commandant Instructions. MSM Volume I,
chapter four, (Marine Safety Law Enforcement) describes
enforcement activities, policies and objectives for the
marine safety program. It lists actions available to the
Captain of the Port (COTP) in response to deficiencies
and/or violations at a waterfront facility and they are:
a. Verbally point out any deficiency, enabling
on-the-spot correction or preparation of a
Typical Marine Safety Office Organization
(>ap«rt merit
1 Pylorm pr«v«rtitiv« fcjnctiofn.
IncKxJtog-• Via*«4 r\Bp«ct>ons ancj b. ftaoTf in*p»ct>ons.
2. P»ffcfm tonr\*(j# rr»A»*ji^
m»nt hrdoft* (wt^ri rtqyirKj). a. US v«ta«( cvaifcjtet
ftnd «mandm«nti.
b S^oty ci< Ut H Sm (SOLAS) documftrti.
Commanding Officer (CXITP/OCMI)
Executive Otficor
(Artemato OOVPiAcWng OCMI) Admlnl8tr«tlv« SUfI p«r*onrHrI lupfXXl functJoni,
2 Cortinooocy ptAnmng
Port Opemtkmf
Department
•. Moortonng th« atotus o* \«9»fr4s kn pod.
b. Kjutof, itrchor*g«. irtd
C W5»«J irtfftc
tnrtc K<MO€ mtHjnrt).
d. Po«u(ion tnd ^TTi^r^vxy rttsporiM.
ti Dtwction of vac39(
(. Morvtxing ipacuil
InttrMt v»s»«4.
0 Mcrrtonng 0CP*J\
(Jumpirig h. A*r\»} po*Jbon
•urv*«iurc«.
2. FVloon prtwrtaov* hjixxxxa, includiog
a. F»crtfTy tr\«p*ctiont »nd b Wonrtofing txJk »nd bnMk bu^ hj.2ardou« c^ryo
C Uonihonng cqjtotiv* And
rvOOACtr^ m«(on*l tn/iai»n.
d ViriMi bOAnJiogs lor ttttary arxj poCuton pr«v*nt)on
rvgijUdiooi-a Orvri«*e tJ>« loiCM^rig; «. £xp*04^* b«d*og
Icy iM.>h9 reiC*p4>on taoWt« d fUpooi of v<c4«uon r»ixiting lo catvo u>ory
«. Pgrt S*curtry C«rtii
4 pRMcJ* commurwcabon
Invettlgalion Department
V P»rtorm iTN^thgjtton fcjnctioo*. inciuiJino f»portj erf.
• U«/in« •ocK}«c«B and caauAA>«3.
b FV»onr)«4 rrMcondvxI. n*g(;9«nc«, »nd rcompetenc*.
c Vclaoooi o*
nmnQMJon ktws. d. D«mibO« to Aidt to
•. UotorlXMf dMlhft.
t. I.U/1n« poAJbon. fl, Ftcikty incidw-tt, 2. Conduct IcAcMiHjp tnvMO^on* of vkoUOon* c>«4»ctod by oth»f D«p«ftrT>*nt»
fUgk>nal Eximlnatk^n Center (REG) (Where Esttibll»he<0
PVlofTn »unct>on« P»t«(ing to inuanc* of v>t*«< operaiing p«r«>vi«( tioan»«ft t/xl
•••m»o*i doctjfT>6ot» and
mafri«nano« of rvcords rM«ting
to iuuanca of kc«n»M and
docurrwits. {An R£C ki a d«partm»nt of, and normaJty ccAx«iK} vMi\ an MSQ)
Vdwel Documentation Office
(Where estat>Jl»he<J)
FVIorm fucxliooi r»i«(ing to
^••»*< documenuion and docurT)*nied ws»oJ rvconj
mMntoAanoa (A v«s»«t
dooxT^vrtBtion otficm li a •utHjnrt of. bot noonal'v
oo«oc«i^ w«ih an MSO)
Uatioe Safety Detachment (MSD)
(Where EttftbfLahed)
PrtXTTi »*»»grv«d ln«p*chon. port opofWiom. and kTv»*>t-gobon tunctxxii at a tocjibon
QflogfaphcaJfv MparMo trom
We^l IHifftc
SefVtce (VTS) (Where EataWlthe<J)
b. Issue a COTP Letter of Warning (a discretionary
tool to expedite the processing of minor
violations).
c. Request U.S. Customs clearance be withheld from
a vessel.
d. Issue a COTP Order (directed only to a specific
vessel, facility or individual in order to:
restrict or stop vessel/facility operations;
require specific actions to be taken; deny a
vessel further entry to port until a deficiency
is corrected; or detain a vessel in port).
e. Seek an injunction in federal court to halt
operations.
f. Direct a U.S. vessel subject to inspection to
cease operations.
g. Coinmence civil penalty proceedings by submitting
an MVRR for vessels or a Report of Violation for
parties other than vessels.
h. Terminate or suspend the waterfront facility
general permit.i. Suspend or revoke the Certificate of Adequacy
for waste reception facilities,
j. Establish safety zone, security zone, or
regulated navigation area as per 33 CFR 165.
Specific policy and guidance sections are included in
19
facility inspection program; however, the Waterfront
Facility Enforcement Policy section has not been developed
at this time. The Port Safety and Security Division at
USCG Headquarters is nearing the end of a major revision
to the federal regulations pertaining to waterfront
facilities, 33 CFR 126, 154, 155 and 156. They will
develop the enforcement policy section after the
regulation revision is approved.
MSM Volume II, Chapter 22 is titled Marine Facilities
and Structures. It covers the legislative and regulatory
authority related to the waterfront facility inspection
program as well as addressing general concerns and
procedures of waterfront facility inspections for
facilities falling under 3 3 CFR 12 6 only, and for those
falling under 12 6, 154 and 156. This chapter provides
excellent inspection guidelines, examples, and references.
The MSM also provides guidance on the minimum number
of activities which should be done to maintain an adequate
program. These guidelines are called Mission Performance
Standards and are documented in the Port and EnvironmentalSafety (PES)/Marine Environmental Response (MER) Quarterly
Activities Report (QAR) (Appendix I). For the waterfront
facility program, the standards that went into effect 5
May 198 6 are:20
b. Inspect Waste Reception for Oil. Annually
inspect 100 percent of fixed waste reception
facilities at designated waterfront facilities.
c. Issuance of COA for Noxious Liquid Substances.
Process 100 percent of COA applications for NLS within 1 year of receipt of completed
application.
d. Inspect Waste Reception Facilities for NLS.
Annually inspect 100% of fixed waste reception
facilities at designated waterfront facilities.
e. Liquid Bulk Facility Inspections. Annually
inspect 100% of the designated waterfront
facilities.
f. Dry Cargo Facility Inspections. Annually
inspect 100% of the designated waterfront
facilities.
g. Liquid Bulk Facility Surveys. Survey 100% of
the designated waterfront facilities every 2
years.
h. Dry Cargo Facility Surveys. Survey 100% of the
designated waterfront facilities every 2 years.
i. Facility Operations Manual Review. Review 100%
of facility operations manuals in conjunction
with facility surveys or in response to a
pollution incident or accident.
j• Hot-work Permits. Conduct inspection prior to
An inspection of a waterfront facility is a
prearranged examination which verifies compliance with all
applicable regulations (33 CFR 126, 154 and 156; 49 CFR
149). A suirvey is a detailed review of a facility's
physical plant to keep the file updated. Accurate files
are important because inspectors review them prior to
inspections and emergency response personnel review them
prior to responding to accidents.
One category no longer a part of the performance
standards is facility spot check inspections. Prior to
the new standards, inspections were required biannually,
surveys were required biennially (no change), and spot
checks were required monthly. Due to budget constraints,
these standards were modified on 21 December 1981 and
called for inspections annually, spot checks bimonthly,
and no survey requirement. These "standards" were in
effect until the 5 May 1986 revision to the MSM. Although
spot checks are no longer a documented entity, the MSM
still states that anytime USCG personnel are on a
facility, they should be alert for obvious violations of
laws and regulations.
Federal, State and Industry Roles
The broad and diverse authority of the federal
Transportation (DOT) and the Nuclear Regulatory Commission
(NRC) are of primary interest.
Within DOT, the Office of Hazardous Materials
Transportation (OHMT; formerly called Materials
Transportation Bureau) has general authority over
regulating all shipments of hazardous materials. OHMT
promulgated the packaging, labelling, marking, placarding,
stowing, segregating, and paperwork regulations contained
in 49 CFR 171-177. The specific enforcement of hazardous
materials transported by highway, rail, air, and water is
conducted by the Federal Highway Administration (FHWA),
the Federal Railroad Administration (FRA), the Federal
Aviation Administration (FAA), and the USCG, respectively.
Regulatory authority over radioactive materials is
divided between DOT and NRC. NRC sets the standards for
carriage of fissile and radioactive materials that exceed
Type A limits, and DOT sets the standards for carriage of
nonfissile radioactive materials and quantities of fissile
materials that do not exceed Type A limits.
In the early 1970's, state governments began their
involvement in hazardous material transportation safety.
An impetus for their involvement was the relatively low
number of DOT enforcement actions compared to the large
number of shippers, carriers, and container manufacturers
recognized the need for a stronger prevention and
enforcement program at the state level.
The federal government's response to the recognized
need for more state involvement was to give OHMT the
responsibility of organizing Federal-State cooperative
programs. In 1981 OHMT initiated the State Hazardous
Materials Enforcement Development Program (SHMED) with two
objectives:a) strengthen State enforcement capabilities
b) promote uniformity in state hazardous materials
safety regulations and enforcement procedures.
SHMED was primarily directed at highway transportation of
hazardous materials and offered states $120,000 to develop
and implement inspection programs and enforcement
procedures. Only twenty-five states participated in SHMED
(New Jersey established an enforcement program without
SHMED support.)Building an effective inspection and enforcement
program at the state level has been slow. It has even
been slower for waterborne hazardous materials because of
SHMED's bias toward highway transportation. Local
agencies such as fire departments and police departments
is usually in the fire protection area only. More funds
and resources would be needed for local agencies to be of
significant benefit to the USCG (Office of Technology
Assessment, 1986).Regardless of the regulatory involvement of state and
local governments, all waterfront facilities are subject
to all applicable Federal regulations. The USCG, OHMT,
and the Occupational Safety and Health Administration
(OSHA) have all promulgated regulations which apply.
Ports may adopt standards more stringent than the Federal
regulations but none less stringent. Some ports have
adopted the Federal regulations and some have issued their
own. Other ports have adopted the voluntary industry
standards published by the National Fire Protection
Association (NFPA) (Table 1) .
The Occupational Safety and Health Act of 1970 gave
OSHA the authority to promulgate regulations to provide a
safe work environment at commercial shoreside cargo
handling operations at marine tenninals. The results of
this act were codified in 29 CFR 1917 and 1918, but the
act prevents OSHA from issuing regulations in areas
already regulated by another federal agency. Therefore,
OSHA's regulations are general and directed toward worker
health and safety at marine terminals. They do not cover
facilities used solely for the bulk stowage, handling, and
transfer of flammable, non-flammable and combustible
Sumiaary of Local Regulations at Waterfront Facilities
Port
Baltimore X X
Buffalo X
Cincinnati X
Cleveland X
Detroit X
Houston X X
Huntington
Los Angeles X X
New Orleans X
New York X X
Oakland X X
Port Arthur
Seattle X X
Notice/ Time Threshold Transfer
Permits NFPA Limits Separation Amounts Operations Inspection
X
X X X
X
X X X
X X X
X X
X X X
X X
X
X
X X X
(1)
(2)
(1) Vessel and terminal inspection
(2) Container inspections
SOURCE: Telephone interviews with fire officials; State and local regulations
(see References for complete list).USCG under the authority of the Ports and Waterways Safety
Act. The USCG's regulations focus on the dangers related
to fires, explosions and pollution; and do not
specifically address workers' health. Recent OSHA hazard
coironunication rules codified in 29 CFR 1910 should help
bridge the gap between the previously existing
regulations. 29 CFR 1910 requires employers to educate
employees on the risks of hazardous substances stored,
manufactured or handled at the facility.
The National Fire Protection Association (NFPA) is an
industrial organization which has issued several standards
applicable to waterfront facilities. Although NFPA has no
power or authority to enforce their standards, many ports
have adopted some or all of NFPA's standards. The two
applicable standards are:No. 30 Flammable and Combustible Liquids Code
(1981)No. 307 Construction and Fire Protection of Marine
Terminals, Piers, and Wharves (1985)
NFPA 30 includes a section on wharves with guidelines for
bulk liquid transfer operations and stowage. NFPA 307
includes sections on water supply for fire protection,
general terminal operations, and hazardous materials
to the two NFPA codes mentioned, NFPA has other
publications which include electrical codes, guidelines
for welding, specifications for fire extinguishers, and classification schemes for flainmable and combustibleliquids.
The organization which has provided the USCG with the most assistance in monitoring compliance of the shipment
of hazardous materials by water has been the National
Cargo Bureau (NCB). NCB describes itself as a
"not-for-profit membership organization dedicated to the safestowage, securing and unloading of cargo, and to the
safety of shipboard cargo handling." NCB personnel arequalified to perform over twenty different types of
inspections and surveys, including the following examples:
a) Stowage of explosives, bulk and packaged
hazardous materials in accordance with federal
regulations.
b) Preloading inspection of holds and reefers for refrigerated cargoes, taking and recording temperatures.
c) Loading, stowage and securing of general cargo,
on or under deck, including special surveys of
large, heavy lift units.
d) Stowage of bulk grain cargoes, related
arrangements and vessel suitability.
Carriers place special significance on certificates issued by NCB because the USCG accepts these certificates as prima facie evidence that the cargo is stowed in
accordance with 49 CFR. Carriers are also utilizing the services of NCB more often because not every
shipper/exporter has the trained people to properly pack, block and brace the wide variety of regulated commodities. This is becoming more important to ocean carriers because of potential responsibility for cleanup costs and
liability associated with a hazardous substance discharge under CERCLA, as amended (Bohn, 1985).
Trends and Databases
The safety regulations at waterfront facilities have changed very little over the last thirty years; however, two changes occurred in the waterborne shipment of
dangerous commodities in the 1970's and 1980's. The first change was the tonnage decline of petroleum and petroleum
products and the tonnage increase of chemicals. The
second change was the increased use of intermodal
containers (containers that can be transported by rail,
land or water) in all areas of the marine industry,
including shipment of chemicals in intermodal containers.
Table 2 shows the relationship of the tonnage shipped
for petroleum and petroleum products and for chemicals.
Table 2
Trade in Petroleum and Chemicals by Service Type, 1977-81
(million short tons)
Commodity Group and
Service Type_______ 1977 1979 1981
Petroleum
Dry Cargo/Liner 11.2 10.5 25.3
Tanker 900.3 914.9 804.5
TOTAL 911.5 925.4 829.8
Chemicals
Dry Cargo/Liner 28.2 32.3 32.8
Tanker 46.6 55.0 51.5
TOTAL 74.8 87.3 84.3
Combined
Dry Cargo/Liner 39.4 42.8 58.1
Tanker 946.9 969.9 856.0
TOTAL 986.3 1012.7 914.1
SOURCE: U.S. Waterborne General Import and Export
Statistics (SA 305/705), U.S. Bureau of the
Census; Waterborne Commerce of the United States,
trend in the world oil market is reflected in Table 2. The market peaked in 1978-1979 and then went into a
decline. In spite of the overall trends, the tonnage in
chemicals increased 13% from 1977 to 1981. Total tonnage of chemicals is small when compared to petroleum and
petroleum products so their overall effect is small; however, the significant increase in the shipment of chemicals during an overall decline in total shipments indicates that the volume of chemicals passing through our
ports will probably continue to increase.
It is not surprising that as oil traffic declined, so did the volume of hazardous commodities being carried in tankers. As shown in Table 2, the entire decline in tanker tonnage came from the decrease in the volume of petroleum and petroleum products transported. Table 2 also shows that tankers carry approximately 60% of the
chemical traffic; however, petroleum so dominates the
industry that chemicals only accounted for 6% of the
tanker tonnage in 1981. Transportation of petroleum and
chemicals by dry cargo vessels has shown significant
increases from 1977 to 1981, but dangerous cargo permits (Table 3) have declined. This suggests that there are
fewer shipments, but that the volume of dangerous cargoes
per shipment is increasing. These data indicate that there are no significant changes in chemical carriage by tankers, but there have been changes for dry cargo
Table 3
Transfers, Permits, and Operations
Involving Dangerous Commodities at U.S. Ports
1978-81
Commodity Group 1978 1979 1980 1981
Oil 196,470 190,128 153,133 140,554
Bulk liquid (1) 21,321 24,290 24,634 22,642
Cargo of
particular 6,205 7,953 4,653 3,787
hazard (2)Dangerous cargo 169.327 178.433 158.010 137.827 (3)
TOTAL 393,323 400,804 340,430 304,810
NOTES:
(1) Bulk liquid cargoes other than oil.
(2) Cargo of particular hazard. Class A explosives, and
radioactive material.
(3) Packaged and dry bulk dangerous cargo.
SOURCE: U.S. Coast Guard, Office of Marine Environment
and Systems, Port and Environmental Safety
32
for unintentional discharges, but larger volumes of
dangerous cargoes increases the risk of a serious incident
if there is an unintentional discharge.In order to fully appreciate the data on increases in dry cargo tonnage, recent changes in the U.S. fleet and the relative importance of containerships and tankers should be examined. Between 1971 and 1983, many of the
small, multi-purpose general cargo ships were scrapped and
replaced by large special-purpose containerships. The
tonnage of this segment of the U.S. commercial liner fleetgrew from 1.5 million to 4.3 million deadweight tons (dwt)
during this period. As seen in Table 4, this segmentrepresents 21% of the U.S. fleet capacity and 44% of the
total number of ships. Tankers continue to dominate thefleet capacity with 14.2 dwt while accounting for 49% of
the vessels (includes LNG carriers).Between 1972 and 1981, the total containerized
commercial tonnage in U.S. ports tripled (Table 5). In
1981, container traffic accounted for 61% of thecommercial U.S. liner trade. The number of containers has
grown from 1.0 million to 1.5 million standardized
twenty-foot units. Even with its dramatic growth, container
traffic remains concentrated in only a few areas, with 78%
of the container traffic trading in only twelve ports
(Tables 6-7).. On average, container traffic constitutes
21% of the total tonnage handled by these twelve ports,
Table 4
U.S.-Flag Privately Owned Merchant Fleet, 1983
Vessel Type*
General Cargo
Breakbulk/partial container
Containership
RO/RO—vehicle carriers Barge carriers
TOTAL
Bulk cargo
Tankers
Special products/liquified
natural gas (LNG)
Other (coastal, passenger)
TOTAL
Number Deadweight Tons
104 1,404,688
97 1,868,274
18 274,043
21 765,148
240 4,312,153
18 618,018
233 14,220,469
33 1,601,551
17 110.396
541 20,862,587
NOTES:
* Oceangoing ships, 1000 grosstons and over, on January 1,
1983.SOURCE: "Ship Register," Military Sealift Command,
Department of the Navy. Washington, D.C.
January, 1983. Reprinted in "An Assessment of
Maritime Trade and Technology," Office of
Containerized Commercial Cargo in U.S. Foreign Trade, 1972-81
Million
Long Tons
liO
30
20
10
36.1
33.6
30.6
29.0 ,
27.3
23.7
..
21.3
' ͣ ,•ͣ', 20.8
17.3
12.1
1
1972 1973 19711 1975 1976 1977 1978 1979 1980 1981
SOURCr.: "Containerized Carc.o Statistics," 1979 and 1981, Maritime Administration.
Foreign Commercial Trade in All Commodities and Chemicals on Containerships*
and All Ship Types at Major Containerports, 1980(thousand long tons)
All Ship Chemicals on Chemicals on Port Containerships
8,063.2
Types 43,875.4
Containerships 612.8
All Ship Types
New York 926.7
New Orleans 3,573.2 36,943.5 301.0 2,091.1
Los Angeles 3,357.6 10,917.8 204.8 422.5
Seattle 3,305.4 6,754.2 41.8 70.4
Oakland 3,294.5 4,100.3 172.4 185.8
Long Beach 3,082.3 15,256.8 137.0 542.8
Baltimore 2,832.8 31,227.6 194.9 496.8
Houston 2,679.1 45,862.4 257.3 4,796.1
Norfolk 1,884.5 35,052.0 101.9 490.4
Savannah 1,487.7 7,793.0 55.7 595.6
Charleston 1,302.1 4,157.0 121.6 246.2
Philadelphia 1,049.1 28,042.8 61.1 147.7
TOTAL 35,911.5 269,982.8 2,262.3 11,012.1
NATIONAL TOTAL 46,184.6 739,253.5 3,326.3 49,115.8
* Containership includes containership, partial containership, container/ro-ro,
container/car carrier, container/rail carrier, container/barge carrier,
bulk/containership.
SOURCE: The Maritime Administration, U.S. Department of Transportation.
Foreign Commercial Trade in All Commodities and Chemicals on Containerships*
and All Ship Types at Major Containerports, 1980 (percent)
Port
New York 18.4
New Orleans 9.7
Los Angeles 30.8
Seattle 48.9
Oakland 80.3
Long Beach 20.2
Baltimore 9.1 Houston 5.8 Norfolk 5.4 Savannah 19.1 Charleston 31.3
Philadelphia
3.7Containerized Containerized
Container Chemical Tonnage Chemical Tonnage
Tonnage as as Percent of as Percent of
Percent of All Chemical Containerized
All Tonnage Tonnage___________Tonnage_____
66.1 14.4 48.5 59.4 92.8 25.2 39.2 5.4 20.8 9.4 49.4 41.4 7.6 8.4 6.1 1.3 5.2 4.4 6.9 9.6 5.4 3.7 9.3 5.8
Chemical Tonnage
as Percent ofAll Tonnage 1.4 0.8 1.9 0.6 4, 0, 0, 0, 0, 0.7 2.9 0.2 AVERAGE 13.3
20.5 6.3 0.8
NATIONAL AVERAGE 6.2
6.8 7.2
* Containership includes containership, partial containership, container/ro-ro,
container/car carrier, container/rail carrier, container/barge carrier,
bulk/containership.
of containerized commodities.
Chemicals on containerships accounted for only 6.8% of
the total chemicals shipped. An examination of the twelve
major containerports reveals that chemicals on
containerships made up less than 10% of total
containership tonnage and less than 5% of total tonnage
handled in 1980. Even though the percentage of
containerships carrying chemicals varies widely from port
to port, chemicals on containerships constitutes only
small proportions of the total tonnage handled at ports
involved in commercial foreign trade. Data in this area
are still being gathered by the Maritime Administration,
thus, no trends can be identified at this time. However,
even if the proportion of chemicals on containerships
remains stable, the fact that the container industry and
chemical traffic have been growing indicates ports will be
handling a larger volume of containers containing
chemicals in the future (Department of Transportation,
1984) .
The USCG's Pollution Information Reporting System
(PIRS) records the commodity, location, amount, vessel
type, and cause of all the reported oil and hazardous
substance spills (Tables 8-9). These data on
Estimated Incident Rates by Commodity, 1982-83
(Spills or incidents per 1000 transfers, operations, or permits issued)
Scenario A (1) Scenario B (2)
Commodity Incidents Transfers Rate
Transfers Rate 1982 Estimate
Oil
106 133, 526 .79 147, 581 .72
Bulk liquid
64 21, 510 2.98 23, 774 2.69Cargo of particular
hazard
ͣ
4 , 3, 598 1.11 3 976 1.01
Packaged dangerous
cargo 8
130, 936 .06 144 ,718 .06
1983 Estimate
oil
160 126,850 1.26
154,960 1.03
Bulk liquid 55 20,435 2.69
24,963 2.20
Cargo of particular
hazard 7
3,418 2.05 4,175 1.68
Packaged dangerous
cargo 9
124,389 .07 151,954 .06
(1) Scenario A assumes 5 percent decrease per year from FY 1981 base number of
USCG-recorded transfers and permits.
(2) Scenario B assumes 5 percent growth per year from FY 1981 base number of
USCG-recorded transfers and permits.
SOURCE: National Response Center; Hazardous Materials Incident Reporting
System; USCG Port and Environmental Safety Division.
The following table presents NFPA data, covering the period from 1973-1981,
on the causes and results of waterfront facility fires. Damage costs are in
1985 dollars. With this data the effectiveness of the waterfront facility
regulations can be examined.
FY1985 Cause
Electrical failure
Equipment malfunction
Fueling Ops
Intentional
Improper handling
and storageWelding
Smoking
Cooking
Other & Unknown TOTAL
# of # of # Of Dollars % Of
Incidents Iniuries Deaths Damaqe Damage
7 9 1 6,499,000 .12
7 29 2 10,279,000 .19
6 8 6 2,373,600 .04
5 6 2 4,030,300 .07
5 3 1 14,389,000 .26
4 40 5 717,032 .01
2 1 0 428,183 .007
2 0 1 1,169,900 .02
5 5 1 15.975.000 .29
43 101 19 55,879,015 1.00
USCG QAR; however, the validity of these data is
questionable. There are no specific requirements for oil
transfers to be reported to the USCG, but there are
specific permits and notifications for designated
dangerous cargoes and cargoes of particular hazard. In
light of the fact that petroleum and petroleum products
dominate the market, it is safe to assume that they also
will make up the vast majority of the transfer operations.
Thus, reported figures for total transfer operations are
"guestimates" at best.
The USCG actually has two databases regarding
unintentional discharges, PIRS and the National Response
Center (NRC). USCG regulations require that discharges be
reported to either the cognizant MSO/COTP or NRC. NRC
will notify the cognizant MSO/COTP after is receives a
report of a discharge. The PIRS database is a
consolidation of reports from each MSO/COTP and it reveals
that human error and mechanical failure each accounted for
approximately half of the unintentional discharges
reported from 1973 to 1981. The break down of the
discharges by commodity is: 68% for oil; 13% for
gasoline, 17% for other dangerous cargoes, and 2% for
Cargoes of Particular Hazard (COPH). This break down is
not surprising, but due to the increasing trend of
chemical shipments, an increasing number of COPH and
Nature of Evaluation
The Coast Guard recognized the value of advanced
training for personnel long ago. Most Coast Guard
programs fund the annual costs of postgraduate school for
1-5 commissioned officers. The primary purpose of the
Coast Guard's postgraduate school program is to provide
education and training for selected individuals, who in
turn, will use this knowledge to make more informed
decisions and judgements in future jobs in the Coast
Guard. A coincidental benefit for the Coast Guard is that the officers in school can be utilized as a resource for
specific projects. Most Master's reports completed by
Coast Guard officers are chosen from a list of real CoastGuard projects or problems compiled at USCG Headquarters.
The Port Safety and Security Division at USCG
Headquarters (Program Manager for the waterfront facility
inspection program) determined that the waterfront
facility inspection program should be evaluated to comply
with the Coast Guard Port Safety and Security Operating
Program Plant which states "all Port Safety and SEcurity
activities will continue to be evaluated to ensure there
potential Master's report and was chosen as the topic of
this report (Figure 3).
During consultation with the Program Manager of the
waterfront facility inspection program, it was revealed
that this evaluation would be used as input in the
revision of program policy and guidance documents, and in
the revision of 33 CFR 126 scheduled for fiscal year 1988.
He also requested specific recommendations for
establishing program policies and mission performance
standards, and an assessment of the potential for "third
parties" performing Coast Guard facility enforcement
activities.
In determining the methodology for this project,
evaluation techniques were considered, past evaluations of
the program were reviewed, current measurement instruments
for the program were examined, and available statistical
data bases were evaluated.
The 1984 assessment of the waterfront facility
inspection program by RSPA focused on the safety
regulations for waterfront facilities (33 CFR 12 6, 3 3 CFR
154 and 33 CFR 156) and industry trends. RSPA found that
chemicals are accounting for a growing segment of the
dangerous commodity trade; the use of intermodal
containers in water shipments have increased
Figure 3
Schedule of Events
Dec 85 Requested list of thesis topics
Jan 86 Topic chosenFeb 8 6 Discussion of evaluation
objectives with Program Manager;
requested USCG program literature
Feb-Apr 86 Reviewed the literature;
discussions with Program Manager; discussions with evaluator of a
related study
Apr 86 Submitted proposed evaluation
design
May 8 6 Proposal approved
Schedule of visits
1 July 86 USCG HQ
2-3 July 86 MSO Baltimore 7-8 July 86 MSO Hampton Roads 9-10 July 86 RTC Yorktown
13-14 July 86 MSO Tampa 16-17 July 8 6 MSO Mobile
2 0-21 July 86 COTP New Orleans
2 2 July 8 6 MSO Port ARthur
23-24 July 86 COTP Houston
Aug-Dec 86 Reviewed findings and wrote rough
draft
Dec 86 Submitted rough draft
regulations, RSPA concluded that there was no consistent
indication of safety problems requiring more detail than
Coast Guard regulations currently provide. A 1986 study
by University of Michigan postgraduate students focused on the carriage and regulation of cargoes of particular
hazard (COPH). This study revealed that the thirty-three
bulk liquid chemicals listed as COPHs were not necessarilythe most dangerous bulk liquid chemicals being carried by water; the regulations for carriage and transfer of bulk
liquid chemicals were confusing; worker safety on
waterfront facility has been neglected by OSHA and the
Coast Guard; and lack of funds, training and statutory
authority usually prohibited other agencies from assisting
the Coast Guard in enforcing the waterfront facility
regulations.
The Port and Environmental Safety/Marine Environmental Response Activities Report (QAR) is the Coast Guard's
source of data for activities under the waterfront
facility inspection program. Several QAR categories
pertain to the program but they measure effort notresults. There are no measures for output criteria.
Evaluation Design and Strategy
The intent of this Report is to evaluate the Coast
Guard's waterfront facility inspection program using
practical evaluation techniques; report the findings and
The task was to conduct a formative evaluation. The
objectives of the evaluation were carefully selected,
otherwise, the task could have become overwhelming. After
a review of the available information and consultation
with the Program Manager, the following issues needed
further investigation:
(1) measurement of program effectiveness;
(2) outside agency enforcement of 33 CFR 126;
(3) effect of industry trends on the program;
(4) enforcement problems at the unit level;
(5) program implementation problems;
<6) training;
(7) worker safety at waterfront facilities; and
(8) regulations for carriage and transfer of bulk
liquid chemicals.
The scope of this evaluation was reduced because of
limited resources and lack of existing program output
measures. The evaluation would address the first six of
the eight listed issues. The objectives of the evaluation
design were to provide input for future program
evaluations, program policy and guidance revisions, and
waterfront facility regulation revisions. The evaluation
measures consisted of interviews of program participants,
In an evaluation conducted by a single person, the
depth of the study depends on the number of issues being
considered. In the absence of adequate program output
measures, the evaluation design chosen consisted primarily
of program participant input with statistical
augmentation. Program participant input came from visits
to selected field offices on the east and gulf coasts.
Each visit was preceded by a telephone call to the
office's Chief of Port Operations to explain the purpose
and objectives of the evaluation. The offices visited
were:
Port Safety and Security Division, USCG Headquarters
Marine Safety Office, Baltimore, MDMarine Safety Office, Hampton Roads, VA
Marine Safety Office, Tampa, FLMarine Safety Office, Mobile, AL
Captain of the Port, New Orleans, LA
Marine Safety Office, Port Arthur, TX
Port Safety Station, Houston, TXReseirve Training Center, Yorktown, VA
Each visit was conducted using the same format. The
office's program supervisor and field inspectors were
(1) Describe the unit's waterfront facility training
program;
(2) How many waterfront facility field inspectors are
at the unit?;(3) How are inspections scheduled?;
(4) Does your unit meet waterfront facility
inspection mission performance standards?;
(5) Describe local, state and federal agencies that
could assist USCG personnel in enforcing the waterfront facility regulations;
(6) What problems do intermodal container facilities
present to the USCB waterfront facility inspection program?; and
(7) What problems are there in enforcing 33 CFR 126, 33 CFR 154 and 33 CFR 156?
In addition to interviews, field inspections were observed at most of the units. These observations were used to
document inspection procedures and discuss any problems
enforcing the waterfront facility regulations. Observed inspections procedures were compared to the USCGprocedures contained in the Marine Safety Manual. At
four of the ports, an industry representative wastraining goals for the waterfront facility inspection
program.
Direct measures of program effectiveness were not
available; however, statistics on program effort wereavailable and evaluated. Data on related activities such
as oil and chemical transfers, spills, monitors, and spill
rates were available and presented. No direct correlation
between the waterfront facility inspection program and
these related activities can be made, but these data are
valuable to gain a perspective of the effectiveness of
other Coast Guard marine safety activities.strengths and Weaknesses of the Design
An in-house evaluator knows the organization and can
easily ask pertinent questions. He will be sensitive to
the program's needs and have a desire to improve the
program. He will be treated as part of the team which
will be an asset during interviews and discussions.
Interviews may not be a preferred measure but a telephone
call preceding each visit increases the receptivity of the
respondents. The credibility of this evaluation is
enhanced by the inclusion of behavioral observations at
the field units.
A weakness of a one person evaluation is the limited
opportunity of helpful feedback. An in-house evaluator
evaluated, it may be difficult to remain objective. The selection process for determining which field offices to visit may be a weakness in this evaluation. Ideally field offices should be selected to ensure all problems in the
national program will be addressed. Lack of program funds limited this evaluation to a small geographic area.
Another weakness in this design is the lack of program
effectiveness, impact and cost effectiveness measures. Looking at these types of measures over the long-term will indicate if objectives are being met and can be used to justify additional resources for the program.
While the offices visited comprise only 15 percent of the Coast Guard's field offices, they are responsible for 34 percent of the waterfront facilities inspected by the
Coast Guard and 37 percent of the hours spent on
waterfront facility activities (information provided by
the Port Safety and Security Division at USCG
Headquarters). This indicates a potential weakness in the
evaluation, limited field office visits, was partially
overcome by carefully selecting the field offices to