A dynamic bi-objective model for after disaster blood supply
chain network design; a robust possibilistic programming
approach
Jafar Heydari
1, Ali Sabbaghnia
1*, Jafar Razmi
1 1Department of Industrial Engineering, College of Industrial Engineering, University of Tehran, Tehran, Iran
[email protected], [email protected], [email protected]
Abstract
Health service management plays a crucial role in human life. Blood related operations are considered as one of the important components of the health services. This paper presents a bi-objective mixed integer linear programming model for dynamic location-allocation of blood facilities that integrates strategic and tactical decisions. Due to the epistemic uncertain nature of strategic decisions, in order to cope with the inherent uncertainties, a robust possibilistic programming approach is applied to the proposed model. Finally, to test the applicability of the proposed model, sensitivity analysis and some numerical examples are being proposed.
Keywords. Health service management, robust possibilistic programming, blood
supply chain, disaster, dynamic bi-objective model
1-Introduction and literature review
Healthcare services play a vital role when the human lives are addressed. This important issue has been received the attention of both practitioners and academia for many years and still is an interesting research avenue (Smith‐Daniels et al., 1998), (Møller-Jensen and Kofie, 2001), (Oztekin et al., 2010),
(Zepeda et al., 2016) and (Detti et al., 2017). Along with the other components of the health service
network, blood supply chain is an important part of healthcare systems especially when addressing emergencies and disasters. Natural disasters like earthquakes and floods or even man-made disasters cannot be predicted efficiently. Eventually, any disaster will absolutely cause a sudden increase in demand of blood products. To avoid any devastating shortages in blood and its direct derivative products the national blood supply chain managers should come up with a precise, robust and effective supply-consumption plan. Reaching such narrow plan is practically impossible because most of the parameters of these systems are tainted with a high degree of uncertainty (Mousazadeh et al., 2018) and
(Azadeh et al., 2017). The ultimate goal of a healthcare system is “to reduce healthcare inequalities”, to
achieve this goal, designing a proper decision making system for determining the optimal location-allocation decisions for blood products is an immediate need.
Facility location problem is one of the early problems which its applications are widely used in healthcare systems.
*Corresponding author
ISSN: 1735-8272, Copyright c 2018 JISE. All rights reserved
Journal of Industrial and Systems Engineering
Vol. 11, Special issue:
14th International Industrial Engineering Conference
Summer (July) 2018, pp. 16-28
(IIEC 2018)
TEHRAN, IRAN
17 16
Location-allocation problem is a classical extension of facility location problem which locates a set of new facilities regarding minimum transportation costs and determines an optimal number of facilities to be placed in a specific area in order to satisfy the demand (Azarmand and Neishabouri, 2009).
Location-allocation problem have been investigated thoroughly in several healthcare studies, interested readers can refer to Ahmadi-Javid et al. (2017) for more details.
Blood distribution problems are categorized into three hierarchical levels; single hospitals (Heddle
et al., 2009), regional blood centers (Gregor et al., 1982) and (Berzigotti and Bosch, 2016) and supply
chain level (Fahimnia et al., 2017) and (Beliën and Forcé, 2012)). Some researchers have studied all these levels, while others have focused only on one level.
Generally, there are three specific time horizon for planning relief activities in case of emergencies: before, during and after a disaster. Here, we study the after disaster time interval. Remember that the post-disaster period is comparatively short and yet the most important window in saving the victims. In order to address this gap this study mainly focuses on this specific period and a short-term planning model with uncertainty considerations is proposed.
In contrast with traditional and common objectives in the business world, relief supply chains mostly focus on objectives related to human life. Cost-based objective functions usually are in conflict with service level and satisfaction degree based objectives. In this study the main objective is to be as responsive as possible in life saving and yet to be efficient at the same time.
Blood is one of the most important items in after disaster relief procedure and this paper proposes a multi-period, multi-objective optimization model with a robust possibilistic approach to handle the problem dynamics, trade-offs and uncertainties. The proposed multi-objective disaster relief logistics model is formulated as a mixed-integer, programming location-allocation model using a robust and minimax approach to obtain a more equitable, robust and reliable distribution plan of blood.
There aren’t adequate studies addressing the after disaster relief programs from the perspective of blood supply chain management. Here studies on both blood supply chain management and after disaster relief programming efforts along with the studies directly addressing the after disaster relief programming in the blood supply chain are investigated. On the other hand, relevant literature on location-allocation problem in healthcare and blood supply chain network design should be investigated to point out the gap. A comprehensive survey on applications of operational research in healthcare services is presented in Rais and Viana (2011).
As the investigations on relevant literature reveals, the epistemic uncertainty of input parameters in blood supply chain problem has been underrated and there are not adequate mathematical models. Considering in real-life after disaster relief programs, all of the parameters are highly tainted with uncertainty and ambiguity. For that reason, neglecting the vague nature of input parameters may lead to a tragedy and expose the managers to high risks. To fill out this gap, a novel dynamic multi-objective mathematical programming model based on robust possibilistic programming approach is proposed for location-allocation decisions for an after disaster relief plan.
The remainder of the paper is organized as follows. Section 2 focuses on the problem definition and model assumptions, parameters and model formulations. Next is introducing the procedure in which the multi-objective model is reduced into a single objective one. Section 4 is the implementation and evaluation of the proposed model. At last, in the final section of the paper conclusions and future research directions are formulated.
2-Problem description and formulation
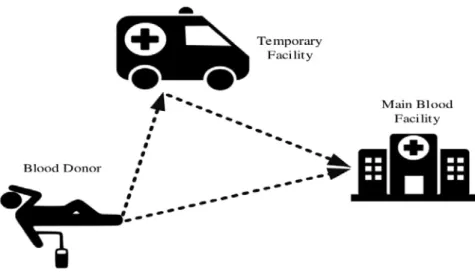
Here, a multi-period bi-objective model for after disaster blood supply chain management is proposed. In this problem, the donators serve as the supply points whether donating blood directly to a main blood facility known as blood storage and processing center (MBF) or to a temporary blood collecting facility (TBF). Collected blood in each TBF must be delivered to the storage and processing center for preserving and further use. A scheme of events in this chain is illustrated in figure 1. To increase the blood donators’ coverage, a TBF can possibly move to another location at the end of each period.
Fig 1. Scheme of the events in the under study blood supply chain
The indices, parameters and variables used to formulate the problem are as follows: Indices
I Index of blood donator group locations (BDG)i=1,…,I
J Index of temporary blood facility candidate locations (TBF) j=1,…,J N Index of main blood facility candidate locations (MBF) n=1,…,N T Index of planning time periods t=1,…,T
Parameters
𝐶𝐶̃𝑖𝑖𝑖𝑖 Cost of transportation from BDGi to TBFj
𝐶𝐶̃𝑖𝑖𝑖𝑖 Cost of transportation from BDGi to MBFn
𝐶𝐶̃𝑖𝑖𝑖𝑖 Cost of transportation from TBFj to MBFn
𝐶𝐶̃𝑖𝑖1𝑖𝑖2 Travelling cost of a TBF from locationj1to location j2
𝐶𝐶𝑎𝑎�𝑝𝑝𝑖𝑖 Collecting capacity of the jthTBF
𝐶𝐶𝑎𝑎�𝑝𝑝𝑖𝑖𝑠𝑠 Storage capacity of the nthMBF
𝐶𝐶𝑎𝑎�𝑝𝑝𝑖𝑖𝑝𝑝 Processing capacity of the nthMBF
ℎ�𝑖𝑖𝑡𝑡 Inventory handling cost at nthMBF in period t per unit
𝐷𝐷�𝑖𝑖𝑡𝑡 Quantity of demand in nthMBF in period t
𝑆𝑆̃𝑖𝑖𝑡𝑡 Quantity of possible blood supply from BDGi in period t
𝐴𝐴̃ Possible maximum number of TBFs
Variables
𝑋𝑋𝑋𝑋𝑖𝑖𝑖𝑖𝑡𝑡 Equals 1, if BDG
i is assigned toTBFj in period t, 0 otherwise
𝑋𝑋𝑋𝑋𝑖𝑖𝑖𝑖𝑡𝑡 Equals 1, if BDGi is allocated toMBFn in period t, 0 otherwise
𝑌𝑌𝑋𝑋𝑖𝑖1𝑡𝑡𝑖𝑖2 Equals 1, if a TBF is going to move from location j1 to location j2 in period t, 0 otherwise
𝑌𝑌𝑋𝑋𝑖𝑖𝑖𝑖𝑡𝑡 Equals 1, if TBFj is allocated toMBFn in period t, 0 otherwise
𝑄𝑄𝑋𝑋𝑋𝑋𝑖𝑖𝑖𝑖𝑡𝑡 Quantity of donated blood from BDGi toTBFj in period t, 0 otherwise
𝑄𝑄𝑋𝑋𝑋𝑋𝑖𝑖𝑖𝑖𝑡𝑡 Quantity of delivered blood from BDGi toMBFn in period t, 0 otherwise
𝑄𝑄𝑌𝑌𝑋𝑋𝑖𝑖𝑖𝑖𝑡𝑡 Quantity of delivered blood fromTBF
j toMBFn in period t, 0 otherwise
𝐼𝐼𝑖𝑖𝑡𝑡 Quantity of inventory held inMBFn in period t
𝐵𝐵𝑖𝑖𝑡𝑡 Quantity of shortage in MBFn in period t
Using the abovementioned notations, the proposed problem can be formulated as follows.
1 1 ( n)
T t
t
12 12
1 2
2
, , , , , , , , ,
. t . t . t t. t . t
ij ij in in jn jn n n j j j j i j t i n t j n t n t j j t
MinZ =
∑
C QXT +∑
C QXM +∑
C QYM +∑
h I +∑
C YT(2) 1 , t t ij in j n
XT + XM ≥ ∀i t
∑
∑
(3)1 ,
t jn n
YM ≥ ∀j t
∑
(4). , ,
t t ij ij
QXT ≤ XT M ∀i j t (5)
. , ,
t t in in
QXM ≤ XM M ∀i n t (6)
. , ,
t t jn jn
QYM ≤YM M ∀j n t (7)
,
t t t
ij in i
j n
QXT + QXM ≤S ∀i t
∑
∑
(8),
t ij i
j
QXT ≤Cap ∀j t
∑
(9) ,t t
jn ij
n i
QYM ≤ QXT ∀j t
∑
∑
(10),
t s n n
I ≤Cap ∀n t (11) ,
t t p
in jn n
i j
QXM + QYM ≤Cap ∀n t
∑
∑
(12) 1,
t t t t
in jn n n
i j
QXM + QYM +I− =I ∀n t
∑
∑
(13),
t t t t
n n in jn
i j
B =D − QXM + QYM ∀n t
∑
∑
(14)1 2 1 2 1 , t j j j
YT ≤ ∀j t
∑
(15)1 2 1
2
1
, 1,
t t j j j j j
YT ≤YT − ∀j t
∑
(16)12 1,2
t j j j j
YT ≤ A ∀t
∑
(17)1 1
1 , ,
t t
ij j j j
XT ≤
∑
YT ≤ ∀i j t (18){ }
12
, , , 0, 1 , , , 0 &
t t t t t t t t
ij XMin YTj j YMjn QXTij QXMin QYMjn In integer
XT ∈ ≥
(19) The first objective function represented in equation (1) minimizes the maximum amount of shortage in demand points. As in this problem any shortage may lead to loss of lives (not profit), the min-max approach is much better than min-sum approach. We will linearized this objective later. Second objective function represented in equation(2), minimizes the summation of attributed costs, including transportation costs and blood process and holding costs. It is clear that these two objective functions are opposing each other.
Constraints (3) ensure that each blood donating group is covered by at least one temporary blood facility or one main blood facility in each period. Constraints (4) indicate that each temporary blood facility is assigned to a main blood facility. Constraints (5)-(7) ensure that there is a material flow as long as an entity is assigned to an upper echelon entity. Constraints (8) indicate the supply limitations in blood donating groups. Constraints (9) indicate the capacity limitations on temporary blood facilities. Constraints (10) indicate the limitations on delivered bold quantities to the main facilities. Constraints (11) and (12) indicate the capacity limitations in main blood facilities. Constraints (13) indicate the material flow balance in main blood facilities in each period. Constraints (14) indicate the shortage and unsatisfied demand amounts in each period. Constraints (15)-(18) ensure that the temporary blood facilities assignments and movements follow a feasible sequence in each period. Constraints (19) are the non-negativity and binary restrictions of variables.
As already mentioned, first objective function is a nonlinear equation which could easily be changed to a linear equation as following:
1 , 0 t t t t n t MinZ MaxShortage
MaxShortage B n t
MaxShortage t = ≥ ∀ ≥ ∀
∑
(20)Where (MaxShortaget ) stands for the possible maximum value of the Bkt.
2-1-Accounting for data uncertainty
Parameters of after disaster planning models are tainted with a huge degree of uncertainty. Modeling and investigating these problems without uncertainty considerations will not lead to a practical approach to be used in after disaster relief programs. Furthermore, as this problem deals with human life robustness of the solutions is in high regard in comparison with profit based problems. In order to deal with the uncertain nature of the problem, a robust possibilistic programming approach based on Me measure is applied to the proposed model. Me measure is one the most recent fuzzy measures in the literature.
2-2-Fuzzy mathematical programming approach
Fuzzy mathematical programming approach is one the frequently used programming approaches when addressing uncertainty along with flexible goals and elastic constraints. Possibilistic chance-constraint programming (PCCP) approach is one of the wide spread methods in the literature because of its ability on controlling the confidence level of constraints and its compatibility with different types of fuzzy numbers (Pishvaee et al., 2012a). Necessity (N) and Possibility (π) measures are representing the extreme attitude of the parameters. However, CCP models based on Credibility (Cr) measure are proven to be more effective (Pishvaee et al., 2012b). Given a trapezoidal fuzzy number, ξ=(d1,d2,d3,d4)where d1<d2<d3<d4.
While credibility measure is more flexible than two extreme optimistic and pessimistic measures, this approach provides DMs with a single moderate point between necessity and possibility. Xu and Zhou (Xu and Zhou,, 2013) developed a new fuzzy measure (Me measure) to provide a spectrum of decisions instead of a single moderate point. In equation(21), λ (0≤ ≤λ 1) is the tuning parameter which states the optimistic or pessimistic attitude of the DM.
( )
( )
(
1)
( )
Me ξ =λπ ξ + −λ N ξ (21)
(
)
(
)
(
)
(
)
1 1 1 21 2 1 2
2 1 2 1
2 3 2 3
3 4 3 4 3 4 4 3 4 3 4
0 1
1
,
1
0 1
r d r d
r d d r
d r d d r d
d d d d
Me r d r d Me r d r d
r d d r
d r d
d r d
d d
d d
r d
r d
λ λ λ
ξ λ ξ λ
λ λ λ ≤ ≤ − − ≤ ≤ + − ≤ ≤ − − ≤ = ≤ ≤ ≥ = ≤ ≤ − − + − ≤ ≤ ≤ ≤ − − ≥ ≥ 4 (22)
And ifξ≥0, based on equation(22), expected value using Me measure is calculated as follows:
(
)
0(
)
1 2 3 4
0
1
( ) ( )
2 2
Me
E ξ +∞Me ξ r dx Me ξ r dx λ d d λ d d
−∞
−
= ≥ − ≤ = + + +
∫
∫
(23)(
)
(
)
(
)
(
)
(
)
(
)
(
)
(
)
4 3 3 4 3 1 2 1 1 2 2 1 2 3 4 3 3 3 4 4 3 1 0.5 1 1 0.5 1 1 1 d d r d if r d d d d r dr d r d
d d
Me r
if d r d
d d
r d
r d r d
d d
α λ α
λ λ λ α
λ
λ α α
λ α
λ
ξ α
λ λ
α λ α
λ λ α
λ
− + −
−
< ⇒ + − ≥ ⇒ ≥
− − − − + ≥ ⇔ ≥ ≤ ≤ − ≤ ≥ ⇔ ≥ ⇒ ≤ ≤ − − + − + − ≥ ⇔ ≥ ≤ ≤ − − (24)
(
)
(
)
(
)
(
)
(
)
(
)
(
)
(
)
1 2 2 2 1 1 2 2 1 2 2 1 2 3 3 4 4 3 4 4 3 1 0.5 1 1 1 1 1 0.5 d d d r if r d d d d d rr d r d
d d
Me r
if d r d
d d
d r
r d r d
d d
α λ α
λ λ λ α
λ
α λ α
λ λ α
λ
ξ α
λ λ
α λ α
λ α
λ
− + −
−
< ⇒ + − ≥ ⇒ ≤
− − − − + − + − ≥ ⇔ ≤ ≤ ≤ − − ≥ ≥ ⇔ ≥ ⇒ ≤ ≤ − + − ≥ ⇔ ≤ ≤ ≤ −
(25)
In healthcare problems where they are highly sensitive to the uncertain parameters the main goal of managers is to satisfy the possibilistic chance constraints with a fairly high chance. So in these problems managers tend to develop a pessimistic approach rather than an optimistic one. In other words, the λ parameter would take a value less than 0.5.
To work more convenient we develop the compact form of the proposed model as follows:
{ }
1 2
, ( , ) 0,1
Min Z X
Min Z TY WX
X Y G x y
Y X 0 & integer
= = + ∈
∈ ≥
(26)
Now without losing any generality, assume that T and W vectors are representing the imprecise and fuzzy parameters of the model. Expected value operator is used to convert the objective functions to their crisp equivalent and Me measure is adopted to deal with constraints contain vague parameters. The parameters are assumed to follow a trapezoidal possibility distribution, 𝜉𝜉̃= (𝜉𝜉1,𝜉𝜉2,𝜉𝜉3,𝜉𝜉4). With these descriptions the (26) model can be reformulated as follows:
[ ]
{
}
{
}
{ }
1 2 , ( , ) 0,1Min Z X
Min E Z E T Y E W X
Me LX D
Me MY K
X Y F x y
Y X 0 & integer
α β = = + ≥ ≥ ≤ ≥ ∈ ∈ ≥
(27)
By applying transformations discussed in equations (23) through(25), the crisp equivalent of the model (27) is as follows:
[ ]
(
)
(
)
(
)
(
)
(
)
(
)
(
)
(
)
{ }
1
2 1 2 3 4 1 2 3 4
4 3
1 2
1 1
2 2 2 2
1 1 1 1 , ( , ) 0,1
Min Z X
Min E Z T T T T Y W W W W X
D D
LX
K K
MY
X Y F x y Y X 0 & integer
λ λ λ λ
α λ α
λ
β λ β
λ = − − = + + + + + + + − + − ≥ − − + − ≤ − ∈ ∈ ≥ (28)
While the (28) model deals with data ambiguity, it fails to track the objective function value’s deviation from the expected value. These deviations cost a lot especially in healthcare systems where any lost means human life. Secondly, in this approach the minimum confidence level of constraints are determined based on decision maker’s preferences which won’t necessarily lead into optimality. To fill out these shortcomings, a combination of robust programming and fuzzy programming approaches are introduced (Zahiri et al., 2014).
A robust solution has feasibility robustness along with optimality robustness (Pishvaee et al., 2012a). A solution is feasibly robust only if it remains feasible for all realizations of imprecise parameters and it is optimally robust if it the equivalent objective function value remains (near) optimal for all realizations of uncertain parameters. In classical robust possibilistic programming approach the Necessity measure is applied to deal with vague and imprecise data but as already discussed, Me measure provides a more realistic perspective of the problem for the decision makers. The Me-based robust possibilistic programming model is developed as follows:
[ ]
(
)
(
)
(
)
(
)
[ ]
(
[ ]
)
(
)
(
)
(
)
(
)
(
)
(
)
(
)
(
)
{ }
4 3 1 2
1 1 4 1
4 3 1 2
2 2 2 2 4 1
4 3 1 2 1 1 Z 1 1 1 1 Z 1 1 1 1 1 1 , ( , )
0,1 0 &
crisp
crisp Max
D D K K
Min E Z D K
D D K K
Min E Z Z E Z D K
D D
LX
K K
MY
X Y F x y
Y X
α λ α β λ β
σ δ
λ λ
α λ α β λ β
ψ σ δ
λ λ
α λ α
λ
β λ β
λ − + − − + − = + − + − − − − + − − + − ′ ′ = + − + − − + − − − + − ≥ − − + − ≤ − ∈
∈ ≥ integer, 0.5≤α β, ≤1
(29)
In model(29), the first term in both objective functions are the expected values of objective functions. For the second objective function the second term is minimizing the deviations of upper bound of objective function values from the expected values to control the optimality robustness of the solutions. The parameters ψ and ω are the preference weight parameters of the optimality robustness over the feasibility robustness. The last two terms of second objective function are controlling the feasibility robustness of the solutions. These terms minimize the violations of RHS of the chance constraints from their worst realized value of the uncertain parameters with penalty parametersδ σ δ σ, , ′ ′, . Interesting fact
about these penalty values is that they can be interpreted due to the problem context, for instance, shortage costs can easily be redefined into these parameters. The upper bound of the second and third objective functions are calculated as follows:
max
2 4 4
Z =T Y+W X (30)
3-Coping with objective functions
In the literature of multi objective optimization problems there are three main approaches to tackle with multi objective function problem; priori, interactive and posteriori classes (Deb, 2014). Interactive class of approaches accumulates the favorable features of the other two approaches while preventing the inefficiencies of them. In contrast with the priori approaches, interactive methods look into the
preferences of the DMs and generate Pareto-optimal solutions. In this study the interactive method proposed by Torabi and Hassini (2008), (TH) is applied to the proposed model. TH method is one of the most wide spread interactive approaches in coping with multi objective models. Interested readers may refer to (Lalmazloumian et al., 2016), (Farrokh et al., 2018), (Alavidoost et al., 2016), (Tofighi et al., 2016), (Mirmohseni et al., 2017) and (Mohammed and Wang, 2017).
The steps of the TH approach are as follows:
Calculate the positive/negative ideal solution (PIS & NIS) for each objective function Determine the following linear fuzzy membership function for each objective function:
( )
( )
( )
( )
1
( )
0 j
PIS
j j
NIS
j j PIS NIS
Z NIS PIS j j j
j j
NIS
j j
Z x Z
Z Z x
x Z Z x Z
Z Z
Z x Z
µ
<
−
= ≤ ≤
−
>
(31)
Convert the crisp multi-objective model into a single-objective model as follows:
(
)
[ ]
0
0 0
1
( )
( )
;
0,1
k k k
k
x
Max
w
x
x
k
x
F and
φτ
φ
µ
µ
τ
τ
+ −
≥
∀
∈
∈
∑
(32)
Where τ0indicate the minimum satisfaction degree of objective functions, ϕ and wk stand for the coefficient of compromise between objective functions and importance of the jth objective function. Determine the values of importance weight of the objective functions and coefficient of
compromise between objective functions and solve the single-objective model.
4-Implementation and evaluations
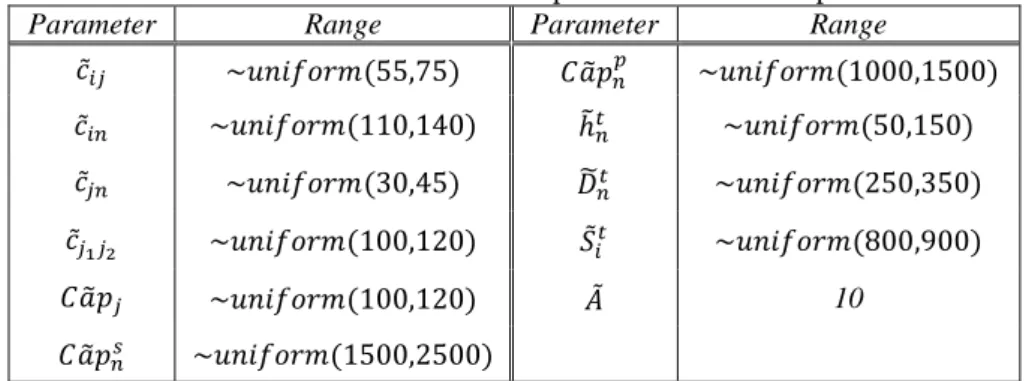
In this section the validation and performance of the proposed model solution approach is investigated by two test problems. All the proposed models are coded in GAMS 24.7.4 optimization software using CPLEX solver and all the executions are implemented on a Corei7 2.40 GHz laptop with 8 GB of RAM. Note that the triangular fuzzy numbers of given uncertain parameters are considered as
(0.9 , ,1.1 )ϕ ϕ ϕ . Problems size is 3*6*1*3 and 10*25*5*5 and input parameters follow a uniform
distribution. The parameter values for test problems are given in table 1.
Table 1. The numerical values of the parameters in the test problems
Parameter Range Parameter Range
𝑐𝑐̃𝑖𝑖𝑖𝑖 ~𝑢𝑢𝑢𝑢𝑢𝑢𝑢𝑢𝑢𝑢𝑢𝑢𝑢𝑢(55,75) 𝐶𝐶𝑎𝑎�𝑝𝑝𝑖𝑖𝑝𝑝 ~𝑢𝑢𝑢𝑢𝑢𝑢𝑢𝑢𝑢𝑢𝑢𝑢𝑢𝑢(1000,1500)
𝑐𝑐̃𝑖𝑖𝑖𝑖 ~𝑢𝑢𝑢𝑢𝑢𝑢𝑢𝑢𝑢𝑢𝑢𝑢𝑢𝑢(110,140) ℎ�𝑖𝑖𝑡𝑡 ~𝑢𝑢𝑢𝑢𝑢𝑢𝑢𝑢𝑢𝑢𝑢𝑢𝑢𝑢(50,150)
𝑐𝑐̃𝑖𝑖𝑖𝑖 ~𝑢𝑢𝑢𝑢𝑢𝑢𝑢𝑢𝑢𝑢𝑢𝑢𝑢𝑢(30,45) 𝐷𝐷�𝑖𝑖𝑡𝑡 ~𝑢𝑢𝑢𝑢𝑢𝑢𝑢𝑢𝑢𝑢𝑢𝑢𝑢𝑢(250,350)
𝑐𝑐̃𝑖𝑖1𝑖𝑖2 ~𝑢𝑢𝑢𝑢𝑢𝑢𝑢𝑢𝑢𝑢𝑢𝑢𝑢𝑢(100,120) 𝑆𝑆̃𝑖𝑖𝑡𝑡 ~𝑢𝑢𝑢𝑢𝑢𝑢𝑢𝑢𝑢𝑢𝑢𝑢𝑢𝑢(800,900)
𝐶𝐶𝑎𝑎�𝑝𝑝𝑖𝑖 ~𝑢𝑢𝑢𝑢𝑢𝑢𝑢𝑢𝑢𝑢𝑢𝑢𝑢𝑢(100,120) 𝐴𝐴̃ 10
𝐶𝐶𝑎𝑎�𝑝𝑝𝑖𝑖𝑠𝑠 ~𝑢𝑢𝑢𝑢𝑢𝑢𝑢𝑢𝑢𝑢𝑢𝑢𝑢𝑢(1500,2500)
The optimal solutions for test problems are presented in table 2. In these test problems the weight factor for the first objective function is always higher than the second one, as the shortage amounts in proposed model may lead to human casualties. As the weight factor for the first (second) objective function increases the optimal value of the corresponding objective decreases (increase). The τ0 is the minimum satisfaction degree of the objective functions and as it’s higher when the DM has a moderate attitude toward the problem. The most maximum value of TH objective function is obtained when there is a reasonable balance among objective functions satisfaction degrees. Note that the values of Z1and Z2 are calculated based on model (29).
Table 2. Results of test problems under proposed model (ϕ=0.1) Weight
factors
Test
problem MaxShortaget 𝑍𝑍1𝑐𝑐𝑐𝑐𝑖𝑖𝑠𝑠𝑝𝑝 𝑍𝑍2𝑐𝑐𝑐𝑐𝑖𝑖𝑠𝑠𝑝𝑝 τ0 ( )
j
Z x
µ TH value
(0.5,0.5) 1 (8,13,7) 3910 209736 0.88 (0.91,0.88) 0.848
2 (43,27,19,33,20) 15271 709203 0.84 (0.89,0.84) 0.838
(0.6,0.4) 1 (7,13,6) 3862 213640 0.83 (0.93,0.83) 0.864
2 (32,23,17,23,18) 14610 712939 0.80 (0.90,0.8) 0.850
(0.7,0.3) 1 (6,10,5) 3717 221406 0.79 (0.95,0.79) 0.888
2 (27,20,15,16,9) 14052 730081 0.78 (0.94,0.78) 0.877
(0.8,0.2) 1 (6,10,2) 3694 229687 0.77 (0.99,0.77) 0.924
2 (17,16,8,10,5) 13503 741507 0.76 (0.95,0.76) 0.895
(0.9,0.1) 1 (5,7,0) 3604 240037 0.75 (0.99,0.75) 0.938
2 (13,12,4,3,2) 13122 756320 0.73 (0.95,0.73) 0.906
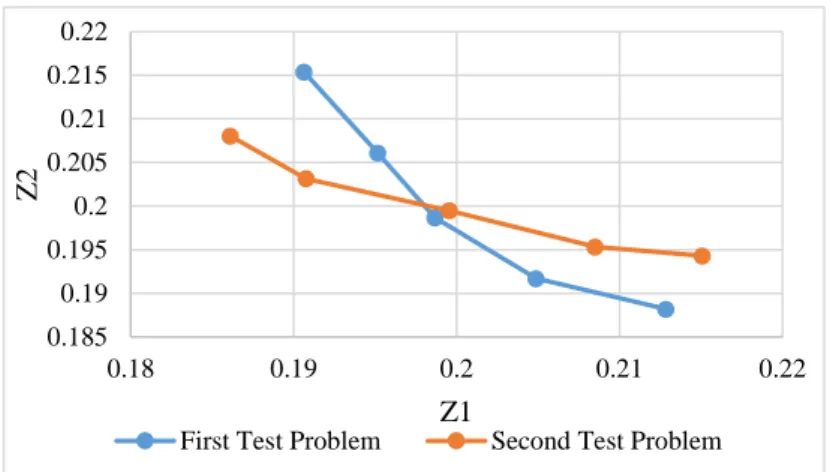
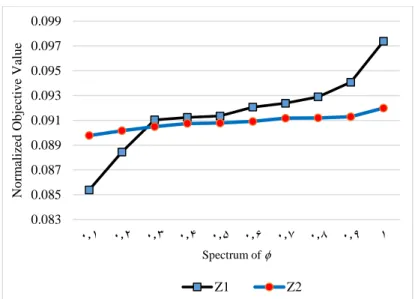
Figure 2 depicts the conflicts of objective functions, Z1 V.s. Z2, for normalized objective function values of both test problems presented in table 2. As expected, as the values of first objective decrease the values of the second objective function increase in both test problems. DMs can choose any pair of solutions based on their preferences. The parameter ϕ in TH approach plays a balancing role between objective functions minimum satisfaction degrees and summation of objective function satisfaction degrees. For small amounts of ϕ the importance of high weighted objective function is highlighted while for large values of ϕ the minimum satisfaction degree is given more importance in model(32). Figure 3 runs the gamut from 0.1 to 1 for the parameter ϕ. The weight factor for first objective function is high as it is the first priority in after disaster relief programs and that’s why first objective function values are more sensitive to the fluctuations of ϕ.
Fig 2.Normalized Pareto solutions for both test problems 0.185
0.19 0.195 0.2 0.205 0.21 0.215 0.22
0.18 0.19 0.2 0.21 0.22
Z
2
Z1
Fig 3. Normalized optimal objective function values for a spectrum of ϕ in TH approach (Test problem 1)
Finally, the behavior of the proposed model under different controlling parameters is studied. Maximum shortage amounts, objective functions values, objective function satisfaction degrees and TH objective function values are reported in table 3. Maximum shortage quantities are dependent on the values of ϕ in(32), in higher values of ϕ their values are like an upper bound for them in the lower values of ϕ. The parameters ω and ψ are indicating the penalty of violations in objective functions. For various values of these controlling parameter the general behavior of the proposed model is the same. The minimum value of λ in which the model is feasible is 0.5 and for a higher values the optimal solutions of the model in λ=0.8 is investigated. The constraints violations controlling parameters are considered to be equal to 0.6 which is indicating the relative importance of limitations on right hand side values of constraints
Table 3. Optimal solutions for second test problem, w (0.9, 0.1) and A=10
σ, σ',
δ, δ' ω ψ λ ϕ Max Shortage Z1 Z2 Zj( )
x
µ TH
value
0.6 50
100
0.5 0.2 0 13566 538111 (1,0.79) 0.849
0.8 0 13566 536021 (1,0.8) 0.836
0.8 0.2 0 13701 405289 (1,0.79) 0.940
0.8 (18,33,22,14,17) 14182 399058 (0.89,0.79) 0.832
200
0.5 0.2 0 14566 1020071 (1,0.8) 0.922
0.8 0 14566 1045082 (1,0.78) 0.832
0.8 0.2 0 14566 785637 (1,0.78) 0.830
0.8 (19,30,41,15,7) 15927 735272 (0.91,0.79) 0.803
150 100
0.5 0.2 0 14566 608291 (1,0.77) 0.873
0.8 (0,0,4,0) 14570 536021 (0.99,0.8) 0.947
0.8 0.2 0 14566 396635 (1,0.79) 0.943
0.8 0 14746 391668 (1,0.8) 0.901
200
0.5 0.2 0 14566 1206740 (1,0.76) 0.935
0.8 (0,0,12,5,0) 14583 1023263 (0.98,0.79) 0.876
0.8 0.2 0 14566 840692 (1,0.76) 0.907
0.8 0 14566 748123 (1,0.79) 0.903
300 100
0.5 0.2 0 15566 540113 (1,0.79) 0.904
0.8 (0,20,27,0,0) 15613 536032 (0.97,0.8) 0.891
0.8 0.2 (0,1,0,4,4) 15907 392073 (0.99,0.8) 0.963
0.8 (17,18,19,20,15) 15677 392490 (0.91,0.8) 0.875
200
0.5 0.2 (0,0,26,0,0) 15592 1023578 (0.96,0.79) 0.942
0.8 (0,12,26,0,0) 15604 1020071 (0.94,0.8) 0.931
0.8 0.2 (0,1,0,4,0) 15907 730453 (0.99,0.8) 0.938
0.8 (17,18,19,10,0) 15961 731486 (0.91,0.8) 0.862
0.083 0.085 0.087 0.089 0.091 0.093 0.095 0.097 0.099
۰٫۱ ۰٫۲ ۰٫۳ ۰٫۴ ۰٫۵ ۰٫۶ ۰٫۷ ۰٫۸ ۰٫۹ ۱
N
o
rm
al
ized
O
b
ject
iv
e V
al
u
e
Spectrum of ϕ
Z1 Z2
5-Conclusion
Health service management plays a profound role in human life. Blood service operations are considered as the key components of health service systems. The real-life problems are mostly considered as problems with highly uncertainty in their parameter values; disasters on the other hand, propagate these uncertainties. For dealing with epistemic uncertainty in input parameters of these problems, input parameters are assumed to follow a trapezoidal fuzzy number distribution and a robust possibilistic programming approach is applied to solve the proposed model. Proposed model is a dynamic, multi-objective location-allocation mathematical model for designing a blood supply chain for after disaster relief programs. The proposed model is consisted from three distinguishable set of nodes; blood donors, temporary blood collection facilities and processing and storage centers. Two objective functions are developed, including minimizing the maximum possible shortage and minimizing the total costs. To cope with the objective functions the Torabi-Hassini approach is applied. A set of Pareto optimal solutions is calculated to provide the managers with a wide range of possible solutions. Sensitivity analysis on the trade-off coefficient between objective functions and controlling parameters are provided. The proposed model proves to be useful especially in short-term after disaster relief programs.
Developing long-term planning programs and considering the perishability of blood products are possible direction for future research. Another direction can be extending the proposed model to tackle with blood SC management as an integrated planning period for before, during and after disaster.
References
Ahmadi-Javid, A., Seyedi, P., & Syam, S. S. (2017). A survey of healthcare facility location. Computers
& Operations Research, 79, 223-263.
Alavidoost, M. H., Babazadeh, H., & Sayyari, S. T. (2016). An interactive fuzzy programming approach
for bi-objective straight and U-shaped assembly line balancing problem. Applied Soft Computing, 40,
221-235.
Azadeh, A., Shafiee, F., Yazdanparast, R., Heydari, J., & Fathabad, A. M. (2017). Evolutionary multi-objective optimization of environmental indicators of integrated crude oil supply chain under
uncertainty. Journal of cleaner production, 152, 295-311.
Azarmand, Z., & Neishabouri, E. (2009). Location allocation problem. In Facility location (pp.
93-109). Physica, Heidelberg.
Beliën, J., & Forcé, H. (2012). Supply chain management of blood products: A literature
review. European Journal of Operational Research, 217(1), 1-16.
Berzigotti, A., & Bosch, J. (2016). increased cardiac output in cirrhosis–non‐invasive assessment of
regional blood flow by magnetic resonance angiography. Alimentary pharmacology &
therapeutics, 43(12), 1340-1342.
Deb, K. (2014). Multi-objective optimization. In Search methodologies (pp. 403-449). Springer,
Boston, MA.
Detti, P., Papalini, F., & de Lara, G. Z. M. (2017). A multi-depot dial-a-ride problem with heterogeneous
vehicles and compatibility constraints in healthcare. Omega, 70, 1-14.
Fahimnia, B., Jabbarzadeh, A., Ghavamifar, A., & Bell, M. (2017). Supply chain design for efficient
Farrokh, M., Azar, A., Jandaghi, G., & Ahmadi, E. (2018). A novel robust fuzzy stochastic
programming for closed loop supply chain network design under hybrid uncertainty. Fuzzy Sets and
Systems, 341, 69-91.
Gregor, P. J., Forthofer, R. N., & Kapadia, A. S. (1982). An evaluation of inventory and transportation
policies of a regional blood distribution system. European Journal of Operational Research, 10(1),
106-113.
Heddle, N. M., Liu, Y., Barty, R., Webert, K. E., Whittaker, S., Gagliardi, K., ... & Owens, W. (2009). Factors affecting the frequency of red blood cell outdates: an approach to establish benchmarking
targets. Transfusion, 49(2), 219-226.
Lalmazloumian, M., Wong, K. Y., Govindan, K., & Kannan, D. (2016). A robust optimization model
for agile and build-to-order supply chain planning under uncertainties. Annals of Operations
Research, 240(2), 435-470.
Mirmohseni, M. S., Nasseri, S. H., & Zabihi, A. (2017). An Interactive Possibilistic Programming for
Fuzzy Multi Objective Solid Transportation Problem. Applied mathematical sciences, 11(45),
2209-2217.
Mohammed, A., & Wang, Q. (2017). The fuzzy multi-objective distribution planner for a green meat
supply chain. International Journal of Production Economics, 184, 47-58
Møller-Jensen, L., & Kofie, R. Y. (2001). Exploiting available data sources: location/allocation
modeling for health service planning in rural Ghana. Geografisk Tidsskrift-Danish Journal of
Geography, 101(1), 145-153.
Mousazadeh, M., Torabi, S. A., Pishvaee, M. S., & Abolhassani, F. (2018). Health service network
design: a robust possibilistic approach. International Transactions in Operational Research, 25(1),
337-373.
Oztekin, A., Pajouh, F. M., Delen, D., & Swim, L. K. (2010). An RFID network design methodology
for asset tracking in healthcare. Decision Support Systems, 49(1), 100-109.
Pishvaee, M. S., Razmi, J., & Torabi, S. A. (2012 a). Robust possibilistic programming for socially
responsible supply chain network design: A new approach. Fuzzy sets and systems, 206, 1-20.
Pishvaee, M. S., Torabi, S. A., & Razmi, J. (2012 b). Credibility-based fuzzy mathematical
programming model for green logistics design under uncertainty. Computers & Industrial
Engineering, 62(2), 624-632.
Rais, A., & Viana, A. (2011). Operations research in healthcare: a survey. International transactions in
operational research, 18(1), 1-31.
Smith‐Daniels, V. L., Schweikhart, S. B., & Smith‐Daniels, D. E. (1988). Capacity management in
health care services: Review and future research directions. Decision Sciences, 19(4), 889-919.
Tofighi, S., Torabi, S. A., & Mansouri, S. A. (2016). Humanitarian logistics network design under
mixed uncertainty. European Journal of Operational Research, 250(1), 239-250.
Torabi, S. A., & Hassini, E. (2008). An interactive possibilistic programming approach for multiple
objective supply chain master planning. Fuzzy sets and systems, 159(2), 193-214.
Xu, J., & Zhou, X. (2013). Approximation based fuzzy multi-objective models with expected objectives
and chance constraints: Application to earth-rock work allocation. Information Sciences, 238, 75-95.
Zahiri, B., Tavakkoli-Moghaddam, R., & Pishvaee, M. S. (2014). A robust possibilistic programming
approach to multi-period location–allocation of organ transplant centers under uncertainty. Computers
& Industrial Engineering, 74, 139-148.
Zepeda, E. D., Nyaga, G. N., & Young, G. J. (2016). Supply chain risk management and hospital