The Role of Age in TMD: a Case-Control
Study
By
Vanessa e. Miller
A Master's Paper submitted to the faculty of the University of North Carolina at Chapel Hill
In partial fulfillment of the requirements for the degree of Master of Public Health in
the Public Health Leadership Program.
Chapel Hill
Table of Contents
Abstract ... 1
1. Introduction ... 3
2. Research Design and Method ... 5
2.1 Subjects ... 5
2.2 Measures ... 6
2.3 Procedures ... 7
2.4 Statistical methods ... 8
3. Results ... 9
4. Discussion ... 13
Appendix ... 17
Table of Tables
Table 1. Number of Healthy controls and cases by age group ... 9
Table 2. Number (percent) of TMD cases and controls in each age group-demographic age cutpoints ... 10
Table 3. Means by case status for study variables. All p values <.001 Calculated using Proc Means by case status ... 17
Table 4. Pearson correlation coefficients by case status for study variables ... 18
Table 5. High and low scores on the Speilberger State Anxiety Scale by case status ... 19
Table 6. High and low scores on the Speilberger Triat Anxiety Scale by case status ... 19
Table 7. High and low scores on the Perceived Stress Scale by case status ... 19
Table 8. Mean age for each recruitment source ... 20
Table 9. Number of cases and controls by recruitment source ... 20
Table of Figures
Figure 1. STAIY-1 Spielberger State Anxiety Score by age group among healthy controls n=20121
Figure 2. STAIY-1 Spielberger State Anxiety Score by age group among cases N=199 ... 22
Figure 3. STAIY-2 Spielberger Trait Anxiety Score by age group among healthy controls n=201 23
Figure 4. STAIY-2 Spielberger Trait Anxiety Score by age group among cases n=199 ... 24
Figure 5. Perceived Stress Scale by age group among healthy controls n=201 ... 25
Figure 6. Perceived Stress Scale by age group among cases n=199 ... 26
Figure 7. Algometer reading of mean pressure pain threshold by age group among healthy
controls n=201 ... 27
Figure 8. Algometer reading of mean pressure pain threshold by age group among cases n=201
··· 28
Figure 9. Mean thermal pain threshold by age group among healthy controls n=201 ... 29
Figure 10. Mean thermal pain threshold by age group among cases n=199 ... 30
Figure 11. Profile of Mood States Subscale Confident-Unsure by age group among healthy
controls n=201 ... 31
Figure 12. Profile of Mood States Subscale Confident-Unsure by age group among cases n=199
Abstract
The role of age in the relationship of psychological stress and chronic pain conditions is
not well understood. This study employs a case-control design to examine the relationship
between age and temporomandibular disorder (TMD). Cases were 199 females with clinically
diagnosed TMD. Controls were 201 females without TMD. The mean ages ofTMD cases and
controls were 36.7 and 29.8 years respectively. Age was evaluated as a possible confounding or
effect-modifYing variable. Potential interactions of age with psychological stress, clinical, and
pain variables were analyzed with bivariate procedures. Correlation with study variables and age
was measured with age groups and age as a continuous variable. Measures of psychological
stress, anxiety, clinical pressure measurement, and sensory testing showed a correlation with age
or age group. This information as well as comparisons of means among age groups for study
variables was used to select variables for a multivariate binary logistic regression model to
estimate odds ratios ofTMD. High stress scores were positively associated with TMD case status
(OR =2.53; 95% CI 1.65-3.90) relative to low stress scores. The odds ratio for age was 1.05
(95% CI 1.03-1.07) which indicated a 5% increase in odds ofTMD per year of age.
Selection bias among recruitment was explored as a possible explanation for the
relationship of case status with age. However, comparison of age among participants recruited
from two separate sources showed only slight and non-significant differences.
The contribution of this research is a finding of a positive relationship of age and TMD.
These findings conflict with previous findings reported in the literature that shows an inverse
relationship with age. Additionally, this trend indicates an important need for education and
Recommendations are made for future research. Improved training for dentists and physicians is
1.
Introduction
The burden of chronic pain on the health of the public has been well documented.
Increased rates of healthcare utilization (Von Korff et al, 1991) and increased days missed work
have been linked to chronic pain (Bowsher, Rigge, and Sopp, 1991 ). It is difficult to estimate the
true cost of chronic pain in the population. Mood and psychological problems complicate the
experience of chronic pain from a treatment standpoint as well as a quality of life issue. Elevated
rates of depression and stress have been reported among people with chronic pain (Von Korff et
al, 1993).
With the increasing median age of the population, the clinical importance of age-related
conditions will escalate over the next few decades .. Data from the first National Health and
Nutrition Examination Survey (NHANES I) reported the overall mean age of 416 people with
chronic pain to be 51.2 years (SD 13.0) compared to a mean age of 44.0 (SD 13.9) among those
without chronic pain (Magni, Caldieron, Rigatti-Luchini and Merskey, 1990). According to the
State of Aging and Health in America Report issued by the CDC (2007), "By 2030, the number
of Americans aged 65 and older will more than double to 71 million older Americans,
comprising roughly 20 percent of the U.S. population. In some states, fully a quarter of the
population will be aged 65 and older. An enhanced focus on promoting and preserving the health
of older adults is essential to effectively address the health and economic challenges of an aging
society. The cost of providing health care for an older American is three to five times greater
than the cost for someone younger than 65 years. By 2030, the nation's health care spending is
projected to increase by 25% due to demographic shifts unless improving and preserving the
health of older adults is more actively addressed." The growing size of US citizens aged over 65
People 2010 does not address age as a health priority. Furthermore, the Healthy People 2010
focuses only on pain in three specific conditions-pain due to arthritis, osteoporosis, and chronic
back conditions. Within this section the goal set forth is to "increase the mean number of days
without severe pain among adults who have chronic joint symptoms" (U.S. Department of
Health and Human Services, 2000).
The same impact on quality oflife can be seen among young adults who suffer from
chronic pain. TMD is a chronic condition characterized by pain in the jaw, temple, ear, and in
front of the ear. Symptoms include pain with opening the mouth that can adversely affect eating,
talking and other daily activities. In addition to jaw pain, women seeking treatment for TMD are
more likely to report severe headaches, gastrointestinal disorders, anxiety, psychiatric treatment
and sore throats when compared with age matched patients from a general dental clinic (de
Leeuw, Klasser and Albuquerque, 2005). The high prevalence of co-morbid conditions
complicates the treatment of TMD patients.
Epidemiologic studies have reported prevalence ofTMD that range from 6% to 23% in
the general population. Lipton (1993) reported prevalence rates of 5,289 and 1,415 per 100,000
for jaw joint pain and face pain respectively in a study conducted in 1989 involving a sample of
45,711 U.S. households from the National Health Interview Survey (NHIS). Macfarlane (1991)
mailed a questionnaire to a random sample of 2504 people ages 18-65 years sampled from a
medical practice and found that 473 (23%) reported orofacial pain. Such high prevalence
estimates underscore the public health concern of this condition.
Some studies find that the age of onset of TMD is lower than other chronic pain
conditions, but findings are inclusive. Von Korff, Dworkin, Le Resche, and Kruger (1988)
aged 65 and older. This purpose of tills current research is to contribute to the scant body of
knowledge related to age and TMD willie demonstrating a systematic approach to exploring the
association between age and TMD in a case-control study.
2. Research Design and Method
2.1
Subjects
In tills case control study of chronic jaw pain, cases were 199 Caucasian women.
Controls were 201 healthy Caucasian women without a history of chronic jaw pain and free of
TMD verified by examination. All study participants were aged between 18 and 60 years. The
199 TMD cases were diagnosed by clinical examination. The rationale for limiting enrollment to
Caucasians was the genetic focus of the funding grant of the parent study. Participants were
limited to female sex due to the increased prevalence of TMD among women. Chronic facial
pain is almost three times more likely to be reported by women than men (Velley, Gomitsky, and
Philippe, 2003). Participants were recruited from the Orofacial Pain Clinic at the UNC-Chapel
Hill School of Dentistry as well as from the community with the use of fliers, mass informational
emails sent to the UNC population (both students and staff), and advertisements in newspaper
and radio. The Oro facial Pain Clinic at the School of Dentistry at UNC-Chapel Hill is a specialty
clinic staffed by dentists with specialized training in pain conditions, including diagnosis and
treatment including pain management. Patients come to the clinic through referral from dentists,
physicians, and self-referral. All potential participants underwent a phone-screening interview.
Exclusion criteria were diagnoses of any one of diabetes, kidney disease, heart failure, chronic
respiratory disease, epilepsy or seizure disorder, or illgh blood pressure not controlled with
radiation or chemotherapy were similarly excluded from participation as were participants with
trauma or surgery on the head, face or neck within the last six months. Research was conducted
under the approval of the UNC-Chapel Hill Institutional Review Board (IRB). Informed consent
was obtained from each participant after an explanation of the risks and benefits involved in
participating in the research study.
2.2 Measures
Research participants completed a battery of standard validated psychosocial
questionnaires. The Perceived Stress Scale (PSS) asks about perceptions of distress and coping
ability with responses coded on a 5-point scale. Each of the 10 questions is prefixed with the
words, "How often you felt or thought a certain way ... ?" with answers from "never" to "very
often". The reference interval is the preceding month. By sunnning responses across the I 0
items, the PSS yields a single, overall rating (Cohen et al., 1983) with higher scores denoting
greater stress. The Profile of Mood States-Bi-Polar (POMS- BI) consists of 72 mood-related
items rated using a 4-point scale. Responses for the POMS-BI range from "Much unlike this" to
"Much like this". The POMS-BI is scored creating 6 subscales measuring affective dimensions
of mood including depression (Lorr and McNair, 1988). The Spielberger State and Trait Anxiety
Inventory (STAI) each contain 20 statements such as "I feel calm" or "I am worried" with the
responses options from "not at all" to "very much so". Ten of the items are reverse scored to
create an overall score of anxiety (Spielberger et al., 1983). The term "state anxiety" is used to
describe anxiety felt at the time of questionnaire completion while "trait anxiety" refers to the
same items with instructions for participants to answer the questions in the context of how they
2.3
Procedures
Participants took part in a two-hour laboratory session at the University of North Carolina
at Chapel Hill. The session included physical examination for TMD, quantitative sensory testing
using heat, pressure pain threshold testing, and a blood sample collection. Standardized
examination for the presence ofTMD based on Research Diagnostic Criteria (Dworkin, 1992)
was performed on each participant by a calibrated clinical examiner. Examination consisted of a
query regarding pain within the last month, measurements of range of motion on jaw opening
and excursive mandibular movements, assessments of joint sounds, manual palpation of the
masseter and temporalis muscles as well as three sites on the TM joint. Participants were
classified as TMD cases or non-cases. Cases must have reported pain within the last month and
reported pain upon palpation in at least 3 muscle groups (for a diagnosis of myalgia) and/or at
least 1 painful joint site (for a diagnosis of arthralgia). Only four cases were classified as
arthralgia only, the remaining 196 were either classified as myalgia or both myalgia and
arthralgia. Controls were non-cases, i.e., without a history of jaw pain.
Pressure pain thresholds were measured using a flat-tipped algometer (Pain Diagnosis
and Treatment, Great Neck, NY, USA) applied to muscle sites (Temporalis and Masseter) and
the TMjoint. Pressure was applied at a steady rate of !kg/second until the participant indicated
that she felt pain. Two readings of pressure in kg were obtained to calculate an average reading.
The mean value of these readings was recorded as the pressure pain threshold at each site.
Sensory testing was performed using a standardized procedure of quantitative sensory
testing widely used in pain research (See Edwards and Fillingim 2007). A computer-controlled
thermal testing unit Medoc Thermal Sensory Analyzer (TSA- 2001Medoc Ltd, Ramat Yishai,
Israel) was used to measure thermal threshold and tolerance to heat stimuli placed on the ventral
Threshold was assessed by instruction to the participant to press a button on a computer mouse at
the first painful sensation from the heat. Mean values were obtained by performing the test four
times, moving the thermode to a new site for each test. Tolerance was assessed using the same
paradigm with the instructions to press the mouse button when the painful sensation becomes
intolerable.
Resting blood pressure and heart rate measurements were also recorded during a
seven-minute seated rest period.
2.4
Statistical methods
Summary descriptive statistics were used to identifY variables of interest. Box and
whisker plots and frequency tables were calculated. Mean values for controls and cases were
calculated and then compared using t- tests. Potential interactions of age with psychological
stress, clinical, and pain variables were analyzed with bivariate procedures. Correlation with
study variables and age was measured with age groups and age as a continuous variable. Age
was collapsed into categories based on the distribution of age in the control sample. Four age
groups were defined at 18-22,23-25,26-35, and 36-60 years. Age was also examined using
standard demographic cut-points 18-24,25-34,35-44, and 45-60.
This information as well as comparisons of means among age groups for study variables
was used to select variables for a multivariate binary logistic regression model to estimate odds
ratios ofTMD.
Binary logistic regression was performed with TMD case status as the dependent variable
and age as the main exposure. Age was also collapsed into decade by dividing the continuous
variable by ten. To statistically adjust for covariates that showed some relationship with age,
score, heat threshold mean, and algometer pressure threshold measure from the TM joint were
added to this model to estimate odds ratios. Repeating the model using only the sample of
participants from the community tested the influence of selection bias.
The data analysis for this paper was generated using SAS/STAT® software, Version 9.2
of the SAS System for Windows. Copyright© 2002-2008 by SAS Institute Inc. SAS and all
other SAS Institute Inc. product or service names are registered trademarks or trademarks of
SAS Institute Inc., Cary, NC, USA.
3.
Results
The case control study was nested within a larger case-control study of 684 chronic pain
patients with a variety of chronic pain conditions including migraine, fibromyalgia, irritable
bowel syndrome, and vulvar vestibulitis syndrome. In all, 272 (29.8%) participants were
ineligible to participate in the sub-study due to race/ethnicity, medical history, or pain
classification/diagnosis. Six (0.008%) participants were not included in analysis due to missing
data. Five (0.007%) participants were excluded due to questionable diagnosis and/or
inconsistencies in case status. Of 400 participants in the case control study, 199 were classified
as meeting Research Diagnostic Criteria for TMD case status and 20 I were pain-free healthy
controls. The mean age was 36.7 and 29.8 and years for healthy cases and controls respectively.
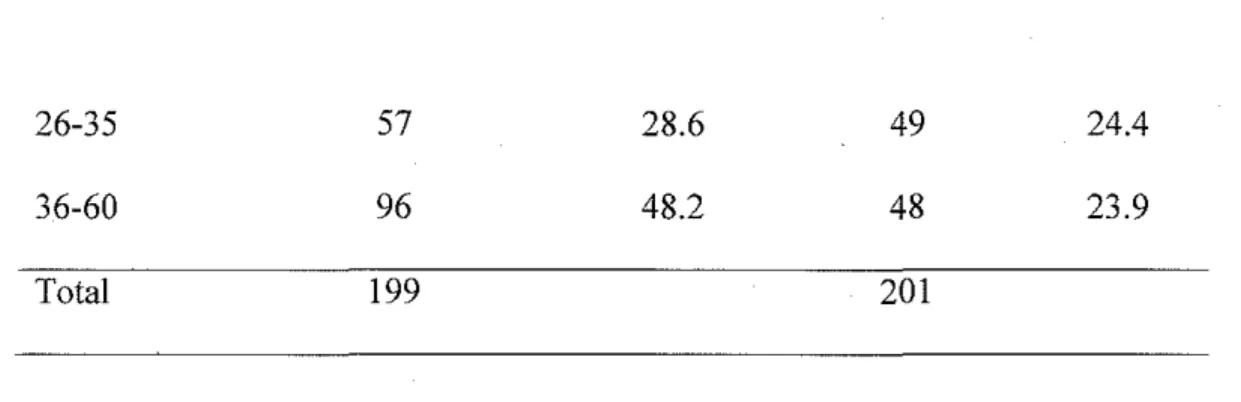
See tables 1 and 2 for the number of participants in each age group by case status.
Table 1. Number of Healthy controls and cases by age group
Age Group Healthy
(years) TMD Case (N) (%) Control (N) (%)
18-22 25 12.6 64 31.8
26-35 57 28.6 49 24.4
36-60 96 48.2 48 23.9
Total 199 201
Table 2. Number (percent) of TMD cases and controls in each age group-demographic age cut points Age Group
(years) TMD Case (N) (%) Control (N) (%)
18-24 41 20.6 93 46.3
25-34 57 28.6 57 28.4
35-44 41 20.6 22 10.9
45-60 60 30.2 29 14.4
Total 199 201
The odds of being a TMD case were elevated 1.05 95% CI (1.03-1.07) with each year of
age. When age was categorized by decade, the odds of being a case increased to 1.66, 95% CI
(1.38-1.98) with each decade of age.
The first hypothesis was age difference observed could be attributed to another factor
influenced by age. In a prospective cohort study, Slade eta/., (2007) reported, "Depression,
perceived stress, and mood were predictive of2- to 3-fold increases in risk ofTMD." Stress was
evaluated three ways in the research study using three reliable and validated questionnaires: 1)
the Perceived Stress Scale (1983), 2) the Spielber.ger State and 3) Trait (1982) anxiety scales.
The term "state anxiety" is used to describe anxiety felt at the time of questionnaire completion
while "trait anxiety" refers to the same items with instructions for participants to answer the
generated from continuous scores by using the mean value for healthy controls as the cut-point.
TMD consistently cases were assigned into the high scoring category on each measure: 75%,
62% and 70% respectively for the Spielberger State (STAIY -1 ), Spielberger Trait (STAIY -2),
and Perceived Stress Scale (PSS) scales. Appendix Tables 7, 8, and 9 show the number of
participants in each dichotomized group. High scores on these measures were positively
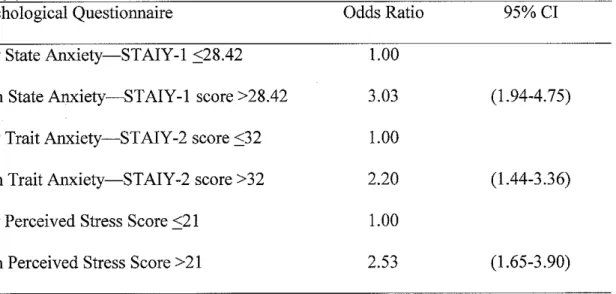
associated with TMD case status. The odds of being a TMD case were three-fold among those
who scored high on the State Anxiety ST AIY -1 questionnaire. See table 3 for odds ratios for all
three questionnaires measuring stress and anxiety.
Table 3. Unadjusted odds ratios of TMD {95% confidence interval) based on high relative to low scores on three stress and anxiety questionnaires
Psychological Questionnaire Odds Ratio 95% CI
Low State Anxiety-STAIY-1 ::::28.42 1.00
High State Anxiety-STAIY-1 score >28.42 3.03 (1.94-4.75)
Low Trait Anxiety-STAIY -2 score ::;32 1.00
High Trait Anxiety-STAIY-2 score >32 2.20 (1.44-3.36)
Low Perceived Stress Score ::;21 1.00
High Perceived Stress Score > 21 2.53 (1.65-3.90)
Considering high stress to be associated with TMD, the relationship between stress and
age was explored using box and whisker plots of the mean scores by age group. See Appendix
Figures 1-6. Only the oldest age group had slightly higher scores on the PSS. This difference was
small and not statistically significant. Therefore, age does not appear to be associated with stress
when case status is not included in the analysis. Age was weakly but significantly positively
pressure, and mean heart rate. These correlations were evident in the entire study sample and in
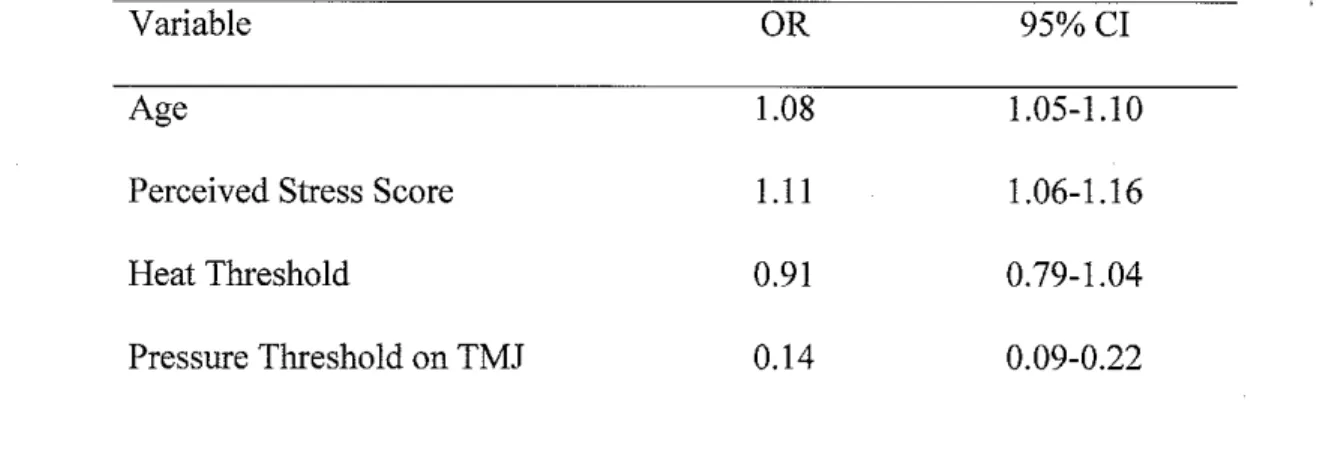
each diagnostic group. The unadjusted OR of 1.04 95% CI (1.02-1.06) and an adjusted OR of
1.08 95% CI (1.04-1.1 0) when the three variables discussed above were included in the model.
Table 4 shows the outcome of this analysis.
Table 4. Odds ratios for study variables correlated with age
Variable OR 95%CI
Age 1.08 1.05-1.10
Perceived Stress Score 1.11 1.06-1.16
Heat Threshold 0.91 0.79-1.04
Pressure Threshold on TMJ 0.14 0.09-0.22
The last hypothesis tested was related to potential flaws in study design. If clinic patients
were older than those who responded to informational emails, the sample could be biased. This
would be a form of selection bias that could potentially explain the age difference between cases
and controls. To test this hypothesis, the sample was stratified by recruitment source and the
mean age from each source was calculated. The mean age of participants recrnited from the
clinic was 38.9 (SD=Il.9) years compared to a mean age of31.8 (SD=I1.8) of participants
recrnited from the community. The majority of participants (n=315) were recruited from the
community by way of mass informational emails, fliers, and advertisements in local newspapers
and local radio stations. The mean age ofTMD cases recruited from the community was 35.2
4.
Discussion
The analyses described in this paper demonstrate the relationship between age and TMD
case status. The difference in age between cases and controls withstood stratification of variables
that could be linked to age, such as stress and depression.
Selection bias was ruled out when referral sources were examined closely. Although
using multiple recruitment sources may not be ideal study design, in this particular example
recruitment source could not account for the relationship between age and TMD case status.
Should the cases in this study have been matched for age? A post hoc matching procedure is
possible but beyond the focus of this paper. As we have seen age is connected with TMD,
controlling for age would prevent analysis on the basis of age. Elimination of the variable as a
potential cause or risk factor requires ignoring an important covariate and obscures the larger
picture of understanding the determinants ofTMD.
The increase prevalence of TMD cases found in this study in an older population may be
due to several factors, such as unstudied and uncontrolled for variables. It may be that the onset
of TMD occurs later than previous research suggests, indicating an increased risk of chronic jaw
pain with increasing age. One prospective study of 1016 people found that the odds ratio for first
onset ofTMD pain relative to participants in the age group 18-44 was 0.80 and 0.65 for those in
the 45-64 group and the 65-74 age groups respectively (von Korff, Le Resche and Dworkin
1993). There are a few possible explanations for the difference among the data presented here
and the findings of von Korff and colleagues The von Korff study used a question of self-report
TMD pain whereas this study used clinical examination to determine case status. In contrast, a
similar case-control study of 183 clients of dental clinics including 83 patients with a diagnosis
of chronic masticatory myofascial pain (MFP) reported no association between age and risk of
Sweden found no relationship between age or gender among persons reporting chronic pain
(Andersson, Ejlertsson, Leden, and Rosenberg 1993). However, this study did not specifically
inquire about jaw pain, but used self-report questionnaire asking about pain lasting 3 or more
months along with a body diagram which included a label for "face" and "head" but not "jaw". A
report from the Nuprin pain survey (Sternbach 1986) found an "age-related decrease in the
prevalence of pain problems for all sites other than the joints." Joint pain associated with aging
could be caused by bone loss, osteoporosis, injury, joint degeneration or arthritic changes. All of
these health issues could contribute to the development ofTMD. Clinical examination is the
ideal standard for categorizing people as TMD cases for many reasons. Older people might be
less likely to report pain, may associate pain with aging and therefore not seek treatment or
might be more difficult to capture with questionnaire compared with an examiner who is able to
pinpoint the location of pain accurately. Examiner-validated classification ofTMD is one
important strength of this study. This method of clinical examination should provide much more
reliable valid results than a self-report symptom questionnaire.
One limitation of this study is the upper age limit for emollment. Since emollment for
this study was 18-60, the findings cannot directly address pain among older adults. Another
limitation of the study is the problem of generalizing to the general population. Recruitment in
from an orofacial pain specialty clinic and by advertisement is only targeting people who identify
as having chronic jaw or facial pain. Presumably, there is a period of time between the onset of
pain and treatment seeking. Macfarlane, Glenny and Worthington (200 I) published a review of
population-based epidemiological studies of orofacial pain. In their review, the authors note
studies using age groups are not consistent, making comparisons between studies difficult. The
age groups were developed using quartiles in the healthy control population, which in turn
resulted in younger age groups spanning smaller number of years.
In May 2009, the National Institutes of Health issued a call for research proposals
addressing "Mechanisms, Measurement, and Management of Pain in Aging: From Molecular to
Clinical" in response to a NIH exploratory workshop on the mechanisms and management of
pain in the elderly. The grant announcement cites studies in both community and clinical
settings that have reported an increase in the prevalence of chronic pain with age while
disproportionally fewer medical resources are spent on pain treatment for older adults than for
younger age groups. Also of concern is the 5-fold increased prevalence of pain among people in
the age range of 75-86 compared to the prevalence in the 25-34 years age group (National
Institutes of Health Pain Consortium 2007). Increased attention to the issue of pain among the
elderly is encouraging but increased funding for research is only one part of the solution.
Improvements in medical and dental education are needed to improve the ability of clinicians to
diagnose and treat TMD. Currently, dental and medical students receive limited training or
exposure to this complex disorder (Hampton 2008).
Research currently being conducted at the University ofNorth Carolina at Chapel Hill
and three other sites has emolled 3200 healthy participants between the ages of 18-44 to be
followed longitudinally over a period of 5 years (the OPPERA study-www.oppera.org). This
study holds promise for answering questions related to predictors of TMD as well as a clearer
epidemiologic picture of the disorder. This cohort will be able to provide information about the
age at onset of TMD symptoms as well as information about chronicity and treatment seeking.
In conclusion, this paper described the methods and findings of a case-control study of
conclusion was that the relationship existed after statistically controlling for study variables that
were thought to be correlated with age. TMD was found to be more common among women
over 30 compared to women 18-25. There was also a linear relationship between age and TMD
case status that indicates older people are more likely to have TMD. If this trend is reflected in
the general population there is a strong need for attention to chronic jaw problems as people
grow older.
Appendix
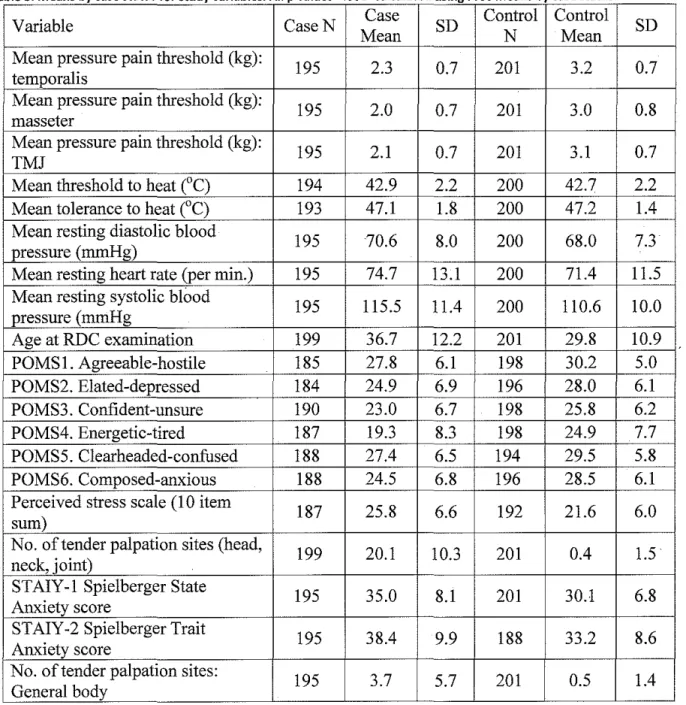
Table 3 Means by case status for study variables All p values< 001 Calculated using Proc Means by case status
Variable CaseN Case SD Control Control SD
Mean N Mean
Mean pressure pain threshold (kg):
195 2.3 0.7 201 3.2 0.7
temporalis
Mean pressure pain threshold (kg):
195 2.0 0.7 201 3.0 0.8
masseter
Mean pressure pain threshold (kg):
195 2.1 0.7 201 3.1 0.7
TMJ
Mean threshold to heat (°C) 194 42.9 2.2 200 42.7 2.2
Mean tolerance to heat (°C) 193 47.1 1.8 200 47.2 1.4
Mean resting diastolic blood
195 70.6 8.0 200 68.0 7.3
pressure (mmHg)
Mean resting heart rate (per min.) 195 74.7 13.1 200 71.4 11.5 Mean resting systolic blood
195 115.5 11.4 200 110.6 10.0
pressure (mmHg
Age at RDC examination 199 36.7 12.2 201 29.8 10.9
POMS1. Agreeable-hostile 185 27.8 6.1 198 30.2 5.0
POMS2. Elated-depressed 184 24.9 6.9 196 28.0 6.1
POMS3. Confident-unsure 190 23.0 6.7 198 25.8 6.2
POMS4. Energetic-tired 187 19.3 8.3 198 24.9 7.7
POMS5. Clearheaded-confused 188 27.4 6.5 194 29.5 5.8
POMS6. Composed-anxious 188 24.5 6.8 196 28.5 6.1
Perceived stress scale (1 0 item
187 25.8 6.6 192 21.6 6.0
sum)
No. of tender palpation sites (head,
199 20.1 10.3 201 0.4 1.5
neck, joint)
STAIY-1 Spielberger State
195 35.0 8.1 201 30.1 6.8
Anxiety score
STAIY-2 Spielberger Trait
195 38.4 9.9 188 33.2 8.6
Anxiety score
No. of tender palpation sites:
195 3.7 5.7 201 0.5 1.4
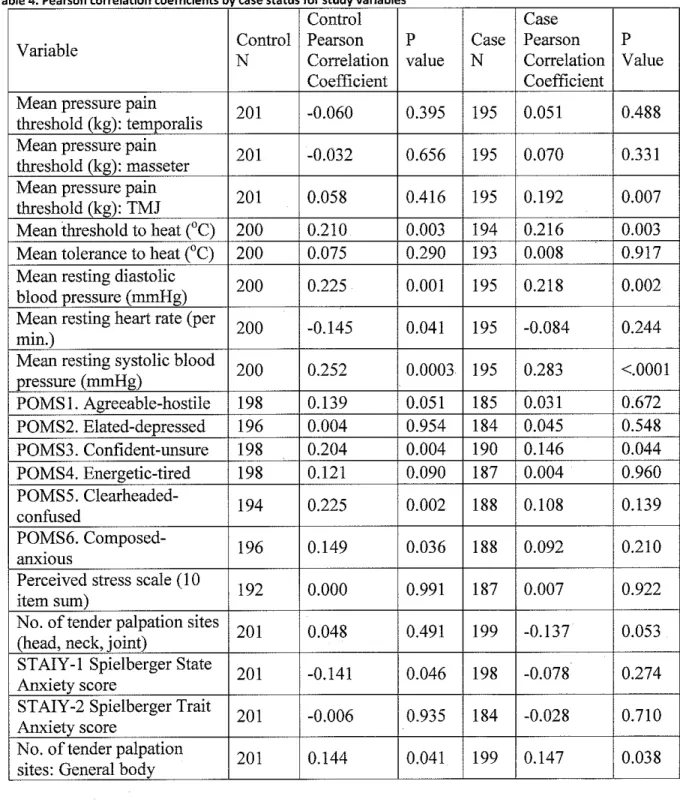
Table 4 Pearson correlation coefficients by case status for study variables
Control Case
Variable Control Pearson p Case Pearson p
N Correlation value N Correlation Value
Coefficient Coefficient
Mean pressure pain
201 -0.060 0.395 195 0.051 0.488
threshold (kg): temporalis Mean pressure pain
201 -0.032 0.656 195 0.070 0.331
threshold (kg): masseter Mean pressure pain
201 0.058 0.416 195 0.192 0.007
threshold (kg): TMJ
Mean threshold to heat ("C) 200 0.210 0.003 194 0.216 0.003 Mean tolerance to heat ("C) 200 0.075 0.290 193 0.008 0.917 Mean resting diastolic
200 0.225 0.001 195 0.218 0.002
blood pressure (mmHg) Mean resting heart rate (per
200 -0.145 0.041 195 -0.084 0.244
min.)
Mean resting systolic blood
200 0.252 0.0003 195 0.283 <.0001
pressure (mmHg)
POMS I. Agreeable-hostile 198 0.139 0.051 185 0.031 0.672
POMS2. Elated-depressed 196 0.004 0.954 184 0.045 0.548
POMS3. Confident-unsure 198 0.204 0.004 190 0.146 0.044
POMS4. Energetic-tired 198 0.121 0.090 187 0.004 0.960
POMS5.
Clearheaded-194 0.225 0.002 188 0.108 0.139
confused
POMS6.
Composed-196 0.149 0.036 188 0.092 0.210
anxwus
Perceived stress scale (I 0
192 0.000 0.991 187 0.007 0.922
item sum)
No. of tender palpation sites
201 0.048 0.491 199 -0.137 0.053
(head, neck, joint)
STAIY -1 Spielberger State
201 -0.141 0.046 198 -0.078 0.274
Anxiety score
STAIY-2 Spielberger Trait
201 -0.006 0.935 184 -0.028 0.710
Anxiety score
No. of tender palpation
201 0.144 0.041 199 0.147 0.038
Table 5. High and low scores on the Speilberger State Anxiety Scale by case status
State dependent anxiety TMD cases Healthy Controls
(n=l99) (n=201)
Low State Anxiety 49 (25%) 100 (50%)
(STAIYl Score g8.42)
High State Anxiety 150 (75%) 101 (50%)
(STAIYl Score >28.42)
Table 6. High and low scores on the Speilberger Triat Anxiety Scale by case status
Trait dependent anxiety TMD cases Healthy Controls
(n=199) (n=201)
Low Trait Anxiety 75 (38%) 113 (56%)
(STAIY2 Score :S:32)
High Trait Anxiety 124 (62%) 88 (44%)
(STAIY2 Score >32)
Table 7. High and low scores on the Perceived Stress Scale by case status
Perceived Stress Scale TMD cases Healthy Controls
(n=199) (n=201)
Low Stress 60 (30%) 105 (52%)
(PSS Score :S:21)
High Stress 139 (70%) 96 (48%)
Table 8. Mean age for each recruitment source
Recruitment Source N
Orofacial Pain Clinic 78
Connnunity 315
Mass informational email, advertisements, fliers, newspapers, radio
Other/Unknown 7
Table 9. Number of cases and controls by recruitment source
Mean age 38.9 31.8
34.7
Recruitment source TMD Case Healthy Control
Clinic 74 4
Connnunity 122 193
Other/Don't Know 3 4
Total 199 201
Table 10. Mean age for participants recruited from community
SD 12.0 11.8
8.9
Total
78
315
7
400
Diagnostic group TMD Case Healthy Control Total
N 122 193 315
60
0
B
r0 0
~
0 0
0 r r
(/)
z.
Q) 40 -r
,-'---")(
"
<(
2
ell
r '-+ r '
-Q;
r--±--
1-- ,-'---+l? 1-- +
Q)
.c
1--a;
·c.
(/)
~ 20
;;;:
f-(/)
0
18-22 23-25 26-35 36-60
Age Groups
80
0 0
~ 60 0
0
"
8
(/)
0
~
·x
<= .,;
2
c7l (i) 40
"'
:;;
.c +
a;
·a.
(/)
;;:
<(
f-(/)
20
0
18-22 23-25 26-35 36-60
Age Groups
60 ~ 0
"
en ~40 ·x"
<("'
~1-:;; C) :;; .0 a; ·a. en 'l'
?:: 20
<( 1-en 0 D D +
18-22 23-25
Age Groups
D D
26-35
+
36-60
80
~ 60
0 D D
"
(f)
z.
Q)")(
c:
<{
·~
>--a> 40
e' + +
Q)
.0
~
Q. (f)
"'
>-"'
>--(f) 20
0
18-22 23-25 26-35 36-60
Age Groups
50
0
40
0
E'
"
"'
E
~
~ 30
"
'"
0"'
"'
"'
"
+-5;
~ 20
·"
"
0 :;:;
"-10
0
18-22 23-25 26-35 36-60
Age Groups
50
0
0 0
40
'E
:::>
"'
E
~
~ 30
"
iii +
"
+ + +"'
"'
"'
!':!
'"
-g
20>
·;;
e
"
0..
10 0
0
18-22 23-25 26-35 36-60
Age Groups
18-22 23-25 26-35 36-60
Age Groups
5
0
4 0 0
-,
2 0
f-c; ~
"0
~3
"'
~ £
"
·;u
Q.
~ +
::>
~ 2
Q) +
~
Q.
"
"'
Q)
2
0
18-22 23-25 26-35 36-60
Age Groups
50
40
~ 20
Q) :;;
10
0
18-22 23-25 26-35 36-60
Age Groups
50
-,
D
~
40
$
D
0
.9-~ 30-.<::
.s
"'
0
.<::
"'
"
~
£; ffi 20
"
:2
10
-0
18-22 23-25 26-35 36-60
Age Groups
40
30
~
::> +
"'
"
+::J
-E
+"
+~ c
0 0
~ 20
0
"
"'
""
::>(/) (/) ::;;
0 0..
D D
10
0
18-22 23-25 26-35 36-60
Age Groups
40
30
~
"
"'
c
:::>
..!.
c
"'
+ +"0
"'
c0 +
(.)
~ 20
0 (.)
"'
.c"
Ul Ul
::;;
0 0..
10
0
18-22 23-25 26-35 36-60
Age Groups
References
Andersson HI, Ejlertsson G, Leden I, Rosenberg C (1993). Chronic pain in a geographically defined general population: Studies of differences in age, gender, social class, and pain localization. The Clinical Journal of Pain, 9, 174-182.
Bowsher D, Rigge M, Sopp L (1991). Prevalence of chronic pain in the British population: a telephone survey of 1037 households. The Pain Clinic, 4, 223-30.
Centers for Disease Control and Prevention and The Merck Company Foundation. The State of
Aging and Health in America 2007. Whitehouse Station, NJ: The Merck Company
Foundation; 2007.
Cohen S, Kamarck T, Mermelstein R (1983). A global measure of perceived stress. Journal of Health Social Behavior, 24, 385-396.
de Leeuw R, K.lasser GD, Albuquerque JC (2005). Are female patients with orofacial pain medically compromised? Journal of the American Dental Association, 136, 459-468.
Dworkin SF, LeResche L (1992). Research diagnostic criteria for temporomandibular disorders: review, criteria, examinations and specifications, critique. Journal ofCraniomandibular Disorders, 6, 301-355
Edwards R, Fillingim R (2007). Self-reported pain sensitivity: Lack of correlation with pain threshold and tolerance. The European Journal of Pain, 11, 594-598.
Hampton T (2008). Improvement needed in management of temporomandibular joint disorders.
Journal of the American Medical Association, 299, 1119-1121.
Lipton JA, Ship JA, Larach-Robinson D (1993). Estimated prevalence and distribution of
reported Oro facial pain in the United States. Journal of the American Dental Association,
124, 115-121.
Lorr, M, McNair, DM (1988). Manual for the Profile of Mood States Bipolar Form (POMS-BI). San Diego: Educational and Industrial Testing Service.
Macfarlane TV, Blinkhom AS, Davis RM, Ryan P, Worthington HV, Macfarlane OJ (2002). Orofacial pain: just another chronic pain? Results from a population-based survey. Pain,
99, 453-458.
Magni G, Caldieron C, Rigatti-Luchini S, Merskey H (1990). Chronic musculoskeletal pain and depressive symptoms in the general population. An analysis fo the I st National Health
National Institutes of Health Pain Consortium (2007). Mechanisms and Management of Pain in
the Elderly, Workshop Executive Summary, Accessed online October I· 2009 at
http:/ /painconsortium.nih.gov/NIAPain W orkshopSummary.html
Slade GD, Diatchenko L, Bhalang K, Sigurdsson A, Fillingim RB, Belfer I, Max MB, et. a!. (2007). Influence of psychological factors on risk oftemporomandibular disorders.
Journal of Dental Research, 86, 1120-1125.
Spielberger CD, Gorusch RL, Lushene R, Vagg PR, Jacobs GA (1983). Manual for the State-Trait Anxiety Inventory (FormYl). Palo Alto, CA: Consulting Psychologists Press.
Spielberger, C. D (1983). State-Trait Anxiety Inventory for Adults. Palo Alto, CA: Mind Garden.
Sternbach, R (1986). Survey of pain in the United States: the Nuprin pain report, Clinical Journal of Pain, 2, 49-53.
U.S. Department of Health and Human Services. Healthy People 2010. 2nd ed. With Understanding and Improving Health and Objectives for Improving Health. 2 vols. Washington, DC: U.S. Government Printing Office, November 2000.
Velly A, Gomitsky M, Philippe P (2003). Contributing factors to chronic myofascial pain: a case-control study. Pain, 104, 491-499.
Von KorffM, Dworkin SF, Le Resche L, Kruger A (1988). An epidemiologic comparison of pain complaints. Pain, 32, 173-183.
Von KorffM, Dworkin SF, Le Resche L (1990). Graded chronic pain status: an epidemiologic evaluation. Pain, 279, 91. ·
Von KorffM, Wagner EH, Dworkin SF, Saunders KW (1991). Chronic pain and use of ambulatory health care. Psychosomatic medicine, 53, 61-79.