R E S E A R C H A R T I C L E
Open Access
Sustained activation of mTORC1 in
macrophages increases AMPK
α
-dependent
autophagy to maintain cellular homeostasis
Hongjie Pan
1, Xiao-ping Zhong
2and Sunhee Lee
1*Abstract
Background:The mechanistic target of rapamycin complex 1 (mTORC1) is a well-conserved serine/threonine protein kinase that controls autophagy as well as many other processes such as protein synthesis, cell growth, and metabolism. The activity of mTORC1 is stringently and negatively controlled by the tuberous sclerosis proteins 1 and 2 complex (TSC1/2).
Results:In contrast to the previous studies usingTsc1knockout mouse embryonic fibroblasts (MEF) cells, we demonstrated evidence that TSC1 deficient macrophages exhibited enhanced basal and mycobacterial infection-induced autophagy via AMPKα-dependent phosphorylation of ULK1 (Ser555). These effects were concomitant with constitutive activation of mTORC1 and can be reversed by addition of amino acids or rapamycin, and by the knockdown of the regulatory-associated protein of mTOR, Raptor. In addition, increased autophagy in TSC1 deficient macrophages resulted in suppression of inflammation during mycobacterial infection, which was reversed upon amino acid treatment of the TSC1 deficient macrophages. We further demonstrated that TSC1 conditional knockout mice infected withMycobacterium tuberculosis, the causative agent of tuberculosis, resulted in less bacterial burden and a comparable level of inflammation when compared to wild type mice.
Conclusions:Our data revealed that sustained activation of mTORC1 due to defects in TSC1 promotes AMPKα-dependent autophagic flux to maintain cellular homeostasis.
Keywords:AMP-activated protein kinase (AMPK), Autophagy, Mechanistic target of rapamycin (mTOR),
Mycobacterium tuberculosis, Macrophages, Tuberous sclerosis 1 (TSC1)
Background
Autophagy is a fundamental and phylogenetically con-served self-degradation process that is characterized by the formation of double-layered vesicles (autophagosomes) around intracellular cargo for lysosomal delivery and pro-teolytic degradation [1, 2]. Autophagy is not only involved in cellular processes like nutrient regeneration and protein and organelle degradation, but also in clearance of intra-cellular pathogens, such as M. tuberculosis[3, 4]. Recent studies suggest that induction of autophagy in macro-phages is an effective mechanism to enhance intracellular killing ofM. tuberculosis, and that the ability of the patho-gen to inhibit this process is of paramount importance for
its survival [5, 6]. Autophagy is highly inducible via starva-tion, rapamycin, infection (virus, intracellular bacteria) and other cellular and environmental cues [2, 6]. The autopha-gosomal lipidated microtubule-associated protein 1 light chain 3 (LC3B-II) and the autophagy substrate sequestosome p62/SQSTM1 are often used to monitor autophagy [7, 8].
The best characterized regulator of autophagy is mTOR complex 1 (mTORC1). The rapamycin-sensitive mTORC1 kinase is composed of mTOR, regulatory-associated protein of mTOR (Raptor), mammalian lethal with SEC13 protein 8 (MLST8), the 40-kDa proline-rich Akt substrate (PRAS40), and DEP domain-containing mTOR-interacting protein (DEPTOR) [9]. Activation of mTORC1 depends on on the Ras-related GTPases (Rags) and Ras homolog enriched in brain (Rheb) GTPase and requires signals from amino acids, glucose, oxygen, energy * Correspondence:[email protected]
1Human Vaccine Institute and Department of Medicine, Duke University, Durham, NC 27710, USA
Full list of author information is available at the end of the article
(ATP), and growth factors (including cytokines and hor-mones such as insulin) [10].
mTORC1 positively regulates cell growth and prolifera-tion by promoting many anabolic processes, including bio-synthesis of proteins, lipids and organelles, and by limiting catabolic processes such as autophagy [11]. mTORC1 pro-motes protein synthesis by phosphorylating the eukaryotic initiation factor 4E (eIF4E)-binding protein 1 (4E-BP1) and the p70 ribosomal S6 kinase 1 (S6K1) [12, 13]. The phos-phorylation of 4E-BP1 inhibits its binding to eIF4E, enab-ling eIF4E to promote translation [14]. The stimulation of S6K1 activity by mTORC1 leads to increases in mRNA biogenesis, translation and elongation, and the translation of ribosomal proteins through regulation of the activity of many proteins such as ribosomal protein S6 [15]. The mTORC1 kinase negatively regulates autophagy by inhibit-ing the activity of the UNC-51-like kinase 1 (ULK1, a yeast Atg1 homolog) through direct phosphorylation. mTORC1 activity depends on diverse positive signals such as high en-ergy levels, normoxia, amino acids, and growth factors, all of which lead to the inhibition of autophagy [16]. Con-versely, mTORC1 is inhibited when amino acids are scarce and growth factor signalling is reduced, and/or ATP con-centrations fall, which results in activation of autophagy [17]. In addition, autophagy is regulated by AMP-activated protein kinase (AMPKα) that is widely recognized as a ubiquitous sensor of cellular energy status and regu-lates cellular metabolism to maintain energy homeosta-sis [18, 19]. Unlike the dependence of mTORC1 on various signals, AMPKαis activated only under low energy conditions. Under low nutrient conditions, AMPKα pro-motes autophagy by directly activating ULK1 through phosphorylation of Ser317, Ser555, and Ser777 [16, 20]. Under nutrient sufficiency, the active mTORC1 suppresses autophagy by phosphorylating ULK1 at Ser757 and affect-ing interaction between ULK1 and AMPKα[20, 21]. This coordinated phosphorylation is essential for ULK1 in au-tophagy induction.
One of the most important sensors involved in the regu-lation of mTORC1 activity is the tuberous sclerosis com-plex (TSC), which is a heterodimer comprised of TSC1 (also known as hamartin) and TSC2 (also known as tuberin) [11]. TSC1/2 works as a GTPase-activating pro-tein (GAP) for Rheb. The active, GTP-bound form of Rheb directly interacts with mTORC1 to stimulate its ac-tivity [22, 23]. TSC1 is known to stabilize TSC2 by form-ing a complex with TSC2 [24, 25] and the genetic data strongly implicate the complex between TSC1 and TSC2 as the functional unit for these tumour suppressors [24].
Based on the current knowledge of autophagy regula-tion by mTORC1 [26], our initial hypothesis was that sustained activation of mTOR impairs autophagy in TSC1fl/fl LysM-Cre+ mice and thus, TSC1fl/fl LysM-Cre+ mice infected with an intracellular human pathogen,
Mycobacterium tuerculosis, would have a significant bac-terial burdens and would succumb to M. tuberculosis infection. To our surprise, the TSC1fl/fl LysM-Cre+ mice infected with M. tuberculosis showed fewer bacteria in both spleens and lungs at the peak of infection. Further in vivo and in vitro analysis reveals that the unexpected autophagy dysfunction associated with loss of TSC1 in macrophages. Our results demonstrates that the com-plex interplay among mTORC1, AMPKα, and ULK1, and further highlights the importance of autophagy to sup-port the cellular homeostasis during host-mycobacteria interactions.
Results
Sustained activation of mTORC1 via loss of TSC1 led to enhanced accumulation of autophagic markers
Previous studies demonstrated that TSC1 deficient bone marrow derived macrophages (BMMϕ) constitutively acti-vated mTORC1 [27]. To determine how TSC1 deficiency affects autophagy, TSC1f/f LysM-Cre+ mice and TSC1f/
f
-ERCre+mice were used in in vivo and in vitro studies re-spectively. Since LysMcre mice allow for both specific and highly efficient Cre–mediated deletion of loxP–flanked tar-get genes in myeloid cells [28] andM. tuberculosisresides in macrophages during lung infection, we used TSC1f/
f
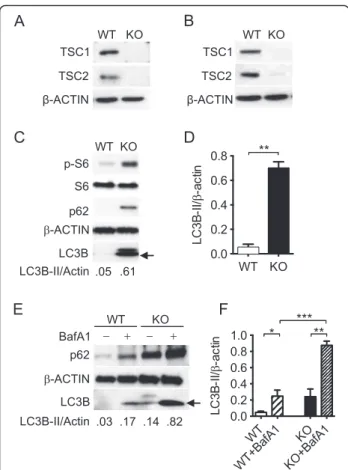
LysM-Cre+ mice for in vivo studies. For in vitro studies, we used tamoxifen-dependent Cre recombinases, so-called CreER recombinases, to generate time- and tissue-specific mouse mutants [29]. TSC1f/f-ERCre+BMMϕwere in vitro differentiated for 3 days [27], at which time BMMϕ size was similar to controls. Here TSC1 was not detected in both tamoxifen-treated BMMϕfrom TSC1f/f-ERCre+mice (Fig. 1a) and peritoneal macrophages from TSC1f/f LysM-Cre+ mice (Fig. 1b). TSC2 was also diminished in both macrophages, which indicates that TSC1 stabilizes TSC2 in macrophages and other cell types [30].
As compared with macrophages from wild type control mice, BMMϕ from TSC1 KO demonstrated increased mTORC1 activation as shown by elevated phosphoryl-ation of the mTORC1 downstream target S6 protein (Fig. 1c). Surprisingly, higher levels of LC3B-II were ob-served in TSC1 KO macrophages compared to WT coun-terparts, which is in contrast to the current knowledge that mTORC1 activation by TSC1/2 loss inhibits au-tophagy [31, 32]. A reduction in LC3B-II was observed in TSC1 and TSC2 KO mouse embryonic fibroblasts (MEFs) [33–35]. However, similar to the MEFs, TSC1 KO macrophages had increased levels of the autophagy substrate p62 (Fig. 1c).
indicates presence of autophagic flux while no change in-dicates inhibition of autophagic degradation. As shown in Fig. 1e and f, both LC3B and p62 proteins substantially accumulated after bafilomycin A1 treatment, indicating that there is ongoing autophagic flux in the TSC1 KO macrophages. In addition, the ratio of LC3-II of bafilomy-cin treated and untreated macrophages (BafA1 treated/ untreated) indicated that, TSC1 KO macrophages had a similar level of autophagic flux compared with wild type control (p= 0.7, data not shown). This result again con-firms that mTORC1 activity did not affect the LC3-II
transit through the autophagy pathway. Taken together, the the accumulation of autophagic markers and autopha-gic activity in the TSC1 KO macrophages suggest that the autophagy regulation in response to reduced TSC1 func-tion significantly differs among various cell types.
Suppression of mTORC1 activation in TSC1 KO macrophages resulted in reduced autophagic activity
To evaluate if and how mTOR activity affects autophagy in TSC1 deficient cells in the presence of an mTOR inhibitor, TSC1 KO BMMϕwere treated with rapamycin (Rapa). Phosphorylation of S6 was inhibited upon rapamy-cin treatment in TSC1 KO BMMϕ and WT BMMϕ, which indicates that rapamycin suppresses constitutively active mTORC1 (Fig. 2a). However, TSC1 KO BMMϕ treated with various concentrations of rapamycin greatly reduced LC3B protein levels while the opposite was true for WT BMMϕ. Interestingly, p62 protein levels were de-creased in both TSC1 WT and KO BMMϕ after 10 or 100 ng/ml rapamycin treatment (Fig. 2a). Similarly, two inhibitors of the Class III PI3K required for induction of autophagy, 3-methyladenine (3-MA) and wortmannin, greatly reduced LC3B protein levels in TSC1 KO BMMϕ while bafilomycin A1 treatment demonstrated the accu-mulation of LC3B-II, again confirming the presence of au-tophagic flux (Fig. 2b).
To directly examine the regulation of the autophago-some formation by mTORC1, we used a microscopy-based assay that quantified green fluorescent protein (GFP)-LC3 puncta formation in the absence and presence of rapamy-cin. LC3 was the first protein shown to specifically label autophagosomal membranes in mammalian cells, and sub-sequently EGFP-LC3 has become one of the most widely utilized reporters of autophagy [36]. Compared with the control, TSC1 KO BMMϕ showed higher numbers of puncta formation (Fig. 2c and d) without rapamycin treat-ment. However, TSC1 KO BMMϕtreated with rapamycin displayed a greatly reduced number of puncta while the same treatment increased the number of puncta in WT BMMϕ(Fig. 2c and d).
To further confirm this finding with genetic evi-dence, we generated a knockdown of RAPTOR, an es-sential component of mTORC1 complex [37], in TSC1
KO BMMϕ using shRNA. The knockdown of
RAP-TOR (TSC1 KO/RAPRAP-TOR KD) dramatically reduced LC3B protein and p-S6 levels in these cells (Fig. 2e). Taken together, the finding that the reduced activation of mTORC1 in TSC1 KO macrophages led to reduced autophagy rather than further increased autophagy, suggests that strong autophagy induction in the TSC1 KO macrophages may be used to degrade and recycle the cytoplasmic components and thereby to maintain the cellular homeostasis.
Fig. 1Loss of TSC1 led to sustained activation of the mTORC1 and to increased auto-phagosome formation. Representative Western blot of TSC1 and TSC2 in bone marrow macrophages from TSC1f/f -ERCre+mice (a) and in the resident peritoneal macrophages of TSC1fl/flLysM-Cre+mice (b) did not detect the TSC1 and TSC2 proteins. Isolated cells from mice were grown in 15 % L929 conditional medium for 4 days. 4-Hydroxytamoxifen at 2.5 mM was added into L929 conditioned culture medium for 2–3 days before use and the protein lysates were prepared.cImmunoblot showed significantly increased basal p-S6, LC3B-II (arrow), and p62 proteins in macrophages isolated from TSC1 KO mice.dDensitometric quantification of LC3-II (n= 3) band intensities quantified by ImageJ was normalized to total Actin.
Mycobacterial infection increased autophagy in TSC1 KO BMMϕ
To examine how constitutively activated mTOR may affect autophagy during mycobacterial infection, we examined if activated mTORC1 phosphorylates its downstream sub-strates in infected TSC1 KO BMMϕ. Uninfected TSC1 KO macrophages showed an increase in phosphorylation of p70S6K and ULK1 at the mTORC1-dependent inactivating site S757 (Fig. 3a) compared with WT macrophages, as ex-pected. Infection of the TSC1 KO macrophages with M. tuberculosisstrain H37Rv further increased the phosphor-ylation of p70S6K and the accumulation of LC3B-II and p62 (Fig. 3a, b, and c). Similar results were observed during Bacillus Calmette–Guérin (BCG) infection (Fig. 3d, e,
and f ). Phosphorylation of S6, the target substrate of p70S6K, was also substantially increased with mycobac-terial infections in both TSC1 KO and WT BMMϕ (Fig. 3).
A1 (Fig. 3e and f ). Bafilomycin A1 treatment signifi-cantly increased LC3B and p62 protein accumulation in the infected TSC1 KO BMMϕ. The findings of the further enhanced induced-autophagy and concomitant mTORC1 activation during mycobacterial infection as well as decreased LC3B-II levels upon rapamycin addition in the TSC1 KO macrophages suggest that an undiscov-ered mechanism might regulate autophagy when mTOR is constitutively activated.
Increased p-AMPKαcontributed to enhanced autophagy in TSC1 KO BMMϕ
Based on the ex vivo studies, we hypothesized that sus-tainably active mTOR may deplete energy or amino acids in TSC1 KO BMMϕ, which in turn would induce autophagy by other autophagy initiation pathways to overcome starvation. AMPK, activated during low nutri-ent conditions, directly phosphorylates ULK1 at multiple sites including Ser317, Ser555, and Ser777 (17,18). Con-versely, mTOR, which is a regulator of cell growth and is an inhibitor of autophagy, phosphorylates ULK1 at Ser757 and disrupts the interaction between ULK1 and AMPK (17). It is known that autophagy induced by en-ergetic stress requires AMPK, which directly activates
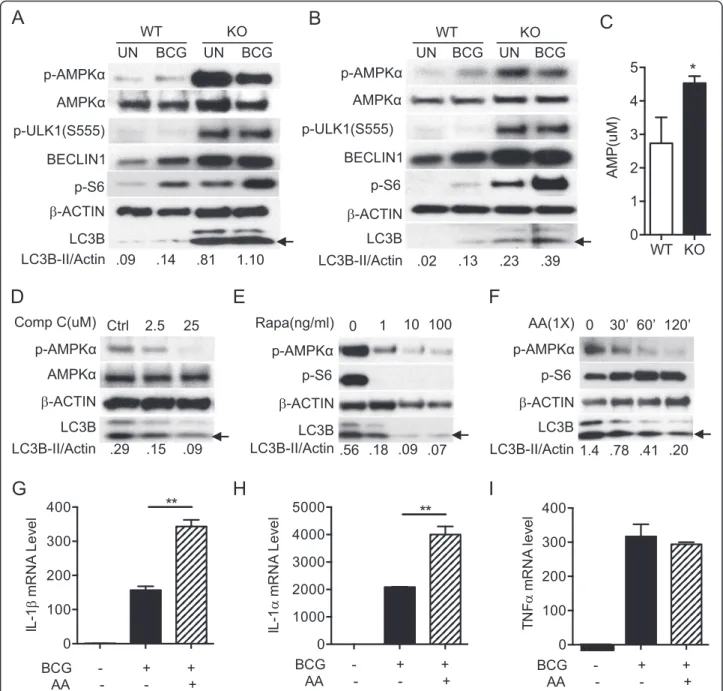
ULK1 through phosphorylation at Ser555 [2, 33, 38]. To explore the underlying mechanisms by which constitu-tively active mTOR induces autophagy, cell lysates from TSC1 WT and TSC1 KO BMMϕ(Fig. 4a) and from TSC1 KO peritoneal macrophages (Fig. 4b) were examined for p-AMPKα, p-ULK1 (Ser555), Beclin1, and LC3B protein levels. Activated ULK1 (Ser555) induces autophagy by phosphorylating Beclin-1 following amino acid starvation [20, 39]. Indeed, phosphorylated AMPKα, ULK1 (Ser555), and Beclin1 protein levels were higher in TSC1 KO BMMϕ than WT BMMϕ before or after BCG infection (Fig. 4a, b). TSC1 KO macrophages showed an increase in ULK1 phosphorylation at the mTORC1-dependent inacti-vating site S757 (Fig. 3a) as expected. AMP concentration determined by LC-MS analysis was significantly higher in TSC1 KO BMMϕ than WT BMMϕ (Fig. 4c). Together, these data support that sustainably active mTOR causes energy depletion in TSC1 KO BMMϕ, which in turn in-creases p-AMPKα and subsequently activates ULK1 (Ser555) to initiate autophagy.
C reduced both p-AMPKα level and LC3B protein, which indicates that AMPK activity regulates autophagy induction in TSC1 KO BMMϕ cells. Furthermore, rapa-mycin inhibited the elevated p-AMPKα and reduced LC3B protein level in KO BMMϕ(Fig. 4e). We tested if
the TSC1 defect associated phenotypes can be reversed by addition of amino acids or glucose. The addition of amino acids (Fig. 4f ) into TSC1 KO BMMϕmedium re-duced both LC3B and p-AMPKα expression levels and activated mTOR, indicating that sustainably activated Fig. 4Increased p-AMPKαcontributed to enhanced autophagy in TSC1 KO BMMϕ. TSC1 WT and KO peritoneal macrophages (a) or BMMϕ(b) were left uninfected or infected with BCG at a MOI of 10 for 24 h and Western blot analysis was performed against the indicated antibodies.
mTOR leads to the depletion of amino acids in TSC1 KO BMMϕ. Glucose supplementation did not change the LC3B level (data not shown).
Dual roles of autophagy in controlling bacterial burden and suppressing inflammation with features of a Th17 response including neutrophilic infiltration, tissue necro-sis, and organ damage, have been previously reported [41]. As such, we were interested in evaluating the in-flammatory cytokine levels in KO BMMϕ. Total RNA was isolated from TSC1 KO BMMϕ left uninfected or infected with BCG with or without amino acids. BCG in-fected TSC1 KO BMMϕsupplemented with amino acids displayed increased IL-1α andβmRNA transcripts com-pared to the cells infected with BCG without amino acid supplementation (Fig. 4g and h). TNFαmRNA levels were not affected in the same infected cells (Fig. 4i). These re-sults suggested that amino acid depletion caused by con-stitutive activation of mTORC1 activates p-AMPKα and p-ULK1 (Ser555) to promote autophagy in order to keep homeostasis in TSC1 KO BMMϕ.
TSC1 KO mice infected withM. tuberculosisH37Rv showed reduced bacterial burden
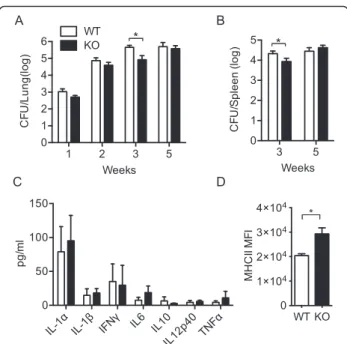
Host cells utilize autophagy pathways in their defense against pathogens. Autophagy limits mycobacterial replica-tion by targeting phagosomes containing bacteria for fusion with lysosomes [41, 42]. We further investigated how mice with basally enhanced autophagy due to TSC1 deficiency in macrophages surviveM. tuberculosisH37Rv infection using TSC1f/fLysM-Cre+ or littermate control mice. Statistically significant reduction of bacterial burden was observed in both lungs (Fig. 5a) and spleens (Fig. 5b) from TSC1f/f LysM-Cre+ mice 3 weeks post-infection compared to WT mice, suggesting that greater autophagy induction in TSC1 deficient macrophages may cause killing of infecting bacilli. However, there was no statistical difference in lung and spleen CFUs between TSC1f/fLysM-Cre+and TSC1f/f LysM-Cre-mice at 5 weeks post-infection.
Luminex data showed that there was no significant dif-ference in IL-1α and β secretions in lung homogenates between TSC1 WT and KO mice; there was also a com-parable level of proinflammatory cytokines such as IFNγ, IL-6, IL10, IL12p40, and TNFα in lung homogenates (Fig. 5c). Major histocompatibility complex II (MHCII) expression in spleen macrophages was higher in TSC1f/f LysM-Cre+ than TSC1f/f LysM-Cre- mice at 3 weeks afterM. tuberculosisH37Rv infection (Fig. 5d), which is consistent with other reports [43–47] and further sup-ports our finding that there is ongoing autophagy in TSC1 KO macrophages. Together, TSC1f/f LysM-Cre+ mice were able to temporarily contain M. tuberculosis H37Rv infection at the time of recruitment of M. tuber-culosisspecific CD4+T cells to the site of infection, pos-sibly due to enhanced autophagy.
Discussion
fibroblasts (MEFs) have reduced autophagy via mTORC1-dependent phosporylation of ULK1 at S757 [20]. Similarly, sustained activation of mTORC1 in skeletal muscle in-hibits constitutive and starvation-induced autophagy and causes a severe, late-onset myopathy [26]. Furthermore, due to constitutive mTOR activation, the resulting impair-ment of autophagy sensitizes TSC2-null cells to cell death under stress [50]. When starved, TSC1-deficient T cells show a comparable level of autophagy compared to wild type T cells, indicating that the increased mTORC1 activ-ity does not inhibit autophagy in T cells [51]. Such varia-tions in mTORC1 dependent autophagy regulation could be attributed to the different cells examined.
In order to demonstrate the active autophagic flux in TSC1 KO macrophages, we also measured p62 levels as an important indicator of autophagy-mediated degrad-ation of cellular contents. p62 is rapidly degraded during autophagy and analysis of its intracellular level by West-ern blotting is used routinely to measure the autophagic flux in response to pro-autophagic stimuli [8]. However, in our study, p62 protein levels were higher in TSC1 KO BMMϕ than TSC1 WT BMMϕ and p62 accumulation was sensitive to rapamycin (Figs. 2a and 3b). We believe that that the concomitant elevation of p62 and LC3B-II in TSC1-KO macrophages results from the inability of turnover to keep pace with increased autophagosome for-mation, rather than reduction in autophagosome turnover. When TSC1/TSC2 are disrupted, mTORC1 is consistently activated to phosphorylate several downstream regulators for protein synthesis, lipid synthesis, or glycolytic metabol-ism, leading to energetic stress. These energetic stresses then activate AMPK, which is a key energy sensor and regulates cellular metabolism to maintain energy homeo-stasis [52]. Activated AMPK inhibits mTORC1 through phosphorylation of TSC2 and Raptor and at the same time phosphorylates Ulk1 on Ser555 and then initiates autoph-agy [20, 53]. Thus, in TSC1-KO macrophages, autophagic machinery is overwhelmed with many autophagosomes accumulated by AMPK-dependent autophagy activation due to energetic stress signal. Upon treatment of com-pound C (Fig. 4d), rapamycin (Fig. 4e), or amino acid (Fig. 4f), the mTORC1 will be inhibited and cellular stress will be reduced, which results in lower level of autophagy activation. Similar results were also observed in TSC1/2 KO MEFs and neurons [33], which have p62 accumulation that was mTORC1 dependent.
Our data also showed that TSC1f/fLysM-Cre+mice have less or similar bacterial burdens in lungs and spleens of mice aerosol infected with M. tuberculosis H37Rv com-pared to wild type mice (Fig. 5). In contrast, mice with au-tophagy defects (ATG5 KO) showed increased bacterial burden and inflammation in lungs [54]. Thus, consistent with the enhanced autophagy phenotype shown in TSC1 deficient BMMϕ, our in vivo studies indicated the increased
autophagy induction, not inhibition, in TSC1 KO mice, which was also supported by a similar level of inflammatory cytokines and enhanced MHCII level in TSC1 KO mice. These data implicate the use of novel autophagy inducers as a therapeutic strategy for TB, especially for drug resistant TB. However, direct in vivo studies with autophagic protein (atg) deficiency in TSC KO macrophages will confirm the result that M. tuberculosis containment and increased MHCII levels in TSC1 KO mice are the consequence of increased autophagy.
In summary, our data indicate that constitutively acti-vated mTORC1 in TSC1 deficient macrophages increases autophagy through AMPK-dependent regulation of ULK1, likely to balance energy homeostasis. These findings high-light the complex regulatory network that modulates energy metabolism in cells. The fact that mTORC1 de-regulation is linked to several human diseases, such as type 2 diabetes, cancer, obesity and neurodegeneration, highlights the importance of this signaling pathway in the maintenance of cellular homeostasis [55]. Our findings are thus relevant to the study of these diseases and may pro-vide novel insight for the treatment of many human diseases.
Conclusions
Metabolic homeostasis is orchestrated by mTORC1 through the promotion of biosynthetic pathways and the repression of catabolic autophagy in response to energy and amino acid sufficiency. Collectively, the regulation of these processes is strictly determined by energy and amino acid sensing pathways within the cell [31, 49]. However, how constitutive mTORC1 activation affects autophagy is still controversial. In contrast to the previous studies that the TSC1-TSC2 complex is a critical negative regulator of mTORC1 and that TSC1/2 deficient cells have reduced autophagy via mTORC1-dependent inhibition and phos-phorylation of ULK1 at S757, we observed that TSC1 defi-cient macrophages had higher basal and infection induced autophagy compared to wild type controls. This autoph-agy dysfunction was mediated through AMPK-dependent phophorylation of ULK1 at Ser555 concomitant with mTORC1 inhibition of ULK1 at Ser757. In fact, our re-sults demonstrate that TSC1 KO macrophages have in-creased AMP levels suggesting energetic stress. These results collectively suggest that AMPK activation in TSC1 KO macrophages is a positive feedback mechan-ism on autophagy to prevent long-term cellular stress and maintain cellular homeostasis.
Methods
Mice and reagents
from the laboratory of Dr. William Jacobs (Albert Einstein College of Medicine). Virulent M. tuberculosis H37Rv (ATCC, 25618D-2) was purchased from ATCC. Rapa-mycin was obtained from Enzo Life Science (Enzo Life Science, A275). Bafilomycin A1 (B1793), 3-methyladenine (3-MA, M9281), and wortmannin (W1628) were pur-chased from Sigma-Aldrich. Compound C (Millipore, 171,260) was obtained from Millipore (Billerica, MA).
M. tuberculosisH37Rv in vivo infection and CFU determination
TSC1fl/fl LysM-Cre+ and TSC1fl/fl LysM-Cre- mice were infected with H37Rv via aerosol infection (200-300 CFUs) as previously described [57]. The retained dose was deter-mined by lung necropsy in four mice sacrificed 24 h after exposure. At specified time points, lungs and spleens re-moved from the mice were placed in a WhirlPak bag con-taining 4.5 mL of PBS and homogenized by manually rolling a pipette on the bag. Defined volumes of the neat homogenate and serial dilutions were plated on 7H10 agar plates. The plates were incubated for 4 weeks at 37 °C. The upper limit and lower limit for colony counting was 300 and 30 colonies per plate, respectively. The total CFU for each organ was calculated by multiplying CFU counts by their respective dilution factors.
Bone marrow derived macrophage (BMMϕ) development and mycobacterial infection
Bone marrow cells from femurs and tibias were flushed and plated into petri dishes containing RPMI 10 (RPMI 1640 medium supplemented with 10 % FBS, 100 U/ml penicillin, 1000 U/ml streptomycin, and 20 mM L-glu-tamine) containing 15 % L929 cell conditioned medium. After 2–3 days of culture at 37 °C in a CO2 incubator,
non-adherent cells were transferred to new plates with fresh medium for an additional 3–5 days before they were used for experiments. To remove TSC1 protein in BMMϕ in vitro, 4-Hydroxytamoxifen (Sigma-Aldrich, H7904) at 2.5 mM was added into L929 conditioned cul-ture medium for 2–3 days before use. For the resident peritoneal macrophage preparation, macrophages were washed from the peritoneal cavity with 5 ml of 1x PBS. After centrifugation at 1500 rpm for 5 min, the cell pel-lets were resuspended in complete medium (RPMI1640 containing 10 % FBS and antibiotics) and plated in a 12-well plate. After 2–3 h, non-adherent cells were removed and freshly prepared complete medium was added with the indicated stimuli. For mycobacterial infection within 3 h, cells were washed twice with 1x PBS after infection and then harvested for indicated analysis. For mycobac-terial infection beyond 3 h, cells were washed twice with PBS 3 h after infection, and then grown in fresh complete medium supplemented with 50μg/ml of gen-tamycin for indicated periods.
Immunofluorescence microscopy
TSC1 WT and KO BMMϕwere grown on chamber slides (BD Discovery Labware, 154534) in 10 % FBS RPMI 1640 for 24 h at 37 °C. The cells were treated with or without rapamycin at 20 ng/ml overnight. The cells were washed with PBS twice, and then were fixed in 4 % paraformalde-hyde/PBS for 10 min, permeabilized with 0.2 % Triton X-100/PBS for 10 min, and pre-blocked in 5 % BSA/PBS overnight. The slides were then incubated with anti-rabbit LC3B antibody (Cell Signaling Technology, 2775) that was diluted at 1/100 in blocking solution for 2 h, washed three times with PBS, and incubated with Alexa fluor 488-conjugated anti-rabbit IgG Ab (Invitrogen, A11034). One hour after additional washes, the slides were mounted with DAPI containing anti-fade solution (Vector Labora-tories, INC., H-1200). Images were taken on a Nikon TE 2000 immunofluorescent microscope and analyzed with NIS Elements software (1,000x magnification). Autophagic puncta were randomly counted for 20 cells in each group and averaged.
ELISA/Luminex
BMMϕ(3 × 10⁵) cells were plated into each well of 24 well-plates and allowed to adhere overnight (Becton Dickinson Labware, 3574). Both TSC1 WT and KO BMMϕwere in-fected with BCG or M. tuberculosisH37Rv at an MOI of 10 for indicated periods. The culture supernatants were harvested to detect IL-1βcytokine levels and were de-termined by using a commercial ELISA kit (Biolegend, 432606) according to the manufacturer’s instructions. These cells were then harvested for total RNA isolation. For Luminex assay, the Mouse Cytokine/Chemokine Magnetic Bead Panel kit was purchased from EMD Millipore Corporation (Billerica, MA). The procedure followed the manufacturer’s instructions using the Bio-Plex 200 System (Bio-rad).
qRT-PCR
Total RNA was prepared by using TRIzol® reagent (Invitrogen, 15596-018). Reverse transcription was per-formed using iScript Reverse Transcriptase (Bio-Rad, 170-8840). SYBR green real-time PCR was conducted using iQ™ Supermix (Bio-Rad, 170-8880). All reagents were used according to the manufacturer protocol. mRNA expression level is defined as fold change over control (arbitrarily as 1). The primer pairs were used as follows: β-Actin: forward 5’ TGTCCACCTTCCAGCA GATGT 3’and reverse 5’AGCTCAGTAACAGTCCGCC TAGA 3’; TNFα: Forward 5’CCCCAAAGGGATGAG
AAGTT and Reverse 5’CACTTGGTGGTTTGCTACGA;
Western blot
TSC1 WT and KO BMMϕ(3 × 10⁵cells/well) were seeded into 12-well plates in RPMI complete medium without L929 conditional medium overnight. Cells were infected with the indicated bacteria at an MOI of 10. After 3 h post infection, cells were washed once in PBS followed by addition of complete medium supplemented with 50 ug/ml gentamycin (Invitrogen, 15750-060). Cells were cultured until the indicated time points. Cells were washed once in PBS and lysed in 1 % 100 lysis buffer (1 % Triton-100, 150 mM NaCl, 50 mM Tris, pH 7.4, 1 mM EDTA) with protease inhibitor tablet and phosphatase inhibitor cocktails (Sigma, S8820). Protein concentrations were de-termined using a Bio-Rad Protein Assay at OD600 nm (Bio-Rad, 500-0006). Equivalent amounts of protein for each sample were subjected to SDS-polyacrylamide gel electrophoresis and transferred onto methanol equilibrated PVDF membrane (BIO-RAD Laboratories, 162-0177). After blocking with 5 % nonfat dry milk/PBS, the mem-branes were incubated with a primary antibody overnight at 4 °C, and washed with PBST (100 mM Tris, pH 7.5, NaCl 0.9 %, Tween 0.1 %). Secondary antibody was added for 45 min at room temperature, and the membrane was washed with PBST three times. Protein bands were visual-ized by ECL (Perkin Elmer Life Sciences, NE104001EA). The following antibodies were used for immunoblotting: Rabbit anti-LC3B (2775), S6 (Ser240/244) (4857), p-ULK1 (Ser757) (6888) or (Ser555) (5869), p-AMPKα (T172) (2535), Beclin1 (3738), ATG5 (2630), p62 (5114) from Cell Signaling Technology, and mouse anti-β -actin (Sigma-Aldrich, A5441). Films were scanned and ImageJ software was used to quantify band intensities. As described in Individual figures, band intensity of LC3B-II was related to the level ofβ-actin.
Flow cytometry
Cells were stained with the indicated antibodies in FACS buffer (PBS containing 2 % FBS) at 4 °C for 30 min. Cells were pelleted and washed once with FACS buffer and re-suspended in 4 % paraformaldehyde at least 2 h before analysis. Fluorescently conjugated antibodies used were APC-anti-F4/80 (123116), PE/Cy5-anti-Gr1 (108410), PE/ Cy7-anti-CD11b (101216), and PE-anti-CD45 (103106) from Biolegend. Data were collected using a BD FACS canto or LSRII and analyzed with FlowJo (Tree Star).
AMP quantitation
Approximately 30 million BMMϕ cells from TSC1f/f -ERCre+ or TSC1f/f-ERCre− mouse were plated into one 10 cm petri dish in 15 % L929 conditional medium in tripli-cate. After 24 h, cells were washed twice with the warmed 1x PBS, scraped in the same PBS, and spun at 2000 rpm for 5 min at 4 °C. The cell pellets were stored at -80 °C for fu-ture use. The LC-MS/MS method was described previously
[58]. The sample processing was performed in the DMPI Metabolomics Laboratory, Duke University.
ShRNA transduction
ShRaptor and ShLuc control were purchased from Addgene (21339). 293FT cells were transfected using the Fugene 6 Transfection Reagent (Promega Corporation, E269A). The viral supernatants were collected 48 h after transfection and frozen at -80 °C for future transduction. For infection, 2 × 10⁵cells in 1 mL of RPMI 10 were mixed with 0.5 mL of viral supernatant in a 6-well plate, along with 5ug/mL of polybrene (EMD Millipore, TR-1003-G). Cells were centrifuged at 2500 g for 1.5 h at room temperature. Fresh complete medium was added to the cells 7 h after infection. After 24 h of infection, cells were treated with puromycin (Sigma, P9620) at 2μg/ml for 3-4 days.
Statistical analysis
P values were calculated using the student’s t-test or ANOVA analysis. P values of less than 0.05 or 0.01 were considered significant or very significant, respectively.
Abbreviations
3-MA, 3-methyladenine; 4EBP1, eukaryotic translation initiation factor 4E-binding protein 1; AA, amino acid; AMP, adenosine monophosphate; AMPK, AMP-activated protein kinase; ATG, autophagy-related gene; BafA1, BCG, Bacillus Calmette-Guérin; KO, knock out; CFU, colony forming unit; LC3, microtubule-associated protein 1A/1B-light chain 3; MEF, mouse embryonic fibroblasts; MFI, mean fluorescence intensity; mTOR, mechanistic target of rapamycin; mTORC1, mechanistic target of rapamycin complex 1; p70S6K, 70 kDa ribosomal protein S6 kinase 1; Raptor, regulatory-associated protein of mTOR; S6, ribosomal protein S6; TSC, tuberous sclerosis complex; ULK1/2, UNC-51 like autophagy activating kinase 1/2; Wort, wortmannin; WT, wild type
Acknowledgements
The authors wish to thank Bryan Hart and Kristen Smith for manuscript review. We would also like to thank Sarah Seay and Ching-Ju Chen for technical assistance. Mycobacterial research was performed in the NIAID Regional Biocontainment Laboratory (RBL) at Duke University. Flow cytometry was performed at the Duke Human Vaccine Institute Research Flow Cytometry Shared Resource Facility (Durham, NC). AMP quantification was performed using LC-MS analysis in Metabolomics Laboratory, Duke Molecular Physiology Institute (Durham, NC).
Funding
This work was supported by NIH/NIAID grant AI095723.
Availability of data and materials
The datasets supporting the conclusions of this article are included within the article.
Author’s contributions
HP and SL conceived, designed, and coordinated the study. HP performed the study. HP, XPG, and SL analyzed the experiments and wrote the paper. XPG provided reagents and technical assistance. All authors reviewed the results and approved the final version of the manuscript.
Competing interests
The authors declare that they have no conflicts of interest with the contents of this article.
Consent for publication
Ethics of approval and consent to participate
All mice were generated and used in accordance with protocols (A065-13-03) approved by the Institutional Animal Care and Use Committee at Duke University. Consent to participate is not applicable.
Author details
1Human Vaccine Institute and Department of Medicine, Duke University, Durham, NC 27710, USA.2Department of Pediatrics-Allergy and Immunology, Duke University Medical Center, Durham, NC 27710, USA.
Received: 23 December 2015 Accepted: 29 June 2016
References
1. Maiuri MC, Zalckvar E, Kimchi A, Kroemer G. Self-eating and self-killing: crosstalk between autophagy and apoptosis. Nat Rev Mol Cell Biol. 2007; 8(9):741–52.
2. Levine B, Mizushima N, Virgin HW. Autophagy in immunity and inflammation. Nature. 2011;469(7330):323–35.
3. Lerena C, Calligaris SD, Colombo MI. Autophagy: for better or for worse, in good times or in bad times. Curr Mol Med. 2008;8(2):92–101.
4. Wirawan E, Vanden Berghe T, Lippens S, Agostinis P, Vandenabeele P. Autophagy: for better or for worse. Cell Res. 2012;22(1):43–61.
5. Songane M, Kleinnijenhuis J, Netea MG, van Crevel R. The role of autophagy in host defence against Mycobacterium tuberculosis infection. Tuberculosis (Edinb). 2012;92(5):388–96.
6. Levine B, Deretic V. Unveiling the roles of autophagy in innate and adaptive immunity. Nat Rev Immunol. 2007;7(10):767–77.
7. Kabeya Y, Mizushima N, Ueno T, Yamamoto A, Kirisako T, Noda T, Kominami E, Ohsumi Y, Yoshimori T. LC3, a mammalian homologue of yeast Apg8p, is localized in autophagosome membranes after processing. Embo J. 2000;19(21):5720–8.
8. Pankiv S, Clausen TH, Lamark T, Brech A, Bruun JA, Outzen H, Overvatn A, Bjorkoy G, Johansen T. p62/SQSTM1 binds directly to Atg8/LC3 to facilitate degradation of ubiquitinated protein aggregates by autophagy. J Biol Chem. 2007;282(33):24131–45.
9. Hara K, Maruki Y, Long X, Yoshino K, Oshiro N, Hidayat S, Tokunaga C, Avruch J, Yonezawa K. Raptor, a binding partner of target of rapamycin (TOR), mediates TOR action. Cell. 2002;110(2):177–89.
10. Dibble CC, Cantley LC. Regulation of mTORC1 by PI3K signaling. Trends Cell Biol. 2015;25(9):545–55.
11. Laplante M, Sabatini DM. mTOR signaling at a glance. J Cell Sci. 2009;122(Pt 20):3589–94.
12. Ekim B, Magnuson B, Acosta-Jaquez HA, Keller JA, Feener EP, Fingar DC. mTOR kinase domain phosphorylation promotes mTORC1 signaling, cell growth, and cell cycle progression. Mol Cell Biol. 2011;31(14):2787–801. 13. Showkat M, Beigh MA, Andrabi KI. mTOR signaling in protein translation
regulation: implications in cancer genesis and therapeutic interventions. Mol Biol Int. 2014;2014:686984.
14. Richter JD, Sonenberg N. Regulation of cap-dependent translation by eIF4E inhibitory proteins. Nature. 2005;433(7025):477–80.
15. Ma XM, Blenis J. Molecular mechanisms of mTOR-mediated translational control. Nat Rev Mol Cell Biol. 2009;10(5):307–18.
16. Alers S, Loffler AS, Wesselborg S, Stork B. Role of AMPK-mTOR-Ulk1/2 in the regulation of autophagy: cross talk, shortcuts, and feedbacks. Mol Cell Biol. 2012;32(1):2–11.
17. Boya P, Reggiori F, Codogno P. Emerging regulation and functions of autophagy. Nat Cell Biol. 2013;15(7):713–20.
18. Hardie DG, Carling D. The AMP-activated protein kinase–fuel gauge of the mammalian cell? Eur J Biochem. 1997;246(2):259–73.
19. Mihaylova MM, Shaw RJ. The AMPK signalling pathway coordinates cell growth, autophagy and metabolism. Nat Cell Biol. 2011;13(9): 1016–23.
20. Kim J, Kundu M, Viollet B, Guan KL. AMPK and mTOR regulate autophagy through direct phosphorylation of Ulk1. Nat Cell Biol. 2011;13(2):132–41. 21. Shang L, Chen S, Du F, Li S, Zhao L, Wang X. Nutrient starvation elicits an acute autophagic response mediated by Ulk1 dephosphorylation and its subsequent dissociation from AMPK. Proc Natl Acad Sci U S A. 2011;108(12): 4788–93.
22. Long X, Lin Y, Ortiz-Vega S, Yonezawa K, Avruch J. Rheb binds and regulates the mTOR kinase. Curr Biol. 2005;15(8):702–13.
23. Sancak Y, Thoreen CC, Peterson TR, Lindquist RA, Kang SA, Spooner E, Carr SA, Sabatini DM. PRAS40 is an insulin-regulated inhibitor of the mTORC1 protein kinase. Mol Cell. 2007;25(6):903–15.
24. Huang J, Manning BD. The TSC1-TSC2 complex: a molecular switchboard controlling cell growth. Biochem J. 2008;412(2):179–90.
25. Chong-Kopera H, Inoki K, Li Y, Zhu T, Garcia-Gonzalo FR, Rosa JL, Guan KL. TSC1 stabilizes TSC2 by inhibiting the interaction between TSC2 and the HERC1 ubiquitin ligase. J Biol Chem. 2006;281(13):8313–6.
26. Castets P, Lin S, Rion N, Di Fulvio S, Romanino K, Guridi M, Frank S, Tintignac LA, Sinnreich M, Ruegg MA. Sustained activation of mTORC1 in skeletal muscle inhibits constitutive and starvation-induced autophagy and causes a severe, late-onset myopathy. Cell Metab. 2013;17(5):731–44. 27. Pan H, O’Brien TF, Zhang P, Zhong XP. The role of tuberous sclerosis
complex 1 in regulating innate immunity. J Immunol. 2012;188(8):3658–66. 28. Clausen BE, Burkhardt C, Reith W, Renkawitz R, Forster I. Conditional gene
targeting in macrophages and granulocytes using LysMcre mice. Transgenic Res. 1999;8(4):265–77.
29. Feil S, Valtcheva N, Feil R. Inducible Cre mice. Methods Mol Biol. 2009;530:343–63. 30. Huang J, Dibble CC, Matsuzaki M, Manning BD. The TSC1-TSC2 complex is
required for proper activation of mTOR complex 2. Mol Cell Biol. 2008; 28(12):4104–15.
31. Jung CH, Ro SH, Cao J, Otto NM, Kim DH. mTOR regulation of autophagy. FEBS Lett. 2010;584(7):1287–95.
32. Russell RC, Yuan HX, Guan KL. Autophagy regulation by nutrient signaling. Cell Res. 2014;24(1):42–57.
33. Di Nardo A, Wertz MH, Kwiatkowski E, Tsai PT, Leech JD, Greene-Colozzi E, Goto J, Dilsiz P, Talos DM, Clish CB, et al. Neuronal Tsc1/2 complex controls autophagy through AMPK-dependent regulation of ULK1. Hum Mol Genet. 2014;23(14):3865–74.
34. Wang Y, Weiss LM, Orlofsky A. Host cell autophagy is induced by Toxoplasma gondii and contributes to parasite growth. J Biol Chem. 2009;284(3):1694–701. 35. Parkhitko A, Myachina F, Morrison TA, Hindi KM, Auricchio N, Karbowniczek M, Wu JJ, Finkel T, Kwiatkowski DJ, Yu JJ, et al. Tumorigenesis in tuberous sclerosis complex is autophagy and p62/sequestosome 1 (SQSTM1)-dependent. Proc Natl Acad Sci U S A. 2011;108(30):12455–60.
36. Mizushima N, Yoshimori T, Levine B. Methods in mammalian autophagy research. Cell. 2010;140(3):313–26.
37. Kim DH, Sarbassov DD, Ali SM, King JE, Latek RR, Erdjument-Bromage H, Tempst P, Sabatini DM. mTOR interacts with raptor to form a nutrient-sensitive complex that signals to the cell growth machinery. Cell. 2002; 110(2):163–75.
38. Ghislat G, Patron M, Rizzuto R, Knecht E. Withdrawal of essential amino acids increases autophagy by a pathway involving Ca2+/calmodulin-dependent kinase kinase-beta (CaMKK-beta). J Biol Chem. 2012;287(46): 38625–36.
39. Russell RC, Tian Y, Yuan H, Park HW, Chang YY, Kim J, Kim H, Neufeld TP, Dillin A, Guan KL. ULK1 induces autophagy by phosphorylating Beclin-1 and activating VPS34 lipid kinase. Nat Cell Biol. 2013;15(7):741–50.
40. Fleming A, Noda T, Yoshimori T, Rubinsztein DC. Chemical modulators of autophagy as biological probes and potential therapeutics. Nat Chem Biol. 2011;7(1):9–17.
41. Castillo EF, Dekonenko A, Arko-Mensah J, Mandell MA, Dupont N, Jiang S, Delgado-Vargas M, Timmins GS, Bhattacharya D, Yang H, et al. Autophagy protects against active tuberculosis by suppressing bacterial burden and inflammation. Proc Natl Acad Sci U S A. 2012;109(46):E3168–3176. 42. Gutierrez MG, Master SS, Singh SB, Taylor GA, Colombo MI, Deretic V.
Autophagy is a defense mechanism inhibiting BCG and Mycobacterium tuberculosis survival in infected macrophages. Cell. 2004;119(6):753–66. 43. Deretic V, Saitoh T, Akira S. Autophagy in infection, inflammation and
immunity. Nat Rev Immunol. 2013;13(10):722–37.
44. Munz C. Enhancing immunity through autophagy. Annu Rev Immunol. 2009;27:423–49.
45. Caminschi I, Munz C. Autophagy for better or worse during infectious diseases. Front Immunol. 2013;4:205.
46. Thiele F, Tao S, Zhang Y, Muschaweckh A, Zollmann T, Protzer U, Abele R, Drexler I. Modified vaccinia virus Ankara-infected dendritic cells present CD4 + T-cell epitopes by endogenous major histocompatibility complex class II presentation pathways. J Virol. 2015;89(5):2698–709.
48. Chang YY, Juhasz G, Goraksha-Hicks P, Arsham AM, Mallin DR, Muller LK, Neufeld TP. Nutrient-dependent regulation of autophagy through the target of rapamycin pathway. Biochem Soc Trans. 2009;37(Pt 1):232–6.
49. Wullschleger S, Loewith R, Hall MN. TOR signaling in growth and metabolism. Cell. 2006;124(3):471–84.
50. Ng S, Wu YT, Chen B, Zhou J, Shen HM. Impaired autophagy due to constitutive mTOR activation sensitizes TSC2-null cells to cell death under stress. Autophagy. 2011;7(10):1173–86.
51. O’Brien TF, Gorentla BK, Xie D, Srivatsan S, McLeod IX, He YW, Zhong XP. Regulation of T-cell survival and mitochondrial homeostasis by TSC1. Eur J Immunol. 2011;41(11):3361–70.
52. Hardie DG. AMP-activated protein kinase: an energy sensor that regulates all aspects of cell function. Genes Dev. 2011;25(18):1895–908.
53. Bach M, Larance M, James DE, Ramm G. The serine/threonine kinase ULK1 is a target of multiple phosphorylation events. Biochem J. 2011;440(2):283–91. 54. Watson RO, Manzanillo PS, Cox JS. Extracellular M. tuberculosis DNA targets bacteria for autophagy by activating the host DNA-sensing pathway. Cell. 2012;150(4):803–15.
55. Laplante M, Sabatini DM. mTOR signaling in growth control and disease. Cell. 2012;149(2):274–93.
56. Shin J, Pan H, Zhong XP. Regulation of mast cell survival and function by tuberous sclerosis complex 1. Blood. 2012;119(14):3306–14.
57. Saini D, Hopkins GW, Seay SA, Chen CJ, Perley CC, Click EM, Frothingham R. Ultra-low dose of Mycobacterium tuberculosis aerosol creates partial infection in mice. Tuberculosis (Edinb). 2012;92(2):160–5.
58. Cordell RL, Hill SJ, Ortori CA, Barrett DA. Quantitative profiling of nucleotides and related phosphate-containing metabolites in cultured mammalian cells by liquid chromatography tandem electrospray mass spectrometry. J Chromatogr B Analyt Technol Biomed Life Sci. 2008;871(1):115–24.
• We accept pre-submission inquiries
• Our selector tool helps you to find the most relevant journal
• We provide round the clock customer support
• Convenient online submission
• Thorough peer review
• Inclusion in PubMed and all major indexing services
• Maximum visibility for your research
Submit your manuscript at www.biomedcentral.com/submit