Australian Journal of Basic and Applied Sciences
2019 May; 13(5): pages 11-25 DOI: 10.22587/ajbas.2019.13.5.2 Original paper AENSI Publications Journal home page: www.ajbasweb.com
Australian Journal of Basic and Applied Sciences ISSN: 1991-8178,EISSN: 2309-8414
Effect of selenium and vitamin E injection on nutritive value and
performance of Baladi doe goats in Southern Sinai
Ahlam, R. Abdou
Animal and Poultry Nutrition Department, Desert Research Center, Mataria, Cairo, P.O.Box11753, Egypt
Correspondence Author: Ahlam, R. Abdou, Animal and Poultry Nutrition Department, Desert Research Center, Mataria, Cairo, P.O. Box11753, Egypt.
E-mail: - [email protected]
Received date: 18 March 2019, Accepted date: 5 May, Online date: 25 May 2019
Copyright: © 2019Ahlam, R. Abdou, This is an open-access article distributed under the terms of the Creative Commons Attribution License, which permits
unrestricted use, distribution, and reproduction in any medium, provided the original author and source are credited.
Keywords: Goats, selenium, vitamin E, digestibility coefficients, growth, milk production, blood analyses, and mineral.
INTRODUCTION
Many regions in the world are poor in soil selenium (Se) content, which in turn, resulted in inadequate selenium levels in forages and crops. Furthermore, under south Sinai conditions of the high salinity of water irrigation, growing plants aren’t capable of maintaining their needs of selenium from the poor soil (Mikkelsen et al., 1988 and Sadek, 1995). Subsequently, selenium supplementation is used to enhance dietary utilization (Ceballos et al., 2009). Selenium (Se) plays essential roles in several metabolic processes, including antioxidant defense systems, thyroid hormone metabolism, and immune function (Brown and Arthur, 2001). Selenium is an essential component of glutathione peroxidase, an enzyme involved in detoxification of hydrogen peroxide and lipid hydroperoxides. Selenium has also been shown to improve immune responses (Sheffy, 1979) as it is required for the development and expression of non– specific humeral and cell-mediated immune responses. Selenium deficiency plays a role in numerous economically important livestock disease, problems that include impaired fertility, abortion, retained placenta
Abstract
The present study aimed to investigate the effect of different injection levels of selenium plus vitamin E on goat performance, intake, digestibility, nutritive value and milk and blood metabolites. Forty Baladi doe goats 2-3 year old and (20.47±1.82 kg) average live body weight were randomly divided into four groups (10 does each). The first group was a control group, does of 2nd, 3rd and 4th groups received two injections of selenium and Vit. E; at early
and late periods of gestation as follows, 0.125 mg Se+ 1.7 IU Vit. E/kg BW for 2nd group (T1), 0.250 mg Se + 3.4 IU
Vit. E/kg BW for 3rd group (T2) and 0.310 mg Se + 4.2 IU Vit. E/kg BW for 4th group (T3). Digestibility trials were
carried out after each injection. Does were fed a basal ration of concentrate feed mixture and the roughage portion of the diet was Berseem hay. Body weight of dams and kids were recorded. Mineral content (Se, Zn, Fe, Mn and Cu) of serum, blood and milk parameters were determined.
Results revealed that, the injection of both Se and Vit. E did not show any significant effects on TDMI and CPI of treated groups at either period of pregnancy. Control group showed higher (P<0.05) CPD% than treatments. Whereas, EED% increased with Se supplementation. Supplementation of Se and Vit. E increased TDN% at late period and decreased NB at early and late pregnancy compared to control. Supplementation increased weight gain during pregnancy. Control and T2 recorded higher (P<0.05) average weaning weight, and daily gain than T3 and T1 groups. Goats received 0.125 mg Se plus1.7 IU Vit. E (T1) produced higher milk yield followed by control, T3 and then T2.
Selenium concentration in milk increased with increasing injected selenium. Higher creatinine concentration at six hours’ post feeding was observed in treated groups compared with control. The highest AST was shown at zero time, while no significant effects on ALT were noticed. The highest AST value of P (5.33 mg/dl) was recorded of zero time for late pregnancy compared (3.28mg/dl) with early pregnancy periods at zero time. There were (P<0.01) differences of calcium (Ca) values among sampling time. The levels of zinc, iron did not differ significantly. Serum selenium concentration at zero time showed significant (P<0.05) differences.
and neonatal weakness (Mc Dowell et al., 1996). Earlier, National Research Council NRC (1985) recommended a dietary level of (0.1 to 0.2 ppm) of Se for sheep. Selenium is known to be required (0.05-0.1 mg Se/kg diet) for animal health (Mayland et al., 1989). Marai et al. (2009) reported that dietary selenium supplementation improved reproductive performance in sheep.
Vitamin E is significant for the development of the immune system of young animals, and this is an important factor in improving performance of lambs receiving high levels of vitamin E supplementation (Kolb and Seehawer, 1998). Moreover, vitamin E inhibits the conversion of existing lipid peroxides to the much more reactive and destructive peroxide radials (Chris et al., 2003). After reviewing vitamin E studies, in human and animals, Kelleher (1991) concluded that vitamin E requirements were based on lymphocyte proliferation or, more generally, on immune function than the indicators to muscle degeneration. The biological effects of vitamin E are predominantly seen in the prevention of resumption of fetuses, testicular degeneration, muscle dystrophy, anemia and encephalomalacia, the classical signs of vitamin E deficiency in animals (Salama et al., 2015). A significant contributor to non- enzymatic protection against lipid peroxidation is vitamin E, a known free radical scavenger (Rikans et al., 1991). Both selenium and vitamin E are antioxidants because they both protect the membranes from oxidative damage (Gutteridge and Halliwell, 1994).
Supplementation of Se improves lambs’ growth rate and reproductive performance in ewes (Ibrahim 2017). Selenium has high importance to human health due to its role in immune system activation and reduction of the risk of cardiovascular disease and cancer (Margaret, 2000). Bayril et al. (2015) reported that supplementation with Se and Vit. E increased milk yield and decreased the incidence of sub-clinical mastitis. Injection of Se solution increased serum and tissue concentrations of the element. Serum selenium concentration provides a good indication of Se homeostasis in ruminants (Andres et al., 1996).
Therefore, the objective of this experiment was to determine the effect of different levels of Se/vitamin E injections on the productivity of pregnant and milk of goats in Southern Sinai.
MATERIALS AND METHODS
The present study was carried out at Ras Suder Experimental Station, Desert Research Center to investigate the effect of injections of Se+ Vit E at different levels on the productivity of Baladi doe goats under the conditions of South Sinai
Animals and experimental design
Forty Baladi doe goats 2-3-year-old and (20.47 1.82 kg) average live body weight were randomly divided after mating into four groups (10 of each).
The first group was served as control; the other experimental groups (T1, T2, and T3) received the following intramuscular injection according to Ramirez-Bribiesca et al., (2005)
The first group was a control group.
The second group (T1): 0.125mg Se + 1.7 IU Vit. E/kg body weight. The third group (T2): 0.250mg Se + 3.4 IU Vit. E/kg body weight. The four group (T3): 0.310mg Se + 4.2 IU Vit. E/kg body weight.
The experimental groups (1, 2 and 3) injected two times; the first injection was done after 60 days of pregnancy (early pregnancy), while the second injection was after 108 days of pregnancy (late pregnancy). Animal evaluations were carried out 20 days after injections.
Animals and feeding
Animals were fed a basal ration of concentrate feed mixture (CFM) consisted of (43% yellow corn, 22% cottonseed meal, 20% wheat bran, 12% rice bran 1.5% limestone, 1% sodium chloride and 0.5% mineral mixture). Roughage portion of the diet was Berseem hay. Rations were formulated on basis concentrate/roughage ratio of 60:40 and 70:30 in early and late pregnancy, respectively. Concentrate feeds were calculated and formulated depending on the physiological status of does, according to Kearl (1982).
The experiment period covers the whole pregnancy and weaning (4 months) periods. Kids were assigned to four groups to study the effect of injection on kids’ growth performance past birth up to 16 weeks. Same treatments were applied to kids as dams. Chemical composition of the experimental diet was shown in Table (1).
Table (1) Chemical composition of concentrate diet and Berseem hay (on DM basis, %)
Item Chemical composition
DM OM CP CF EE NFE Ash Se mg/kgDM DE**
CFM* 92.40 93.76 16.87 7.47 2.80 66.62 6.24 0.076 3290
Berseem hay 91.33 85.75 15.16 30.94 2.11 37.54 14.25 0.058 2100
*CFM concentrates feed mixture, DE** Digestible energy (DE, M cal///kg DM)
Digestibility trials
by hand, and subsamples representing 10% of daily fecal production from each doe were weighed. Representative samples of each daily collection of diets and feces were pre-dried in drying oven at 60-70 0C for 48 hrs. and then ground to pass through a one mm mill screen. Chemical composition and digestibility coefficients of DM, CP, EE, CF and NFE were determined according to A O A C (1997). Digestible energy (DE M cal/kg DM) was calculated, according to NRC (1985).
Body weight
Does were weighed at the beginning of the experiment and, then, biweekly basis before and after lambing. This process took place in the morning, just before offering feed and water. Throughout the experimental period, body weight changes were recorded for each animal during early and late pregnancy. After kidding body weights of does were recorded biweekly. Weights of kids were recorded from birth up to 16 weeks of age at two-week intervals.
Milk yield
Daily milk yield was individually recorded biweekly in the morning and evening during the weaning period. Milk Samples were taken to determine the levels of selenium (Se), Zinc (Zn), iron (Fe), manganese (Mn), and copper (Cu).
Blood sampling
Jugular vein blood samples were withdrawn from the animals in each group at the end of digestibility trials just before offering morning feed and water and 6 hrs. after feeding. Blood serum was separated by centrifugation at 3000 rpm. For 10 min, and kept frozen at -20 0C for later analyses. Assay of aspartate amino transferase (AST) and alanine amino transferase (ALT) activities were undertaken according to the method of Reitman and Frankel (1957). Indicators for kidney functions (creat inine and urea) were determined using bio-diagnostic kits according to Fawcett and Scott (1960) and Schirmeister et al. (1964), respectively. Serum calcium (Ca) and phosphorus (P) were determined using commercial kits (Diagnostic system laboratories, Inc USA). Additionally, serum minerals (Se, Zn, Fe and Cu) and milk minerals(Se, Zn, Fe, Mn and Cu) were analyzed using Inductively Coupled Argon Plasma, (ICAP) 6500 Duo, Thermo Scientific, England .1000 mg/L multi-element certified standard solution, Merck, Germany was used as a stock solution for instrument standardization.
Statistical analysis
Statistical analysis was carried out using the General Linear Model (GLM) procedures by SAS (2004). Fixed models, one, two, and three-way analysis of variance, were used. Firstly, one-way analysis was used to the body weight of goats, the body weight of kids, and milk yield, according to the following model: yij=µ +Ti +eij
Where yij: is the jth sample of the ith substitution level, µ: overall mean, Ti: the fixed effect of the ith substitution level (i= 1to 4) and eij: experiment error assumed to be normally and independently distributed.
Secondly, two- way analysis of variance was used to examine the effect of substitution levels, and the interactions between them, according to the following model: Yijk = μ +Ti + Zj+ TZij + eijk
Where: Yijk = observations value of the kth animal,Ti = effect of ith period (i: 1-2), Zj= effect of jth treatment (j: 1-4), TZij= the interaction between groups.
Thirdly, three-way analysis of variance was used to blood and mineral examine the effect of substitution levels, and the interactions between them, according to the following model:
Yijkl = μ +Tri + Timej + Periodkj + Tr*Timeij +Tr*Periodik +Time*Periodjk + Tr*Time*Periodijk +eijkl
Where: Tri=effect of treatment (i: 1-4), Time j= effect of time (j:1-2), Period: effect of period of pregnancy (k:1-2), Tr*Timeij: interaction between treatment and time, Tr*period: interaction between treatment and period, Time*periodjk: interaction between time and period, Tr*Time*periodijk: interaction between treatment, time and period. Significant differences among treatment means were tested using Duncan multiple range test (Duncan, 1955).
RESULTS AND DISCUSSION
Feed intake
Feed intake (FI), total dry matter intake (TDMI) and crude protein intakes (CPI, g/ Kg BW), as well as digestible energy (DE) of the experimental, do are shown in Table (2). The obtained results demonstrated that TDMI at an early period of pregnancy (22.62 g/Kg BW) was significantly lower (P<0.05) than that of the late pregnancy (28.92 g/Kg BW) (Table 2). Also , Crude protein intake (CPI, g/Kg BW) at an early period of pregnancy (3.64 g/Kg BW) was significantly lower (P<0.01) than that of the late pregnancy (4.71 g/Kg BW). On the other hand, injection of both Se and Vit E did not affect significantly either the TDMI or CPI at both periods of pregnancy (Table 2).
(2011) registered no significant differences (P<0.05) in dry matter intake of dairy goats when Se supplement in concentrate (0.20 mg/head per day of Na-selenite and 20 mg/day per head of Vit. E).
Serra et al. (1994b) reported that supplementation of 0.2 ppm Se to the basal diet (31.74 ppb Se) did not affect the DM consumption of sheep.
Table (2) Effect of treatment on feed intake and body weight of Baladi doe goats during pregnancy periods
Item
Early pregnancy Late pregnancy
±SE1 Control T1 T2 T3 Overall
mean Control T1 T2 T3
Overall mean Average body
weight (Kg) 25.83 31.33 26.33 28
27.87
±0.89 28.33 31.33 29.33 25.66
28.66
±0.89 ±1.77 Voluntary intake (g/kg BW/day):
Concentrate 13.08c 11.77c 13.01c 12.75c 12.65 B
±0.25 19.55 ab
17.98b 19.39ab 20.25a 19.29 A
±0.25 ±0.499
Berseem hay 9.64ab 10.28a 10.25a 9.68ab 9.96
±0.25 10.04 a
9.68ab 10.61a 8.17b 9.62
±0.25 ±0.506 Total dry
matter intake 22.72b 22.05b 23.26 b 22.44 b 22.62 B
±0.37 29.59 a
27.66a 29.99a 28.43a 28.92 A
±0.37 ±0.744
DEI* (Mcal/kg BW):
Concentrate 430.29c 387.28c 428.21c 419.66c
416.4 B
+8.22 643.22ab 591.74b 637.87ab 666.34a
634.8A
±8.22 ±16.43
Hay 202.48ab 215.90a 215.25a 203.38ab 209.2 A
±5.31 210.77 a
203.27ab 222.76a 171.68b 202.1 A
±5.31 ±10.63
TDEI** 632.78b 603.19b 643.47b 623.04b 625.6 B
±10.20 854.0 a
795.01a 860.64a 838.03a 836.9 A
±10.20 ±20.41 Total CP intake
(g/head/d ) 94.44 d
111.02cd 98.50cd 101.27cd 101.31 B
±3.44 136.66 ab
141.02a 142.29a 119.17bc 134.78 A
±3.44 ±6.88 Total CP intake
(g/kg BW) 3.66 b
3.54b 3.75b 3.62b 3.64 B
±0.06 4.82 a
4.50a 4.88a 4.65a 4.71 A
±0.06 ±0.119 a, b, c and d: values with different letters in the same row means statistically significant at( P<0.05), A,B of overall mean with different superscripts are significant differences (p<0.05). ±SE1, Standard error for treatments = Early pregnancy and Late pregnancy, DEI *(Mcal/kg Bw) Digestible energy intake, TDEI** Total Digestible energy intake.
Digestion coefficients
Data of Table (3) clearly showed that as the level of Se and Vit. E increased the digestibility’s of DM, OM, CP and NFE were significantly decreased at both early and late pregnancy.
Injection of Se and Vit. E showed a significant decreasing trend of DMD as the level of Se increased at both early and late pregnancy (Table 3). Early pregnancy control group of animals had the highest significant DMD (74.48%), T1, T2 and T3 showed lower significant DMD values (71.59%, 68.87% and 67.22%, respectively). During the late period of pregnancy, the same trend o f DMD was found as that of the early period of pregnancy; yet the values were (76.13%, 75.60%, 73.46% and 70.37% for control, T1, T2 and T3, respectively. The overall mean of dry matter digestibility (DMD %) at the early pregnancy period was 70.54% compared to 73.89% for the late pregnancy period with insignificant manner.
At early pregnancy, the control group showed the highest (P<0.05) CPD value (76.74%). While, at late pregnancy, T1 had the highest CPD (%) values. Among treatments, the injection of Se and Vit E at the level of (0.310mg Se + 4.2 IU Vit. E/ kg Body weight, T3) at both periods of pregnancy showed the lowest significant (P<0.05) CPD (70.12 and 72.03%) for early and late pregnancy periods, respectively. The overall mean of crude protein digestibility (CPD, %) at early period of pregnancy was 72.78% and that of the late period was 73.89% with insignificant manner (Table 3).
Among treatment, EED (%) increased insignificantly with the Se + Vit. E supplementation at early and late pregnancy periods. Ether extract digestibility (EED, %) of goats at the early pregnancy period was higher (P<0.01) (77.87%) compared to (71.54%) for the late pregnancy period.
Digestibility of CF was significantly decreased with increased 0.125, 0.250 and 0.310 mg of Se plus vitamin E in late pregnancy (Table 3).
These results are in agreement with those found by Kholif and Kholif (2008) digestibility of OM, EE, CF and NFE were significantly increased with buffaloes fed low amount of enriched yeast followed by the high amount of selenium-enriched yeast and then control. Furthermore, Nicholson et al. (1991) observed that upon the supplementation of 1ppm of Se, there was no effect on the digestibility of OM, CP and NDF in calves. Neeraj et al. (2008) noticed that the supplementation of 0.15 and 0.3 ppm Se (through sodium selenite) had no effect on digestibility of these nutrients in lambs. Zohreh et al. (2018) found that, apart from crude fat, no significant differences for all other apparent nutrient digestibility, as well as total digestible nutrients (P<0.05).
The improvements in nutrient digestibility’s reported in literature may be due to positive effects of Se on rumen microorganisms rather than the host ruminants (Wang et al., 2009). Microbial efficiency was lower for the 70% grain included diet plus supplemental Se, yet, the lower level of grains (50%) showed improved digestibility coefficients when supplemental Se was included. Also, Del Razo et al. (2013) found improved microbial and N efficiency with the 50% grain diet plus 0.9 mg Se/kg DM. Absorption is less in ruminants compared to monogastric animals, and this is because selenium gets reduced to insoluble compounds in the rumen Chander (1998).
Table (3) Effect of treatment on nutrients digestibility of Baladi doe goats during early and late pregnancy period
Item
Early pregnancy Late pregnancy
±SE1 Control T1 T2 T3 Overall
mean Control T1 T2 T3
Overall mean Nutrient digestibility
%: DM
74.48ab 71.59abc 68.87c 67.22c 70.54 B
±0.71 76.13 a
75.60 a 73.46ab 70.37bc 73.89 A
±0.71 ±1.41
OM 76.53a b 73.22abcd 70.68dc 69.44d 72.46 B
±0.68 77.32 a
76.94a 74.75abc 72.16bcd 75.29 A
±0.68 ±1.36
CP 76.74a 72.18bc 72.07bc 70.12c 72.78
±0.59 74.96
ab 75.60ab 72.99abc 72.03bc 73.89
±0.59 ±1.17
EE 76.72 77.61 79.86 77.29 77.87 A
±0.94 72.54 72.14 68.30 73.21
71.54B
±0.94 ±7.87
CF 60.38a 58.79a 49. 53c 52.16bc 55.92
±0.92 58.59 a
59. 28a 56. 77ab 48.36c 55.75
±0.92 ±1.83
NFE 81.61abc 78.33bcd 76.83de 75.21e 77.99B
±0.66 83.29
a 82.46ab 80.59abc 77.97cde 81.08A
±0.66 ±1.33 a, b, c and d: values with different letters in the same row means statistically significant at ( P<0.05), A, B of overall mean with different superscripts are significant differences (p<0.05). ±SE1, Standard error for treatments = Early pregnancy and Late pregnancy
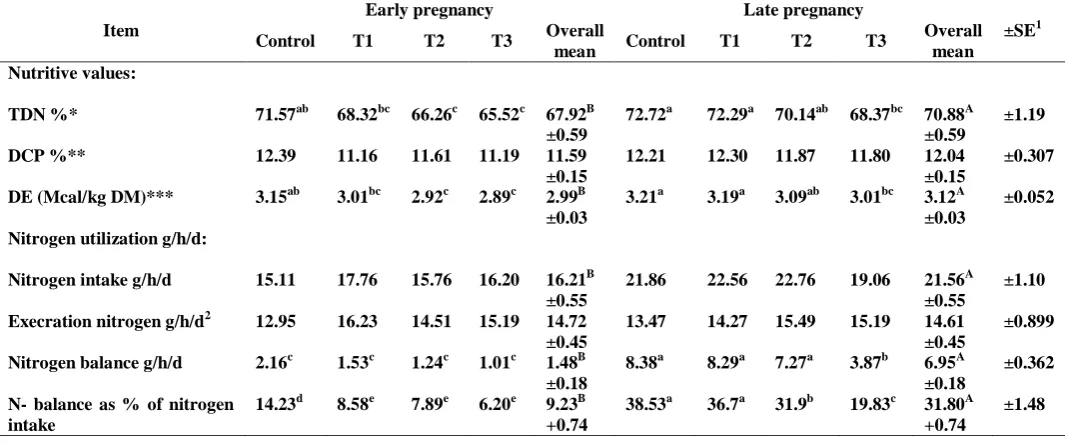
Nutritive values and Nitrogen balance
Data of Table (4) showed significant decrements of TDN, DCP, DE, and nitrogen balance as the level of Se + Vit. E injection was increased. Corresponding values were significant higher in late pregnancy than early pregnancy. The results of DCP (%) declared that there weren’t any significant differences among the treatments and overall of the two periods. In agreement, Kumar
et al. (2008) reported that no significant effect of supplemental Se at 0.15 or 0.30 mg/kg DM on intake of DCP and TDN in sheep. Nicholson et al (1991) found no effect with Se supplementation to all ration of lambs and buffalo calves on nutritive value of ration (TDN and DCP).
The overall means of TDN, DCP, DE, and nitrogen balance at the early period of pregnancy were significantly lower (p<0.05) than that of the late period of pregnancy. The results of DCP (%) declared that there weren’t any significant differences among the experimental treatments and overall means of the two periods.
Nitrogen balance (NB) of doe goats were (1.48g/h/d) and (6.95 g/h/d) for the early and late pregnancy periods, respectively. On the other hand, supplementation of both Se plus Vit. E was found to decrease NB at early pregnancy. During late pregnancy,the same trend of NB was found on control, T1 and T2; yet the value was lower (3.87g/h/d) for T3 may be because of the decrease intake and TNI in total CP with increase Selenium plus vitamin E supplementation (Table 4).
Table (4) Effect of treatment on nutritive values and nitrogen utilization of Baladi doe goats during early and late pregnancy periods
Item
Early pregnancy Late pregnancy
±SE1 Control T1 T2 T3 Overall
mean Control T1 T2 T3
Overall mean Nutritive values:
TDN %* 71.57ab 68.32bc 66.26c 65.52c 67.92B ±0.59
72.72a 72.29a 70.14ab 68.37bc 70.88A ±0.59
±1.19
DCP %** 12.39 11.16 11.61 11.19 11.59 ±0.15
12.21 12.30 11.87 11.80 12.04 ±0.15
±0.307
DE (Mcal/kg DM)*** 3.15ab 3.01bc 2.92c 2.89c 2.99B ±0.03
3.21a 3.19a 3.09ab 3.01bc 3.12A ±0.03
±0.052
Nitrogen utilization g/h/d:
Nitrogen intake g/h/d 15.11 17.76 15.76 16.20 16.21B ±0.55
21.86 22.56 22.76 19.06 21.56A ±0.55
±1.10
Execration nitrogen g/h/d2 12.95 16.23 14.51 15.19 14.72 ±0.45
13.47 14.27 15.49 15.19 14.61 ±0.45
±0.899
Nitrogen balance g/h/d 2.16c 1.53c 1.24c 1.01c 1.48B ±0.18
8.38a 8.29a 7.27a 3.87b 6.95A ±0.18
±0.362
N- balance as % of nitrogen intake
14.23d 8.58e 7.89e 6.20e 9.23B +0.74
38.53a 36.7a 31.9b 19.83c 31.80A +0.74
a, b, c and d: values with different letters in the same row means statistically significant at( P<0.05), A,B of overall mean with different superscripts are significant differences (p<0.05). TDN, *Total digestible nutrients, DCP, **Digestible crude protein, DE***Digestible energy (M cal/kg DM) = 0.04409*TDN% was calculated according to N.R.C (1988), ±SE1, Standard error = Early pregnancy and Late pregnancy, Execration nitrogen g/h/d2=N faces+ N urine
Generally, the superiority in nitrogen retention due to specific ration is affected by several factors such as the increasing presence of fermentable energy and possible production of microbial protein synthesis (Hagemeister et al., 1981). Tekchandani and Arom (1978), Khirwar and Arora (1976) and Hansard (1983) noticed that animals fed on high Se diets were in a negative state of N balance and the digestibility of CP and other nutrients were also lower in high-Se groups. It is possible that microbial protein synthesis might have been reduced due to high Se intake. Bakshi et al. (1986) observed significantly higher excretion of N through faces and urine in male buffaloes given high-Se urea treated straw (2.14 ppm Se) as compared to those given low-Se urea treated wheat straw (0.21 ppm Se). Oldham et at. (1977) reported that there are several factors which can affect protein/nitrogen utilization in ruminants including level, source, and degradability of dietary nitrogen, level, and type of carbohydrates which match the synthetic protein ability of rumen microbes. Nitrogen balance gives an idea regarding the extent of utilization of dietary nitrogen and finally, the amount lost or retained in the body. It is well known that tissue needs for the nitrogen of a ruminant animal are met by the microbial protein synthesized in the rumen and the degraded protein that escapes from microbial breakdown further gets digested and absorbed from the small intestine. Fecal excretion was comparable in animals given Selene-methionine or sodium selenite, but urinary excretion was reduced in animals given Selene-methionine (Ehlig et al., 1967). Fecal excretion is generally greater than urinary excretion in ruminants and exhalation a major route of Se excretion only when toxic concentrat ions are consumed. Chander (1998).
Body weight of goats
Final body weight and total body weight gain are in Table (5). Injection of Se plus vitamin E did not have any significant effects on live body weight at 90 days, before and after kidding. The highest final live body weight was recorded for injection level 0.125 mg Se plus 1.71u Vitamin E; T1(23.87) followed by that 0.250 mg Se plus 3.4Iu vitamin E; T2 (21.95) and the lowest one was observed with level 0.310 mg Se plus 4.2 Vitamin E; T3(20.17 Kg). In general, final live body weight was increased with decreasing level of Se plus vitamin E. Also, treatment increased weight gain during pregnancy period in Baladi doe goats after parturition in T2 (2.40 Kg), T1 (2.33 Kg), control (1.80 Kg) compared with T3 (0.917 Kg).
These results are in agreement with those reported by Tufarelli and Laudadio (2011) found no significant differences (P<0.05) were registered in body weight gain among groups of dairy Jonica goats fed rations containing sodium selenite as the Se supplement in concentrate (0.20 mg/head per day of Na-selenite and 20 mg/day per head of Vit. E). On the contrary, Yue et al. (2009) reported that dietary supplemental Se improved significantly the average gain and the final body weight and average daily gain.
Table (5) Effect of treatment on body weight changes of Baladi doe goats during gestation
Item Control T1 T2 T3
Initial body weight(kg) 20.30±1.91 21.92±1.74 19.90±1.91 19.75±1.74 Body weight at 90 days (kg) 24.71±1.86 25.96±1.70 23.70±1.86 22.56±1.70 Body weight before kidding 28.50±1.93 30.52±1.76 28.96±1.93 26.21±1.76 Body weight after kidding 21.10±1.67 24.25±1.52 22.30±1.67 20.66±1.52 Body weight loss, just after kidding( kg) 6.40±0.827 6.27±0.755 6.66±0.827 5.55±0.755 %of body weight loss, 22.25±2.28 20.93±2.08 23.12±2.28 20.86±2.08 Final live body weight (kg) 21.74±1.66 23.87±1.52 21.95±1.66 20.17±1.52 body weight gain( g/day) 1.80±0.767 2.33±0.700 2.40±0.767 0.917±0.700 Total body weight gain (g/day) 1.44±0.762 1.96±0.695 2.05±0.762 0.421±0.695 a, b, c and d: values with different letters in the same row means statistically significant at (P<0.05).
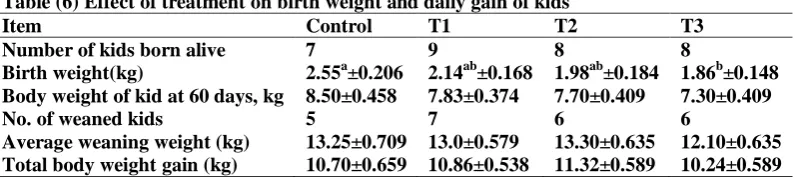
Body weight of kids
Results of Table (6) clearly indicated that Se+ vit E injection significantly decreased birth weight, 60 days and weaning weights and daily gain of kids compared with control. These results are in agreement with those obtained by Gunter et al. (2003) mentioned that in pregnant cows, Se supplementation had no effect on body weight; birth weight; total body weight gain, and average daily gain (ADG) of calves. Moreover, Vinu et al (2012) found that supplemented Se- yeast at rate of 0.3 ppm to calves diets did not reveal any significant difference on daily body weight gain as compared with control.
Table (6) Effect of treatment on birth weight and daily gain of kids
Item Control T1 T2 T3
Number of kids born alive 7 9 8 8
Birth weight(kg) 2.55a±0.206 2.14ab±0.168 1.98ab±0.184 1.86b±0.148 Body weight of kid at 60 days, kg 8.50±0.458 7.83±0.374 7.70±0.409 7.30±0.409
No. of weaned kids 5 7 6 6
Total daily gain gm/day 89.16±5.49 90.48±4.48 91.25±4.91 85.28±4.91 a, b, c and d: values with different letters in the same row means statistically significant at (P<0.05),
However, Ibrahim (2016) found that maternal Se supplementation improved body gain of their lambs. The beneficial effects of supplemental Se on animal performance was reported to improve the birth weight of lambs (Ali et al., 2004) and average body weight for new born lambs (Hefnawy et al., 2014). (Gabryszuk and Klewiec, 2002). Supplementation of Se (0.15mg Se/kg of diet) through sodium selenite increased average daily gain improving the growth rate (Kumar et al., 2009). In consistency, Se supplementation increased cow BW, and calf birth, weaning, and post-weaning weights, or weight per day of age in early lactation (Sprinkle et al., 2006). However,
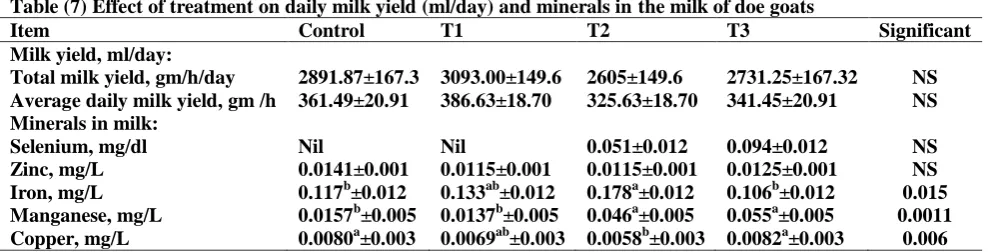
Milk yield
Data of Table (7) showed non-significant differences among treatments for either total or daily milk yields. The highest values were recorded for T1whereas lowest values were noticed for T2. Lactation curves of the four groups as illustrated in Figure (1) indicated that milk yield decreased (P <0.05) at two and four weeks of lactation for goats fed T3 compared with those fed control, T1 and T2. Milk yields of the experimental groups (T1, control, and T3) were significantly increased throughout the different intervals (2-16 week) of the experiment as compared to group T2. It was also found that the milk yield of T1 was higher than those of other experimental groups during the lactation period; while T2 had the lowest milk yield. There are no significant differences among the average daily milk production values of the experimental goat groups, but it is noticeable that, goat in 0.125 mg Se plus1.71 IU Vit. E (T1) produced a higher value of total milk production during the lactation season period followed by control, T3, and then T2 goat groups. According to Politis and Kwai-Hang (1988) and Pauselli et al. (2004), the only positive effect of dietary vitamin E or /and Se supplementation on all milk characteristics were mainly correlated to mammary glands health. Salih et al. (1987) mentioned that cows fed dietary and dietary plus injected Se and vitamin E had more Se in milk than milk from cows fed no supplemental selenium. Cows are given Se and Vit. E in late pregnancy produces large quantities of milk. Lacetera et al. (1999) indicated that milk yield on day 70 of lactation was significantly higher in injected ewes compared to the control ones. Ghoneem (2016), when supplemented vitamin E and selenium, found insignificant increases in milk yield with 250IU vitamin E and 2mg selenium /h/d compared with control. Al demonstrated that Se in the diet of lactating cows did not show improvements in milk production (Gierus et al., 2002 and Heard et al., 2007). Kholif and Khorshed (2006) concluded that organic Se supplementation to the diets of buffaloes improved rumen activity, nutrients digestibility, and milk production.
Figure (1) Average weekly milk yield of experimental groups during the lactation period
Mineral status in the milk
Trace minerals that have been identified as important for normal immune function and disease resistance include zinc, iron, copper, manganese and selenium (Fletecher et al., 1988).
Regarding zinc levels, it was observed that there were no significant differences in zinc concentrations among exper imental groups. However, the highest zinc concentration in milk recorded with control (0.0141 mg/l) followed by T3 (0.0125mg/l) and t he lowest values was recorded with T1 and T2 (0.0115mg/l).
Concerning iron levels, injection of Se and Vit. E had a significant effect on milk iron level where it increased in T1 (0.133mg/l) and T2 (0.178 mg/l), whereas it decreased in T3 (0.106 mg/l) and control (0.117 mg/l) mg/l.
Data revealed that milk manganese level increased significantly in T2 (0.045 mg/l) and T3 (0.082 mg/l), whereas it was remarkably the lowest in control (0.014 mg/l) and T1 (0.014 mg/l) which might be due to the increase of selenium level of treated groups T2 and T3. Meanwhile, copper milk level was significantly (P<0.05) increased for goats fed on T3 (0.0082 mg/l) and control (0.00.80 mg/l) compared to T1 and T2 (0.0069 and 0.0058 mg/l).
Table (7) Effect of treatment on daily milk yield (ml/day) and minerals in the milk of doe goats
Item Control T1 T2 T3 Significant
Milk yield, ml/day:
Total milk yield, gm/h/day 2891.87±167.3 3093.00±149.6 2605±149.6 2731.25±167.32 NS Average daily milk yield, gm /h 361.49±20.91 386.63±18.70 325.63±18.70 341.45±20.91 NS Minerals in milk:
Selenium, mg/dl Nil Nil 0.051±0.012 0.094±0.012 NS
Zinc, mg/L 0.0141±0.001 0.0115±0.001 0.0115±0.001 0.0125±0.001 NS
Iron, mg/L 0.117b±0.012 0.133ab±0.012 0.178a±0.012 0.106b±0.012 0.015
Manganese, mg/L 0.0157b±0.005 0.0137b±0.005 0.046a±0.005 0.055a±0.005 0.0011 Copper, mg/L 0.0080a±0.003 0.0069ab±0.003 0.0058b±0.003 0.0082a±0.003 0.006 a, b, c and d: values with different letters in the same row means statistically significant at (P<0.05)
Blood parameters
Nutritional status and animal health can be assessed using blood metabolic profile (Herdt et al., 2000). The most important factors affecting the concentration of blood metabolic indicators are nutrition and physiological status (Roubies et al., 2006).
Creatinine
Results showed that creatinine level at an early period of pregnancy (0.887 mg/dl) was significantly (P<0.01) lower than that of the late pregnancy (1.34mg/dl) (Table 8). In consistence, Khatun et al. (2011) reported that creatinine showed a general increasing trend in ewes’ serum during different stages of pregnancy. On sheep, Abdel-Hafez (2002) reported that serum creatinine concentration increased gradually with advancing pregnancy. Moreover, Piccione et al. (2009) found that the creatinine level was affected by the physiological phase and showed a higher level during the late pregnancy and early lactation. Abeni et al. (2004) reported that plasma creatinine increased during late gestation in heifers, cows, and their calves.
There was significant (P<0.01) decrease in overall mean at zero time in creatinine than that of the 6hr after feeding. Moreover, there was an increment in creatinine concentration at six hours after feeding in selenium and vitamin E injection groups in comparison with the control. These results may be due to the important nutrient in supporting the efficient of rumen fermentation and microbial protein synthesis. Reda (2011) showed that creatinine level increased with the pregnancy stages in the treated groups injected with both Se and Vit. E compared to the control group.
Urea
Blood urea concentration of animals at the early pregnancy period was (41.13 mg/dl) compared to (35.89 mg/dl) for the late pregnancy period. The significant increment in the level of urea during pregnancy might be related to nutritional management and high protein metabolism (Gurgoze et al., 2009). Broz Ostowski et al. (1996) observed an increase in urea level during early pregnancy where there was a decrease in late pregnancy in ewes.
Supplementation of Se plus Vit. E hadn’t any significant effects on urea levels of treated groups at both periods of pregnancy or feeding. However, Slavik et al. (2008) reported that serum urea level increased with Se (sodium selenite) supplementation of a beef cow.
AST and ALT
The present findings declared that the period of pregnancy had a significant effect on aspartate amino transferase (AST) levels where early pregnancy had higher AST levels than those of the late period. Data of AST values did not differ significantly between zero time and 6hor. After feeding. Moreover, the highest value of AST was recorded before feeding while the lowest was at 6 hrs. after feeding in early pregnancy (Table 8). This decrement in AST levels could be attributed to the more muscle stability in the treated ewes at the time of parturition and one week later than non-treated ewes (Allen et al., 1986). At late pregnancy, AST was higher in 6 hours after feeding than that at zero time.
On the other hand, injection of Se and Vit. E increased (P<0.001) serum AST levels vs. control group with values being (30.13, 22.67µ/L) for T1 and T2, respectively, vs. (18.59 µ/l) for the control group at zero time in early pregnancy (Table 8).
time indicated higher ALT at 6 hrs. after feeding comparison with zero time — the injection of both Se and Vit. E did not show significant effects on the ALT of treated groups (Table, 8).
Both AST and ALT levels increased significantly in late pregnancy (Table 8). The increased AST and ALT at 6hrs after feeding may be due to different measuring time. However, all serum parameters reported in the present study are within the normal range, as reported by William (1997). The increase in AST levels may be due to the great muscular effort which is exerted during the process of calving (Farrag et al., 1984) or may be related to the hormonal changes that occurred during the last stage of gestation. Jovanovic et al. (1997) observed an increase in AST and ALT levels in cows during pregnancy. Eman (2000) showed that injected pregnant ewes with sodium selenite alone on the 3rd and 4th month of pregnancy exhibited a decrease in serum AST and ALT. Se and alpha-tocopherol administration decreased AST enzyme activity in lambs during late gestation (Andres et al., 1997). In the present study, the increase in ALT and AST may be due to increasing cellular basal metabolic rate, irritability and the destructive changes of liver and skeletal muscle cells (Ahmed and Shalaby, 1993). Serum ALT activity showed a tendency to decrease in late gestation in the Angora goats in the study of Simsek et al. (2015).
Table (8) Effect of treatment on blood serum metabolites of Baladi doe goats at early and late pregnancy periods
Item Time Treatments Creatinine
mg/dl
Urea mg/dl
AST
μ/L ALT μ/L
E
ar
ly
p
re
gn
an
cy Zer
o
tim
e Control 0.764 36.73 18.59
c
5.94
T1 0.719 43.02 30.13a 7.25
T2 0.806 35.6 22.67b 7.65
T3 0.846 36.84 11.59ef 6.57
6
h
ou
rs Control 0.891 45.76 10.10
f
7.76
T1 1.003 48.21 15.23d 8.05
T2 1.081 46.08 18.72c 8.80
T3 0.989 36.84 10.39f 9.34
±SE 0.140 2.57 1.03 0.705
Overall mean of period 0.887B±0.049 41.13A±0.909 17.18A±0.364 7.67A±0.249
L
at
e
p
re
gn
an
cy Zer
o
tim
e Control 1.326 36.65 9.75
f
4.94
T1 1.275 37.61 9.20f 4.81
T2 1.173 37.58 8.52f 4.87
T3 1.336 42.21 8.87f 5.85
6
h
ou
rs Control 1.265 31.66 11.28
ef
6.07
T1 1.448 35.72 13.69de 6.50
T2 1.234 33.03 15.44d 6.80
T3 1.663 32.67 22.34b 7.60
±SE 0.122 2.23 0.894 0.611
Overall mean of period 1.34A±0.043 35.89B±0.787 12.39B±0.316 5.93B±0.216
Overall mean of zero 1.031B±0.046 38.28±0.851 14.92±0.341 5.99B±0.233
Overall mean of 6hrs 1.197A±0.046 38.74±0.851 14.65±0.341 7.62A±0.233
significant
period <0.0001 <0.0001 <0.0001 0.0001
time 0.0155 0.7 0.583 <0.0001
P*T*Tr 0.698 0.614 0.0054 0.642
a, b, c and d: values with different letters in the same row means statistically significant at (P<0.05) A, B of overall mean with different superscripts are significant differences (p<0.05).
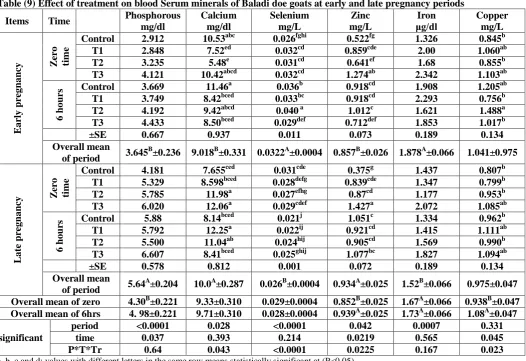
Serum mineral levels
Minerals occur in body fluids and tissues as electrolytes concerned with the maintenance of osmotic pressure, acid-base balance, membrane permeability, and tissue irritability (Underwood and Suttle, 1999).
Serum phosphorus concentrations
The highest value of P (5.64 mg/dl) was recorded for late pregnancy compared (3.64mg/dl) for early pregnancy (Table, 9). The overall mean of P concentration increased significantly in 6 hours after feeding than those at zero time (Table 9). Moreover, P concentration in animals injected with Se plus Vit. E increased in all treated group. However, the differences among experimental groups as results of injection were not significant.
Serum calcium concentrations
recorded lower Ca values than their counterparts of control group at both sampling times (Table, 9) while during late pregnancy the lowest value for control group at zero and 6 hr. after feeding compared to all treatments.
This decrement might be due to some slight decrease in the calcium with high-level Se plus vitamin E injected goats. Dietary calcium content influenced Se absorption in dairy cattle (Harrison and Conrad, 1984). However, Mudgal et al. (2008) reported that supplementation of 0.3 ppm selenium did not affect calcium and phosphor metabolism in the male buffalo calves. Activity of enzymes increases when cells are damaged, and enzymes are released from intracellular space into the blood. From the above-given, it follows that levels of selenium that were used in the present study did not have any toxic effect on sheep (Panev et al. 2013).
Serum selenium concentrations
No significant differences were observed in Se concentrations as affected by the time of feeding. In (Table 9) indicated that there was significant (P<0.01) difference among the two periods of pregnancy. Serum selenium concentration at late period pregnancy (0.026mg/l) was significantly lower (P<0.01) than that of the early pregnancy (0.032mg/l). A possible reason for the decrease is the use of Se to increase the activity in selenoenzymes and other Selene proteins in the process of fetal growth (Abdelrahman and Kincaid 1993). An increased Se concentration in the amniotic fluid, liver, and plasma of the ewe has been found during early pregnancy, while the increase in fetal organs, especially kidney, liver and the thyroid gland occurs during late pregnancy (Hefnawy et al., 2007).
On the other hand, Table (9) clearly showed significant differences among all treatments during different early and late pregnancy. Serum selenium concentration in goats increased significantly (P<0.01) with T1 (0.032), T2 (0.031) and T3 (0.032) compared with control (0.026) in zero time. While the serum selenium values were higher after 6 hours post feeding at early pregnancy, whereas the lowest values of selenium at 6hours post feeding more than at zero time pre-feeding at late pregnancy.
Table (9) Effect of treatment on blood Serum minerals of Baladi doe goats at early and late pregnancy periods
Items Time Phosphorous
mg/dl Calcium mg/dl Selenium mg/L Zinc mg/L Iron
μg/dl Copper mg/L
E ar ly p re gn an cy Z er o tim
e Control 2.912 10.53
abc
0.026fghi 0.522fg 1.326 0.845b
T1 2.848 7.52ed 0.032cd 0.859cde 2.00 1.060ab
T2 3.235 5.48e 0.031cd 0.641ef 1.68 0.855b
T3 4.121 10.42abcd 0.032cd 1.274ab 2.342 1.103ab
6
h
ou
rs Control 3.669 11.46
a
0.036b 0.918cd 1.908 1.205ab
T1 3.749 8.42bced 0.033bc 0.918cd 2.293 0.756b
T2 4.192 9.42abcd 0.040 a 1.012c 1.621 1.488a
T3 4.433 8.50bced 0.029def 0.712def 1.853 1.017b
±SE 0.667 0.937 0.011 0.073 0.189 0.134
Overall mean
of period 3.645 B
±0.236 9.018B±0.331 0.0322A±0.0004 0.857B±0.026 1.878A±0.066 1.041±0.975
L at e p re gn an cy Z er o tim
e Control 4.181 7.655
ced
0.031cde 0.375g 1.437 0.807b
T1 5.329 8.598bced 0.028defg 0.839cde 1.347 0.799b
T2 5.785 11.98a 0.027efhg 0.87cd 1.177 0.953b
T3 6.020 12.06a 0.029cdef 1.427a 2.072 1.085ab
6
h
ou
rs Control 5.88 8.14
bced
0.021j 1.051c 1.334 0.962b
T1 5.792 12.25a 0.022ij 0.921cd 1.415 1.111ab
T2 5.500 11.04ab 0.024hij 0.905cd 1.569 0.990b
T3 6.607 8.41bced 0.025ghij 1.077bc 1.827 1.094ab
±SE 0.578 0.812 0.001 0.072 0.189 0.134
Overall mean of period 5.64
A
±0.204 10.0A±0.287 0.026B±0.0004 0.934A±0.025 1.52B±0.066 0.975±0.047
Overall mean of zero 4.30B±0.221 9.33±0.310 0.029±0.0004 0.852B±0.025 1.67A±0.066 0.938B±0.047 Overall mean of 6hrs 4. 98±0.221 9.71±0.310 0.028±0.0004 0.939A±0.025 1.73A±0.066 1.08A±0.047
significant
period <0.0001 0.028 <0.0001 0.042 0.0007 0.331
time 0.037 0.393 0.214 0.0219 0.565 0.045
P*T*Tr 0.64 0.043 <0.0001 0.0225 0.167 0.023
a, b, c and d: values with different letters in the same row means statistically significant at (P<0.05) A,B of overall mean with different superscripts are significant differences (p<0.05).
(2005) reported that injection of 0.3 mg Se/kg BW increased the blood Se concentration in pregnant goats. Cuesta et al. (1995) evaluated the effects of high-dose Se (1.5mg, Se/BW) injection to pregnant ewes and they observed that the treatment did not affect serum Se concentrations of lambs or ewes. While the data presentation of late pregnancy showed that serum Se concentration decreased at 6 hrs. Post feeding, the highest Selenium value was recorded for goats at zero time before feeding. Abd EL-Ghany and Torora-Perez (2010) found that critical moment in the availability of Se in the female is the end of gestation and during lactation, in which females transfer the element to fetuses (Placental transfer) and offspring. Kumar et al. (2009) found that supplementation of 0.15 mg Se/kg DM to lambs either through inorganic or organic source linearly increased serum Se leve l with the increasing duration of experimental feeding in both the Se supplemented groups. Faixová et al. (2007) observed higher Se concentration and GSH-Px activity in lambs that received increased doses of Se. In the end, selenium concentration increased at the early pregnancy period and decreased at late pregnancy.
Serum zinc concentration
The data of Table (9) represented the serum zinc at different sampling times and the overall means of these values; the data showed that zinc level increased by feeding at 6 hours post feeding more than at zero time pre-feeding. Also, the overall mean of Serum zinc at the early pregnancy period was (0.857mg/l) compared to (0.934mg/l) for late pregnancy period with significant manner. Data of serum zinc showed that there were significant (P<0.05) differences among treatments at both early and late pregnancy periods. On the other hand, the higher value of serum zinc found with supplement Se plus Vit. E groups as compared with the control group may be due to the effect of S supplementation. There was probable interaction between Se and zinc (Seboussi et al. 2008). In the present data, serum Zn levels in the Se and Vit E treated goats increased significantly during pregnancy. Dams in the last stage of pregnancy and around calving time lose more Zn than they ingest as a normal physiological process and the blood Zn level declines around calving. Thus their Zn reserves are depleted (Goff and stable 1990).
Serum iron concentrations
The level of serum iron decreased at late gestation period and increased in early pregnancy at zero time before feeding and 6 hours post feeding. Also, the difference between early and late pregnancy was not significant at zero and 6 hours of feeding, while the difference among all treatments was not significant.
Grgoze et al. (2009) noted that the level of iron in the Awassi ewes always decreased at gestation and lactation periods and there was a low serum Fe concentration in early pregnancy. Serum iron concentrations increased with increasing the dose of Se plus Vit E injection in groups at 6hrs. after feeding. While iron values were higher at zero time of T3 (2.07) than those other groups, Swenson et at., (1993) indicated that the decrease in plasma Fe during late pregnancy could be related to the great demand for this element by the foetus and /or the increase of adrenocortical hormones during late pregnancy might decrease plasma iron. Moeini et al. (2011) demonstrated that the iron concentrations in all calves were similar and in the normal range and Se injection did not affect the iron concentrations in calves of the treatment groups. Also, data in the present study revealed that goats injected with Se and vitamin E had a higher value of iron in all physiological stage than the control group.
Serum copper concentrations:
The data from in Table (9) showed no significant differences in early and late pregnancy periods (1.04mg/l) and (0.975mg/l). The overall means of Cu was the lowest during the zero time then increased at 6 hours post feeding. Serum copper concentrations among goats Se plus Vit. E injected and control groups clearly showed that the concentrations were significant at zero time before feeding and at 6 hours post feeding. Also, the present results revealed that positive effect of Se and vitamin E injection to the pregnant goats on their serum copper (Cu) level. This finding is in agreement with the result of Kojouri and Shirazi (2007) indicated that vitamin E and Se supplementation increases serum copper concentration in treated ewes during the 1st month of age. Moeini et al. (2011) noted that Se and Vit. E injection did not affect serum Cu concentrations in heifers at parturition day. Cows fed diets which contained 0.3 mg Se/kg DM (H Se and H Se VE groups) had higher (P<0.05) Se concentration in plasma and milk than those cows fed diets which contained 0.15 mg Se/kg DM (LSe and LSe VE groups). Zhao et al. (2008) indicated possible negative interaction between organically bound selenium and copper. Antagonism between Cu and Se has been documented in animal studies (Hill, 1974). There is interference caused by high iron levels for the absorption of zinc, copper, and manganese (Bremner et al., 1987 and Gengelbach et al., 1994) and decreased zinc absorption in the presence of high dietary calcium. Rdouan
et al. (2006) recorded that supplementation of trace elements (Cu, Mn, Zn, Fe, and Se) have improved lambing rates in deficiency situations, but only for Se there is strong evidence that embryo survival during implantation is affected (Robinson,1990).
CONCLUSION
Selenium concentrations change considerably during pregnancy, depending on the level of Se injected. The results of the current study revealed that lower level (0.125 mg Se plus 1.7 IU Vit. E/ kg /kg BW) injection during early and late gestation periods improved nutrients digestibility, nutritive values, nitrogen utilization and increased milk yield of does.
REFERENCES
A O A C. 1997. Official Methods of Analysis. 16th Ed. Assoc. Office. Anal. Chem., Arlington, VA.
Abd El-Ghany, H. and Tortora-Perez, J. L. 2010. The importance of selenium and the effects of its deficiency in animal health. Small Ruminant Research, (89) 2: 185- 192.
Abdel- Hafez, M. A. M. 2002. Studies on reproductive performance in sheep. Ph. D. Thesis, Fac. Agric. Zagazig Univ. Egypt. Abdelrahman, M. M. and Kincaid, R. L. 1993. Deposition of copper, manganese, zinc and selenium in bovine foetal tissue at
different state of gestation. Journal of Dairy Science (76), 3588- 3593.
Abeni, F.; Bergoglio, G.; Masoero, G.; Terzano, G. M. and Allegrini, S. 2004. Plasma hormones and metabolites in Piedmontese cows during late pregnancy. Relationships with calf birth weight. J. Anim. Sci., (82): 438-444.
Ahmed, W. M. and Shalaby, S. I. 1993. Some enzymatic activity in sera and uterine homogenates in buffalo and cows during some reproductive phases and disorders. Indi. J. Anim. Sci., (63): 1248- 1253.
Ali, A.; Morrical, D. G.; Hoffman, M. P. and Al – Essa, M. F. 2004. Evaluation of vitamin E and selenium supplementation in late gestation on lamb survival and pre- weaning growth. The professional Animal Sciences, (20): 506- 511.
Allen, J. G.; Steele, P.; Masters, H. and Antuono, M. 1986. A study of nutritional myopathy in weaner sheep. Aust. J. Vet., 63:8-13.
Andres, S.; Mane, M.C. and Sanchez, J., 1996. Changes in GSHPX and muscle enzyme activities in lambs with nutritional my degeneration following a single treatment with sodium selenite. Small Rumen. Res., v.23, p.183-186.
Andres, S.; Mane, M.C.; Sanchez, J.; Barrera, R.; Zaragoza, C. and Jimenez, A. 1997. Response to barium selenite supplementation in sheep kept at pasture in the Mediterranean area. Vet. Res., 28 (6): 539- 545.
Bakshi, M.P.S.; Langar, P.N.; Rana, R.P. and Kalyal, J.C., 1986. Selenosis in buffaloes fed rice straw. World Rei’. Anim. Prod, 22:57-62.
Bayril, A.; A. S.Yildiz; F. Akdemir; C. Yalcinl; M. Kose and O. Yilmaz., 2015.The technical and financial effects of parenteral supplementation with selenium and vitamin E during late pregnancy and the early lactation period on the productivity of dairy cattle .Asian Australas . J. Anim. Sci., 28:1133-1139.
Bremner, I. W.; Humphries, R.; Philippo, M.; Walker, M.J. and P.C. Morrice., 1987. Iron induced copper deficiency in calves: dose-response relationships and interactions with molybdenum and sulphur. J. Animal production. 45: 403-410.
Brown, K. M. and Arthur, J.R., 2001. Selenium, selenoproteins and human health: a review. Public Health Nutrition, 4(2B):593-599.
Broz Ostowski, H.; Milewski, S.; Wasilewska, A. and Tanski, Z. 1996. The influence of the reproductive cycle on levels of some metabolism indices in ewes. Arch. Vet. polonic., 35: 53-62.
Carlos E.; Oltramari, Maria da G.; Pinheiro, Mariana S. de Miranda, Juliana R.P.; Arcaro, Lívia Castelani, Luciandra M. Toledo, Luiz A. Ambrósio, Paulo R. Leme, Marcelo Q. Manella., 2014. Selenium Sources in the Diet of Dairy Cows and Their Effects on Milk Production and Quality, on Udder Health and on Physiological Indicators of Heat Stress Italian Journal of Animal Science, 13:1, 2921, DOI: 10.4081/ijas.2014.2921
Ceballos, A.; Sanchez, J.; Stryhn, H.; Montgomery, J. B.; Barkema, H.W. and Wichtel, J. J., 2009: Meta-analysis of the effect of oral selenium supplementation on milk selenium concentration in cattle. Journal of Dairy Science, 92 (1):324-342.
Chander, ER, Datt., 1998. Selenium metabolism in the rumen its absorption and urinary excretion in cattle and buffaloes, M.Sc. thesis, (Animal Nutrition). (Deemed University) (I.C.A.R.) Karnal-132 001 (HARYANA), INDIA
Chris F.; Hostetler, Ronl.; Kin Caid and Mark A. Mirandl., 2003 The role of essential trace elements in embryonic and fetal development in livestock volume 166,Issue 2, 125-139.
Cuesta, P. A.; L. R.; Mcdowell, W. E. Kunkle,, 1995. Effects of high- dose prepartum injections of Se and vitamin E on milk and serum concentrations in ewes. Small Rumin. Res., V. 18, p. 99-103, 1995.
Dargatz, D. A. and Ross, P. F. (1996). Blood selenium concentrations in cows and heifers. J. Anim. Sci., 74:2891-2895.
Del Razo-Rodriguez, O.E.; J. E. Ramirez- Bribiesca; R. Lopez-Are llano; A.L. Revilla-Vazquez; S. S. Gonzalez- Munoz; M. A. Cobos-Peralta; L.M. Hernandez -Calva and L.R. McDowell (2013). Effects of dietary level of selenium and grain on digestive metabolism in lambs. Czech J. Anim. Sci., 58, (6): 253–261.
Duncan, D. B. (1955). Multiple range and multiple F – tests. Biometrics, 11: 1-42.
Ehlig, C.F.; I1ogue, D.E.; Allaway, W.H. and Hamm, 1., 1967. Fate of selenium from selenite or selenomethionine with or without vitamin E in lambs. . J. ar. ,92:121.
Eman, S. M. (2000). Studies on vitamin E deficiency in lambs (stiff lamb disease). Ph. D. thesis faculty of veterinary medicine, Cairo University.
Farrag, A. A.; Salem, T. A.; Gomaa, A. and Matez, A. M., 1984. Studies on serum enzymatic activities and blood picture in relation to uterine involution in cow and buffaloes. Assuit Vet. Med. J., (12):219-225.
Fawcett. J.K. and Scott. J. E. (1960). J. Clin. Path., 13:156-159.
Fisher, I. L; Hoggendoorn, C. and Montemurro. 1., 1980. The effect of added dietary selenium on the selenium content of milk, urine and feces. (An. J. Anim. Sci., 60: 79-80
Gabryszuk, M.; and Klewiec, J., 2002. Effect of injecting 2- and 3-year-old ewes with selenium and selenium –vitamin E on reproduction and rearing of lambs. Small Rumin. Res., v.43, p. 127-132.
Gengelbach, G.P.; Ward, J. D. and Spears, J. W., 1994. Effect of dietary copper, iron, and molybdenum on growth and copper status of beef cows and calves. J. Anim. Sci. 72:2722-2727.
Ghoneem, M.A Wafaa., 2016. Impact of sunflower seeds And or vitamin E and selenium supplementation on milk composition and fatty acids profile of lactating Baladi goats J. Nutrition and Feeds 19 (2): 199-209.
Gierus, M., Schwarz, F.L., Kirchgessner, M., 2002. Selenium supplementation and selenium status of dairy cows fed diets based on grass, grass silage or maize silage. J.Anim. Physiol. An. N.86:74-82.
Goff, J. P. and Stabel, J. R., 1990. Decreased plasma retinol, α-tocopherol and zinc concentration during the peripartum period: effect of milk fever. J. Dairy Sci., (73):3195-3199.
Grgoze, S. Y.; Abuzer, K.; Zonturlu, N. O. and Hasan, E. N., 2009. Investigation of some biochemical parameters and mineral substance during pregnancy and postpartum period in awassi ewes. Kafkas Univ. Vet. Fak. Derg., 15(6):957-963.
Gunter, S. A.: Beck, P. A. and hillips, J. M., 2003. Effects of supplementary selenium source on the performance and blood measurements in beef cows and their calves J.Anim. Sci., 81:856-864.
Gurgoze, S. Y.; A. K. Zonturlu; N. Ozyurtlu and H. Icen (2009): Investigation of some Biochemical parameters and Mineral Substance during pregnancy and postpartum period in Awassi Ewes. Kafkas Univ Vet Derg., 15 (6):957-963.
Gutteridge, J. M. C. and B. C. Halliwell., 1994. Free radicals and antioxidants in ageing and disease: fact or Fantasy. In: Antioxidants in nutrition, Health and Disease. Oxford Univ. press. Oxford, pp:111-123.
Hagemeister, H.; W. Lipping and W.K. Kaufimann., 1981. Microbial protein synthesis and digestion in the high yielding dairy cow. In: Recent Advances in Animal Nutrition. resign, PP.67. Butterworth, London.
Hansard, S.L., 1983. Microelements for ruminant animals. A Review. Nutr. Absfr. Rev.SeriesB, 53:1-24.
Harrison, J. H.: Hancock, D. D. and Conrad, H. R., 1984. Vitamin E and Selenium of the dairy cow. J. Dairy Sci., 67:123-126. Heard, J.W.; Stockdale, C.R.; Walker, G.P.; Shields, G.H.; McKenna, P.M.; Young, G. P, Doyle, P.T., 2007. Increasing selenium
concentration in milk: effects of amount of selenium from yeast and cereal grain supplements. J. Dairy Sci. 90:4117-4127. Hefnawy, Abd Elghany ; Seham Youssef; Villalobos Aguilera, P.; Valverde Rodríguez, C. and Tórtora Pérez, J. L., 2014.The
Relationship between Selenium and T3 in Selenium Supplemented and Non-supplemented Ewes and Their Lambs. Veterinary Medicine International J. Volume 2014, Article ID 105236, 6 pages.
Hefnawy, Abd Elghany; López-Arellano, R.; Revilla-Vázquez, A.; Ramírez-Bribiesca, E.; Tórtora- Pérez, J., 2007. The relationship between foetal and maternal selenium concentrations in sheep and goats. Small Ruminant Research 73, 174-180. Hill, C. H., 1974. Reversal of Selenium toxicity in Chicks by Mercury, cupper and Cadmium. J. Nutr. 104: 249-259.
Ibrahim, E.M., 2017. Effect of parenteral supplementation of vitamin E plus selenium on nutrient digestibility, productive performance and some serum biochemical indicators of lambs. Egyptian Journal of sheep & Goat Sciences, 12(1):59-70. Ibrahim. E. M., 2016. Productive performance, nutrients digestibility and some serum metabolic indices as affected by dietary
supplementation of copper and zinc in Egyptian buffalo calves. J Nutrition and Feeds 19 (2): 187-197.
Jovanovic, M. J.; Rajic, I.; Pesterac, V.; Crcev, D. and Cokrevski, S. 1997. Blood parameters in cows in advanced stages of gravidity and following parturition fed with rations of different structure. Vet. Glasnik., 51: 231-244.
Juniper, D. T.; Phipps, R. H.; Givens, D. L.; Jones, A. K.; Green, C. and Bertin, G., 2008. Tolerance of ruminant animals to high dose in –feed administration of a selenium- enriched yeast. J Anim Sci., 86:197-204.
Juniper, D. T.; Phipps, R. H.; Jones, A. K. and Bertin, G., 2006. Selenium supplementation of lactating dairy cows: Effect on selenium concentration in blood, milk, urine and feces. J. Dairy Sci., 89; 3544-3551.
Kassab, A. Y. and Mohammed, A. A., 2014. Effect of vitamin E and Selenium on some physiological and reproductive characteristics of Sohagi ewes Egyptian J. Nutrition and Feeds 17 (1): 9-18.
Kearl, L.C., 1982. Nutrient requirement of ruminates in developing countries international feedstuffs Institute Utah Agric. EXP. Station , Utah state Univ . Logan, U.S.A.
Kelleher, J., 1991. Vitamin E and the immune response. Proc. Nutr: Soc., 50: 245-249.
Khatun, A.; Wani, G. M.; Bhat, J. I. A.; Choudhury A. R. and Khan, M. Z. 2011. Biochemical indices in sheep during different stages of pregnancy. Asian J. Anim. Vet. Adv., 6 (2): 175-181.
Khirwar, S.S. and Arora, S.P., 1976. Influence of different levels of selenium on protein synthesis in vitro. Milchwissenschaft, 31:275-277,
Kholif, S. M. and Kholif, S.M. 2008. Effect of selenium enriched yeast supplementation on the productive performance of lactating buffaloes. Egyptian J. Nutr. and feeds, 11 (1):187-200.
Kholif, S. M.; And Khorshed, M. M., 2006. Effect of yeast or selenized yeast supplementation to rations on the productive performance of lactating buffaloes. Egyptian J. Nutr. and feeds, 9 (2):193-205.
Kincaid, R. L., 2008. Changes in the Concentration of Minerals in Blood of per partum Cows. Mid- South Ruminant Nutrition Conference. 1-8.
Knowles, S. O.; Grace, N.D.; Wurms, K. and Lee, J., 1999. Significance of Amount and Form of Dietary Selenium on Blood, Milk, and Casein Selenium Concentrations in Grazing Cows. Journal of Dairy Science, 82(2): 429-437.
Kojouri, G. A. and Shirazi, A. S., 2007. Serum concentrations of Cu, Zn, Fe, Mo and Co in newborn lambs following systemic administration of Vitamin E and selenium to the pregnant ewes. Small Ruminant Research. 70(2):136-139.