The handle http://hdl.handle.net/1887/20407 holds various files of this Leiden University dissertation.
Author: Maas, Jacinta
from Guyton to the ICU
Design cover by R.A.J.M. de Best and J. van Paassen Printed by UFB /Grafi sche Producties, Leiden
from Guyton to the ICU
Proefschrift
ter verkrijging van
de graad van Doctor aan de Universiteit Leiden,
op gezag van Rector Magnifi cus prof. mr. P.F. van der Heijden, volgens besluit van het College voor Promoties
te verdedigen op donderdag 17 januari 2013 klokke 11.15 uur
door
Jacomina Johanna (Jacinta) Maas geboren te Hillegom
Promotores: Prof. Dr. E. de Jonge Prof. Dr. L.P.H.J. Aarts
Co-promotor: Dr. J.R.C. Jansen
Overige leden: Prof. Dr. A.B.J. Groeneveld (Erasmus Universiteit Rotterdam)
Chapter 1 General introduction and outline of this thesis
Chapter 2 Bedside assessment of mean systemic fi lling pressure
Chapter 3 Assessment of venous return curve and mean systemic fi lling pressure in postoperative cardiac surgery patients
Chapter 4 Evaluation of mean systemic fi lling pressure from pulse contour cardiac output and central venous pressure
Chapter 5 Estimation of mean systemic fi lling pressure in postoperative cardiac surgery patients with three methods
Chapter 6 Arm occlusion pressure is a useful predictor of an increase
in cardiac output after fl uid loading following cardiac surgery
Chapter 7 Bedside assessment of total systemic vascular compliance,
stressed volume and cardiac function curves in ICU patients
Chapter 8 Determination of vascular waterfall phenomenon by bedside measurement of mean systemic fi lling pressure and critical
closing pressure in the ICU
Chapter 9 Partitioning the resistances along the vascular tree: effects of dobutamine and hypovolemia in piglets with an intact
circulation
Chapter 10 Cardiac output response to norepinephrine in ICU patients: interpretation with venous return and cardiac function curves
Chapter 11 Final considerations and clinical implications
Chapter 12 Summary/Samenvatting
Abbreviations
7
25
37
51
65
79
89
107
123
137
153
163
List of publications
Dankwoord
179
Chapter 1
General introduction and outline of this thesis
Jacinta J. Maasand Jos R.C. Jansen
General introduction and outline of this thesis
The circulation is a closed circuit, in which blood fl ows to the heart (venous return), to be pumped by the heart (via the lungs) to the aorta (cardiac output, CO). Starling placed the heart centrally in the circulation as demonstrated by the cardiac function curve (fi gure 1.1). Consequently, analysis of CO mostly focuses on preload, heart rate, contractility and afterload. However, it is important to realize that CO and venous return (VR) are intertwined, because the heart can only pump out that which it receives. In this respect preload can be redefi ned as VR. In steady-state conditions VR equals CO:
VR = CO
CO can differ from VR only for short periods of time, for example when contractility is changed with a positive or negative inotropic agent. However, as the heart cannot store blood volume or pump out more than venous return, CO and VR must reach a new equilibrium.
Figure 1.1 Cardiac function curve
Relationship between right atrial pressure (Pra) and cardiac output (CO).
Basic physiology of the circulation
Whether it is the heart or the VR that maintains circulation is still subject to debate.1,2 In cardiac failure, the heart obviously is the impeding component in the circulation and will determine the upper limit of CO. However, in persons without heart failure the question above still remains. Anderson makes a strong case for the VR as the driving force of the circulation.
CO [l/min]
Pra [mmHg]
During diastole the heart is fi lled with blood. Transmural intracardiac pressures remain positive even during diastole.3 Yet, only negative intracardiac pressures could suck
blood into the heart. It follows that the heart does not actively suck blood, but instead
fi lls passively. The heart can therefore be described as a passive fi lling pump, which even offers some resistance to fi lling, because of the heart’s limited volume-pressure compliance. So which force drives blood into the heart? Logically only a peripheral venous pressure in excess of right atrial pressure (Pra) could direct blood into the heart. The pressure gradient of this peripheral venous pressure and Pra determines VR.4,5 The
function of the heart is to lower the pressure at the ventricular inlet (Pra) and to raise the pressure at its outlet into the arterial system.6 The resulting pressure gradient between
the arterial and venous system will in turn maintain fl ow, completing the circle.
Is it possible to primarily increase CO? Positive inotropic agents, which increase contractility, also affect vascular tone.7,8 Thus theoretically, the most direct way to
increase CO would be to increase heart rate (HR); but will this work in practice? Cowley and Guyton9 showed that HR did not infl uence CO at normal levels of VR; only in
cases of increased VR with use of an arteriovenous fi stula, when the heart became the limiting factor, a higher HR increased CO. Thus, in patients with unimpaired cardiac function the only way to increase CO is to increase VR. Subsequently, the heart has two built-in mechanisms that enable the heart to pump out what it receives. One of these mechanisms is increasing contractility, i.e. the Frank-Starling mechanism, and the other mechanism is increasing HR, i.e. the Bainbridge refl ex caused by stretching of the right atrium. Thus, selectively increasing HR or increasing contractility and thereby augmenting stroke volume (SV), will not increase CO, simply because the heart cannot pump out more than it receives from the venous system. When VR is stable, an increase in HR will be compensated for with a decrease in SV. Similarly a decrease in HR rate will result in increased SV.
Late in the 19th century, Bayliss and Starling10 already acknowledged the role of the venous part of the circulation, as a “forgotten or disregarded chapter in the physiology of circulation”. And although Guyton et al.11-13 studied the physiology of venous return
extensively, the statement of Bayliss and Starling still holds today, primarily because of the inability to determine venous return in the clinical situation.
Venous system
pressure that exists in the stressed volume compartment is called mean systemic fi lling pressure (Pmsf), which is the main subject of this thesis.
Bathtub model
Using a bathtub with a drain opening as model for the circulation, Magder1 describes the total of Vu and Vs as the water in the bathtub (fi gure 1.2A). The fl uid below the drain opening is Vu and the fl uid above is Vs. Vs is the effective circulating volume, just like in the bathtub model the water above the drainage point will be drained from the bathtub, while the water below (Vu) will remain in the bathtub. The pressure of the fl uid column above the drainage point is Pmsf. By adding a reservoir with lower pressure (Pra), fl uid fl ows from the bathtub to this reservoir (right atrium). A pump (heart) then pumps the fl uid into the tap (arterial system), which fi lls the bathtub again.
Figure 1.2 Bathtub model of the circulation
The water beneath the drainage pipe, which cannot leave the bathtub, resembles unstressed volume (Vu). The water above the drainage pipe, which can be drained from the bathtub, resembles stressed volume (Vs). The height of the water column above the drainage pipe is the hydrostatic pressure, which is mean systemic fi lling pressure (Pmsf). Water leaves the bathtub via a drainage pipe to a reservoir (right atrium) and will be pumped again into the bathtub by the heart. The pressure in the reservoir is right atrial pressure (Pra).
Drainage from the bathtub (which is venous return) is determined by the pressure difference between Pmsf and Pra as well as by the characteristics op the drainage pipe (resistance to venous return, Rvr). Panel A: The pressure in the bathtub (Pmsf) exceeds the pressure in the reservoir (Pra) and water will
fl ow to the reservoir.
Panel B: The reservoir is placed higher, Pra now equals Pmsf, and fl ow will cease. Note that the function of the pump (heart) is to lower Pra and to return water to the tub. Adopted from Magder.1
In this analogy the height of the water in the bathtub (Pmsf), the height of the reservoir (Pra) and the characteristics of the drain are the primary determinants of the rate of emptying of the bath (i.e. VR). The height of the water above the Pra (the presure
Pra < Pmsf
Pra = Pmsf
A
B
Vu Vs
difference between Pmsf and Pra) is called the pressure gradient for VR. In this model infl ow by the tap (i.e. CO) is important to fi ll the bathtub, but does not infl uence the emptying of the bath. Thus the role of the heart is to lower Pra14, allowing a better
drainage from the bathtub, and to restore volume for VR.Only in heart failure the heart becomes a limiting factor, because Pra increases and volume cannot be restored. Ultimately when Pra is raised to a value equal to Pmsf, fl ow will stop (fi gure 1.2B). On the other hand, when fl ow is ceased by stopping the heart, Pra will increase until it reaches the value of Pmsf. It follows that Pmsf is not directly infl uenced by cardiac function. Pmsf is infl uenced by Vs and by compliance, which is the change in blood volume due to a given change in blood pressure (C = ΔV/ΔP). In a less compliant venous system a small change in volume will induce a greater increase in pressure.
In conclusion, the pressure gradient between Pmsf and Pra is the driving force for VR and consequently CO. Pmsf can be seen as a measure of Vs, because Pmsf is the pressure present in Vs. Vs can be enlarged by volume loading, but also by recruitment of fl uid from the unstressed to the stressed compartment (through venoconstriction).
Venous return curve
VR is the amount of blood returning to the heart. Flow, and also VR, can only exist when there is a pressure gradient. Pra is the back pressure in the pressure gradient for VR. Guyton et al.4,12 showed in his classical experiments in dogs that when Pra is
elevated, CO and VR are reduced. As described above, when Pra is increased further and further, VR declines until it ultimately ceases. This relation between Pra and CO can be depicted in a venous return curve (fi gure 1.3). The value that Pra reaches at zero fl ow is equal to Pmsf. Oppositely, with decreasing Pra, VR increases. When Pra becomes close to atmospheric pressure, transmural pressure of the great veins will become negative, resulting in a collapse of the great veins. This collapse will limit VR to a maximum value.
In the bathtub analogy, the characteristics of the drain are also important for the drainage of the bathtub. A narrow drain will slow down drainage, while a wide drain will increase drainage. In the circulation the impeding factor for drainage is the resistance for venous return (Rvr). Venous return can now be defi ned as the ratio of the pressure gradient for venous return and the resistance to venous return (Rvr):
VR = (Pmsf – Pra)/Rvr
Figure 1.3 Venous return curve
The relationship between right atrial pressure (Pra) and cardiac output (CO), called the venous return (VR) curve, during spontaneous breathing. When VR is zero, Pra is equal to Pmsf. When Pra approaches atmospheric pressure (around 0), VR is maximal. At negative values of Pra, the great veins will collapse, limiting VR. The slope of the curve is determined by the resistance to venous return (Rvr).
Figure 1.4 Changes in venous return curve
Infl uences of resistance to venous return (Rvr) and volume increase on the venous return curve. An increase in Rvr will limit venous return (VR), without changing mean systemic fi lling pressure (Pmsf), fl attening the curve. Volume loading will increase Pmsf, without changing Rvr, leading to an increase in VR.
VR [l/min]
Pra [mmHg]
-10 0 10 20
Pmsf Slope = 1/Rvr
VR [l/min]
Pra [mmHg]
-10 0 10 20
Pmsf Volume increase
Combining cardiac function curve and venous return curve
One of Guyton’s major contributions was that he combined the VR curve and the cardiac function curve. Because during steady state VR and CO must be equal, both curves can be combined4, with Pra on the x-axis and with VR and CO on the y-axis (fi gure 1.5). The intersection of these curves resembles the operating point of the circulation. As we described before, the VR curve can be infl uenced by changing the volemic state (Pmsf) or by changing Rvr. Similarly, the cardiac function curve can be altered by a change in cardiac performance (i.e. myocardial infarction, positive or negative inotropic agents). However, for an increase in CO an increase in VR is essential.
In steady state, the VR curve and the cardiac function curve can be depicted as in fi gure 1.5. For simplicity we used Pra as parameter for the x-axis for the combining of VR and cardiac function curve. For the latter the actual parameter on the x-axis should be right atrial transmural pressure. After all the heart is located in the thoracic cavity, which has a pressure different from atmospheric pressure. It follows that the degree of stress on the cardiac fi bers before contraction is related to transmural pressure (Pra minus pleural pressure). For the VR curve the absolute value of Pra can be used, because the pressure surrounding veins and venules is atmospheric pressure and Pra is calibrated against atmospheric pressure. Still, for the combined graph with cardiac function and VR curve, we will use the absolute value of Pra instead of right atrial transmural pressure, although respiration will infl uence the curves in a different way.
Figure 1.5 Combination of cardiac function curve and venous return curve
The venous return curve and the cardiac output curve are depicted in one graph. The point where venous return (VR) and cardiac output (CO) are equal, is the operating point of the circulation (point a).
VR and CO [l/min]
Pra [mmHg]
-10 0 10 20
a
Respiratory in
fl
uences on cardiac function curve and venous return
curve
Spontaneous breathing. Pleural pressure continuously changes during the respiratory cycle. In a spontaneously breathing patient inspiration causes a negative pleural pressure and a smaller decrease in Pra, increasing transmural pressure. The increase in transmural pressure leads to a rise in CO. During expiration the opposite occurs: pleural pressure increases, Pra increases to a lesser degree and transmural pressure decreases. The decrease in transmural pressure will decrease CO. Accordingly these respiratory induced changes in Pra cause a shift of the cardiac function curve during the respiratory cycle15, while the VR curve remains unchanged (fi gure 1.6).
Figure 1.6 Infl uence of respiration
During spontaneous inspiration intrathoracic pressure and right atrial pressure (Pra) decrease, while venous return (VR) increases. The operating point of the circulation shifts from a to b. Cardiac output (CO) increases, because right atrial transmural pressure increases. To account for this increase in CO, the cardiac function curve shifts to the left as the parameter on the x-axis should actually be right atrial transmural pressure.
Positive end-expiratory pressure. Pleural pressure and Pra will be increased when positive end-expiratory pressure (PEEP) is applied. Transmural pressure decreases because Pra increases less than pleural pressure increases.16,17 As a result the cardiac
function curve will shift to the right as pleural pressure and Pra increase (fi gure 1.7). In left ventricular dysfunction PEEP can have a different effect and even augment CO. In this case the increase in CO is caused by a reduction in left ventricular afterload, because left ventricular transmural pressure is decreased due to the increased intrathoracic pressure.18
expiration
VR and CO [l/min]
Pra [mmHg]
-10 0 10 20
a b
inspiration
PEEP also infl uences the VR curve. Via downward displacement of the diaphragm, increasing intra-abdominal pressure and compression of the liver, and by squeezing of the lungs, stressed volume is increased. This leads to an increase in Pmsf19, and the
VR curve will therefore shift to the right. Will VR change? If both Pra and Pmsf are increased by applying PEEP, the pressure gradient for VR will remain constant.20 At positive intrathoracic pressures, transmural pressure of the great veins will become negative at higher values of Pra. This will result in a collapse of the great veins at higher Pra values and thus the point refl ecting the maximal value of VR (Pcrit) will shift to the right (fi gure 1.7). In conclusion, PEEP interferes with CO and VR in a more complicated manner than just by increasing Pra.
Figure 1.7 Infl uence of positive end-expiratory pressure
The baseline curve is with zero end-expiratory pressure (ZEEP); point a is the operating point of the circulation. When positive end-expiratory pressure (PEEP) is applied, right atrial pressure (Pra) increases and venous return (VR) decreases; the operating point shifts to b. Transmural right atrial pressure decreases, and cardiac output (CO) decreases with a shift of the cardiac function curve to the right. PEEP has three additional effects: 1. recruitment of volume by squeezing liver and lungs, resulting in a rise in mean systemic fi lling pressure (Pmsf; shift of VR curve to the right) and 2. collapse of the great veins at higher values of Pra (thus the point refl ecting the maximal value of VR (Pcrit) will shift to the right). The combined effect is the shift of the operating point of the circulation to c.
Clinical conditions interpreted with cardiac function curve and venous
return curve
Hemorrhagic shock. In a patient with hemorrhage Vs and Pmsf are decreased. The VR curve is shifted to the left, decreasing VR and CO. This can be compensated for by intrinsic catecholamine release via the baroreceptor refl ex causing venoconstriction.
ZEEP
VR and CO [l/min]
Pra [mmHg]
-10 0 10 20
a
b
PEEP c
Venoconstriction will recruit volume from Vu to Vs, successively restoring Vs, Pmsf and VR. When this compensatory mechanism fails and hypovolemic shock occurs, administration of positive inotropic agents clearly will not increase CO. HR increases as a side effect of intrinsic catecholamine release, but will not increase CO either, because VR is insuffi cient. It follows that VR and CO will be restored by volume loading, or (less effectively) by venoconstrictive medication facilitating the volume recruitment from the unstressed compartment.
Distributive shock. Distributive shock, e.g. septic shock, is characterized by arterial and venous vasodilation. Vs and Pmsf, but also Rvr will be decreased; the VR curve is shifted to the left and has become steeper. Volume resuscitation will restore Vs, Pmsf and shift the VR curve to the right. The reduced Rvr will maintain a steeper VR curve, and VR and CO can even exceed the premorbid values, provided there is no cardiac limitation, e.g. due to myocardial depression. Venoconstrictive agents will also shift the VR curve to the right by recruitment of volume from Vu to Vs, thereby increasing Pmsf. Additionally by increasing Rvr, the VR curve will become less steep. Thus therapeutic measures, besides antibiotics and sepsis source control, are volume resuscitation, vasoconstrictive medication or in case of myocardial depression, positive inotropic agents.
Cardiac failure. In heart failure, Pcv increases and CO can only be maintained by increasing Pmsf. Thus compensatory mechanisms are fl uid retention and venoconstriction to increase Pmsf. The drawback of this compensatory mechanism is the development of edema due to the increased hydrostatic pressures, when these exceed osmotic pressures. Volume infusion or administration of venoconstrictive agents will also increase Pmsf, but have the same hazard of causing edema, without improving VR and CO much. Rvr will be increased as well, impeding an increase in VR. What we need is medication that moves the cardiac function curve upward and decreases the Rvr. Dobutamine and phosphodiesterase inhibitors possess those qualities.
Measurement of mean systemic
fi
lling pressure
In order to determine the gradient for VR, we need to know both Pra and Pmsf. Measurement of Pra or central venous pressure (Pcv) is part of clinical routine in the ICU. But how can we determine Pmsf? One possible method could be to reduce VR to zero, then Pcv would become equal to Pmsf. Thus, Pmsf could be measured during cardiac arrest, when CO and VR are equal to zero. Furthermore, Pmsf could theoretically be measured anywhere in the circulation during the circulatory stop-fl ow, because during a cardiac arrest the pressure equilibrates throughout the entire vascular system.
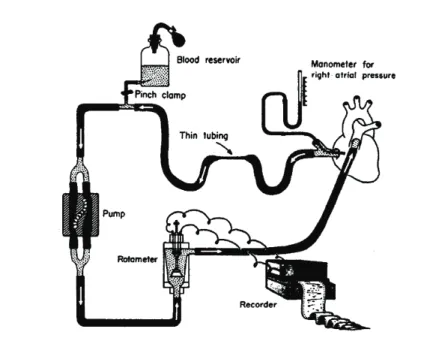
In 1894 Bayliss and Starling10 were the fi rst to conclude that intravascular pressures equilibrated during cardiac arrest induced by vagal stimulation in a dog model (fi gure 1.8). Also in a dog model, Guyton12 increased Pra by varying the height of a tube in the right atrium, which was connected to a pump, thereby replacing the right ventricle (fi gure 1.9). When Pra was increased to a level that CO stopped, Pmsf could be measured. Guyton constructed venous return curves with this method. In humans, Starr21 was the
fi rst to measure Pmsf by inserting a needle into the heart or a great vein in patients who had died shortly before. He observed that patients who died after prolonged cardiac congestion had signifi cantly higher values of Pmsf than the patients who died without congestion or cardiac disease (fi gure 1.10). The higher Pmsf values in heart failure patients can be explained as a compensation mechanism for the increased Pcv in order to maintain a pressure gradient for venous return as described earlier.
Figure 1.8 Pressure course during cardiac arrest
Bayliss and Starling’s10 experiment to measure mean systemic fi lling pressure (Pmsf) in a dog. When
Pmsf in animals using stop-fl ow
In animal studies Pmsf was measured by inducing a circulatory arrest or a stop-fl ow using different measurement techniques. Stopping the heart was achieved by either inducing ventricular fi brillation22-24 or administration of acetylcholine.22,25,26 During the circulatory arrest Pcv increased and arterial pressure decreased. Because the development of equilibrium takes time, and a venoconstrictive refl ex can occur within 5-12 seconds23,27, a pump was used for rapid arterial-to-venous blood transfer. Pmsf was then estimated by measuring Pcv is equal to Pa after approximately 7-10 seconds. Another method to stop circulation is by applying a circulatory obstruction. With an infl atable balloon around the pulmonary artery27,28 or by infl ating a balloon inside the right atrium29 circulatory obstruction was achieved in rats. However, with the circulatory obstruction technique venous pressure (Pv) remained lower than arterial pressure (Pa), when no arteriovenous pump was used. Pmsf was then calculated with the formula: Pmsf = Pv + 1/30•(Pa-Pv).28 The correction factor 1/30 was based on compliance measurements, where venous compliance was 30-fold higher in comparison to arterial compliance.30 Yamamoto et al.29 compared the circulatory obstruction technique with and without rapid arteriovenous blood transfer and found a different correction factor of 1/60.
Figure 1.9 Experimental model for controlling right atrial pressure and venous return
The external perfusion system, bypassing the right ventricle, for controlling right atrial pressure and venous return to construct venous return curves. Figure adopted from Guyton.12
Pmsf in animals using inspiratory holds
VR and CO. In a study in pigs, Versprille31 randomly applied tidal volumes between
25 and 300 ml, i.e. 2.5-30 ml·kg-1, during inspiratory holds of 7.2 seconds. During these inspiratory pauses hemodynamic steady-state conditions were met to assure that VR and CO were equal. Pcv and pulmonary artery fl ow were measured at the end of each inspiratory hold. A venous return curve was then plotted, showing an inverse linear relationship between VR and Pcv. Pmsf was calculated by extrapolation of the curve to a venous return value of zero, where Pcv becomes equal to Pmsf (fi gure 1.11). Pmsf measurement with use of fl ow measurement in the aorta, instead of in the pulmonary artery, lead to comparable values.32 Finally, Pinsky33 showed that Pmsf and
instantaneous venous return curves could be achieved by applying smaller tidal volume ventilation (< 10 ml·kg-1) in canines.
Figure 1.10 Measurement of mean systemic fi lling pressure (Pmsf)
Starr’s measurement of mean systemic fi lling pressure (Pmsf) in humans soon after death. The crossbars indicate average values. Pmsf in patients with organic heart disease and prolonged congestion is higher than in patients without congestion or cardiac abnormalities. Figure adopted from Starr.21
Pmsf in humans during cardiac arrest
In 2000 and 2003 the fi rst measurements of Pmsf in humans during induced cardiac arrest were reported.20,34 By inducing ventricular fi brillation in patients undergoing
surgical implantation of an implantable cardioverter-defi brillator a circulatory arrest was created. In both studies equilibrium of arterial and venous pressure was not met. Jellinek20 considered Pra to be Pmsf after 7.5 seconds of stop-fl ow. After 13 seconds
the average arteriovenous pressure difference was 13.2 ± 6.2 mmHg and even after 20 seconds of cardiac arrest there was no equilibration of pressures.34 The lack of
to be unethical34 and potentially infl uenced by vasomotor refl exes.20 Disadvantages of
this method of assessing Pmsf are: 1. equilibrium between arterial and venous pressure is not reached, thus the value Pmsf can only be estimated and 2. more importantly the method is not applicable during routine patient care. Thus far, only the method with inspiratory holds lends itself for measuring Pmsf in patients at the bedside.
Figure 1.11 Measurement of mean systemic fi lling pressure with inspiratory holds
Relationship between fl ow (Qpa, measured in the pulmonary artery, on the y-axis) and central venous pressure (Pcv) during inspiratory hold procedures at 7 different airway pressures. The arrow indicates the value that Pcv reaches at zero fl ow, which is mean systemic fi lling pressure (Psf). Figure adopted from Versprille.31
In this thesis measurement of Pmsf and Guytonian analysis of venous return curve are taken from the animal laboratory to the intensive care unit.
The measurement of Pmsf with inspiratory holds in pigs and in ICU patients is described in part 1 (Chapter 2, 3 and 4). Chapter 2 contains a historic overview of Pmsf measurement and an overview of other parameters in control of venous return. In Chapter 3 the assessment of venous return curve and Pmsf in postoperative cardiac surgery patients is described. Chapter 4 explores in pigs if pulse contour analysis can be used in measurement of Pmsf and if the number of inspiratory holds can be reduced.
volume and cardiac function curves (Chapter 7) and determination of critical closing pressure with inspiratory holds and its implications regarding the existence of a vascular waterfall (Chapter 8).
In part 3 the effects of vasoactive medication on the hemodynamic status are explored: dobutamine effects on venous return curve and vascular resistances (Chapter 9) and norepinephrine effects on cardiac function and venous return curves (Chapter 10).
In part 4 the clinical relevance of determination of Pmsf and venous return curves, and suggestions for further research are discussed (Chapter 11). Finally a summary is given in Chapter 12.
References
1 Magder S. Point: the classical Guyton view that mean systemic pressure, right atrial pressure, and venous resistance govern venous return is/is not correct. J Appl Physiol 2006; 101:1523-1525.
2 Brengelmann GL. Counterpoint: the classical Guyton view that mean systemic pressure, right atrial pressure, and venous resistance govern venous return is not correct. J Appl Physiol 2006; 101: 1525-1526.
3 Guyton AC, Jones C, Coleman T: Heart muscle, the heart as a pump. In Circulatory Physiology, edn 2. Philadelphia: W.B. Saunders Company; 1973:96-106.
4 Guyton AC, Hall JE: Cardiac output, venous return, and their regulation. In Textbook of medical
physiology, edn 10. Edited by Schmitt W, Gruliow R. Philadelphia: W.B. Saunders Company;
2000:210-222.
5 Jacobsohn E, Chorn R, O’Connor M. The role of the vasculature in regulating venous return and cardiac output: historical and graphical approach. Can J Anaesth 1997; 44:849-867.
6 Anderson RM: The gross physiology of the cardiovascular system. Tucson, Arizona: Racquet Press; 1993.
7 Ruffolo RR, Jr. The pharmacology of dobutamine. Am J Med Sci 1987; 294:244-248.
8 Banfor PN, Preusser LC, Campbell TJ, Marsh KC, Polakowski JS, Reinhart GA, Cox BF, Fryer RM. Comparative effects of levosimendan, OR-1896, OR-1855, dobutamine, and milrinone on vascular resistance, indexes of cardiac function, and O2 consumption in dogs. Am J Physiol Heart Circ Physiol
2008; 294:H238-H248.
9 Cowley AW, Jr., Guyton AC. Heart rate as a determinant of cardiac output in dogs with arteriovenous
fi stula. Am J Cardiol 1971; 28:321-325.
10 Bayliss WM, Starling EH. Observations on Venous Pressures and their Relationship to Capillary Pressures. J Physiol 1894 Apr 17 16:159-318.
11 Guyton AC. Determination of cardiac output by equating venous return curves with cardiac response curves. Physiol Rev 1955; 35:123-129.
12 Guyton AC, Lindsey AW, Abernathy B, Richardson T. Venous return at various right atrial pressures and the normal venous return curve. Am J Physiol 1957; 189:609-615.
13 Guyton AC, Lindsey AW, Abernathy B, Langston JB. Mechanism of the increased venous return and cardiac output caused by epinephrine. Am J Physiol 1958; 192:126-130.
14 Levy MN. The cardiac and vascular factors that determine systemic blood fl ow. Circ Res 1979; 44:739-747.
15 Magder S. Central venous pressure monitoring. Curr Opin Crit Care 2006; 12(3):219-227.
16 Scharf SM, Caldini P, Ingram RH, Jr. Cardiovascular effects of increasing airway pressure in the dog.
Am J Physiol 1977; 232:H35-H43.
18 Grace MP, Greenbaum DM. Cardiac performance in response to PEEP in patients with cardiac dysfunction. Crit Care Med 1982; 10:358-360.
19 van den Berg PC, Jansen JR, Pinsky MR. Effect of positive pressure on venous return in volume-loaded cardiac surgical patients. J Appl Physiol 2002; 92:1223-1231.
20 Jellinek H, Krenn H, Oczenski W, Veit F, Schwarz S, Fitzgerald RD. Infl uence of positive airway pressure on the pressure gradient for venous return in humans. J Appl Physiol 2000; 88:926-932.
21 Starr I. Role of the static blood pressure in abnormal increments of venous presure, especially in heart failure.II. Clinical and experimental studies. Am J Med Sci 1940; 199:40-55.
22 Gaddis ML, Rothe CF, Tunin RS, Moran M, MacAnespie CL. Mean circulatory fi lling pressure: potential problems with measurement. Am J Physiol 1986; 251:H857-H862.
23 Drees JA, Rothe CF. Refl ex venoconstriction and capacity vessel pressure-volume relationships in dogs. Circ Res 1974; 34:360-373.
24 Fessler HE, Brower RG, Wise RA, Permutt S. Effects of positive end-expiratory pressure on the gradient for venous return. Am Rev Respir Dis 1991; 143:19-24.
25 Nekooeian AA, Ogilvie RI, Zborowska-Sluis D. Acute hemodynamic effects of drugs acting on the renin-angiotensin system in acute heart failure. Can J Cardiol 1995; 11:59-64.
26 Lee RW, Lancaster LD, Gay RG, Paquin M, Goldman S. Use of acetylcholine to measure total vascular pressure-volume relationship in dogs. Am J Physiol 1988; 254:H115-H119.
27 Samar RE, Coleman TG. Mean circulatory pressure and vascular compliances in the spontaneously hypertensive rat. Am J Physiol 1979; 237:H584-H589.
28 Samar RE, Coleman TG. Measurement of mean circulatory fi lling pressure and vascular capacitance in the rat. Am J Physiol 1978; 234:H94-100.
29 Yamamoto J, Trippodo NC, Ishise S, Frohlich ED. Total vascular pressure-volume relationship in the conscious rat. Am J Physiol 1980; 238:H823-H828.
30 Shoukas AA, Sagawa K. Control of total systemic vascular capacity by the carotid sinus baroreceptor refl ex. Circ Res 1973; 33:22-33.
31 Versprille A, Jansen JR. Mean systemic fi lling pressure as a characteristic pressure for venous return.
Pfl ugers Arch 1985; 405:226-233.
32 Den Hartog EA, Versprille A, Jansen JR. Systemic fi lling pressure in intact circulation determined on basis of aortic vs. central venous pressure relationships. Am J Physiol 1994; 267:H2255-H2258.
33 Pinsky MR. Instantaneous venous return curves in an intact canine preparation. J Appl Physiol 1984; 56:765-771.
Chapter 2
Bedside assessment of mean systemic fi
lling pressure
Jos R.C. Jansen1, Jacinta J. Maas1 and Michael R. Pinsky2
1Department of Intensive Care Medicine, Leiden University Medical Center, The Netherlands, 2Department of Critical Care Medicine, University of Pittsburgh, PA, USA
Abstract
The physiology of the venous part of the human circulation seems to be a forgotten component of the circulation in critical care medicine. One of the main reasons, probably, is that measures of right atrial pressure (Pra) do not seem to be directly linked to blood
Introduction
Starling and Bayliss1 late in the 19th century described the control and function of the venous circulation. This work and the subsequent rediscovery of the venous circulation by Guyton et al. represent the forgotten side of the physiology of the circulation. The lack of appreciation of the venous side of the circulation persists today. To a large extent this void in our training of critical care physicians and lack of use of these principles at the bedside refl ect the inability of the practicing physician to appropriately assess the venous side of the circulation. Clearly, measures of central venous pressure (Pcv) as estimates of right atrial pressure (Pra) bear little relation to cardiac preload. Furthermore, most physicians adhere to the philosophy that the energy necessary to cause cardiac output is due to the mechanical force of ventricular contraction. Accordingly, most analysis of the determinants of cardiac output centralizes in the infl uence of preload, contractility, afterload, and heart rate on the heart. However, it is axiomatic that the heart can only pump into the arteries that which it receives. The heart has minimal reservoir capacity and even in heart failure states venous return matches the cardiac output very closely over a few heart beats. It follows, therefore, that the only way cardiac output can increase is if venous return increases. Thus, apart for relative short periods of changing blood fl ow, the heart can only put out as much blood as it receives from the venous system. The venous system contains as much as 75% of the total blood volume with approximately 3 fourths of it in the small veins and venules. It is the pressure difference between these venous capacitance vessels and the right atrium that defi nes the pressure gradient for venous return. However, this venous driving pressure refl ects only stressed volume and not the total venous blood volume. Importantly, changes in venous vasomotor tone and blood fl ow distribution can markedly alter this upstream venous pressure without any change in total blood volume. For more details, the reader is invited to read several excellent review articles.2-5
Short history and basic concepts
When Starling and Bayliss1 performed a sympathectomy and induced a cardiac arrest by vagal stimulation in a dog model with cannulae in the femoral vein, femoral artery, portal vein, inferior caval vein and aorta, they observed that all vascular pressures rapidly equilibrated. They called this common stop-fl ow pressure “mean systemic pressure” (Pms).
compensatory mechanisms such as fl uid retention and vasoconstriction.
Guyton et al.7,8 showed that the relationship between stepwise changes in right atrial
pressure (Pra) and the resulting changes in venous return describes a venous return curve, which itself is a function of the circulating blood volume, vasomotor tone and blood fl ow distribution. Importantly, right atrial pressure at the extrapolated zero fl ow pressure-intercept refl ects mean systemic fi lling pressure (Pmsf) and the slope of this relation describes the resistance for venous return (Rvr), that is venous return = (Pmsf – Pra)/Rvr.7,8 We use the term Pmsf to connote the pressure in the systemic vascular
compartment. In practice the mean pressure of the entire circulation is slightly higher than Pmsf because of the addition of pulmonary venous blood to the systemic circulation due to the higher left atrial than right atrial pressure normally seen. The relationship between Pra and venous return was described in animal models with an artifi cial circulation8,9 and in animals with an intact circulation using invasive hemodynamic
monitoring.10-13 However, until recently, it had never been properly evaluated in
humans with an intact circulation.
Bedside determination of Pmsf
Venous return as a controller of cardiac output is a very useful concept in explaining the pathophysiology of shock3,11, congestive heart failure14, circulatory effect of mechanical
ventilation15 and the physiological effects of vasoactive drugs.16-19 However, it has not
been used in common medical practice. One of the main reasons, probably, is that its main variable Pmsf does not lend itself to be easily measured in patients. Indeed, until recently Pmsf could only be estimated during stop-fl ow conditions20,21, conditions that
occur rarely in clinical critical care settings.
We22 recently reported on a novel method to determine Pmsf, Rvr, stressed volume (Vs)
and systemic circulatory compliance (Cs) using clinical available minimally invasive monitoring at the patient’s bedside. To our knowledge, no other clinical studies have been undertaken to measure Pmsf in patients at the bedside. We reasoned that since Pra is the back pressure to venous return, then just like Guyton et al.7,8 demonstrated in
beats, reaching a steady state between 7 and 12 seconds after start of infl ation. From the steady-state values of Pcv and COmf obtained during a series of four inspiratory pause periods a venous return curve can be constructed by fi tting a linear regression line through these data points (fi gure 2.2). Extrapolation to the point of zero fl ow gives a direct estimate of Pmsf. To validate that this derived Pmsf behaved in a fashion predicted by classic Guytonian physiology, we studied the effect of volume loading on both Pmsf and the slope of the venous return curve. We would have predicted that if volume loading increased stressed volume, Pmsf would increase as a function of the venous vascular compliance and that cardiac output would increase only if the pressure gradient for venous return (Pcv – Pmsf) increased without an increase in the resistance to venous return. Indeed, in response to fl uid loading we observed an increase in Pmsf and no change in the slope of the venous return curve, similar to the results shown by Guyton et al.8 From the change in Pmsf (point a to point b) in response to the 500
ml fl uid loading, we calculated circulatory compliance and stressed volume (fi gure 2.3). Stressed volume is the volume that extends the blood vessels (see below). Thus measuring Pmsf and its change with volume loading or removal allows more insight in parameters and mechanisms that control the peripheral circulation in critically ill patients.
Figure 2.1 Example of an inspiratory hold maneuver
Parameters for venous return
Parameters that determine venous return and thus cardiac output are: mean systemic
fi lling pressure, right atrial pressure, resistance to venous return, systemic compliance, stressed and unstressed volume. These parameters are indicated in the fi gures 2.2 and 2.3. Different aspects of their control will be reviewed below.
Mean systemic fi lling pressure
Pmsf is a measure of effective volume status, otherwise known as the effective circulating blood volume, and (theoretically) independent on cardiac function. Importantly, volume status and fl uid responsiveness (i.e. a signifi cant increase in cardiac output on fl uid loading) are not synonymous. Even hypovolemic patients can be non-responders to fl uid loading. Fluid responsiveness depends on the intersection of the venous return curve and the cardiac function curve. Fluid expansion will lead to a greater improvement in cardiac output in a patient with a normal cardiac function than in a patient with impaired cardiac function.3,23
Figure 2.2 Venous return curves
Relationship between venous return (COmf) and central venous pressure (Pcv) for an individual patient. Venous return curves are plotted for normovolemia (a) and after volume loading with 500 ml, that is hypervolemia (b). Venous return is the blood fl ow that returns to the heart, Pmsf is mean systemic fi lling pressure, Pcv is central venous pressure and Rv the resistance for blood fl ow from Pmsf to Pcv measured near the entrance of the right atrium. The inverse of the slope of the lines is Rv. V is the total blood volume and V0 is unstressed volume, the difference is stressed volume (Vs). Cs is systemic compliance (see also fi gure.2.3). The points a and b indicate Pmsf for normovolemia and hypervolemia respectively.
Our22 reported Pmsf values in postoperative cardiac surgery patients were higher than those postulated to be present under normal resting conditions. This might be explained by the fact that we were studying a selected group of patients following cardiac surgery and in whom aggressive volume resuscitation and vasoactive drug therapy are routinely used. Indeed, all of our patients in this study were receiving vasoactive drug therapy.
0 2 4 6
0 5 10 15 20 25 30 35
Pcv (mmHg) CO mf (l. m in -1 )
VR = CO = (Pmsf-Pcv)/Rv
Slope = 1/Rv
Pcv = Pmsf = (V-Vo)/Cs
a b
0 2 4 6
0 5 10 15 20 25 30 35
Pcv (mmHg) CO mf (l. m in -1 )
VR = CO = (Pmsf-Pcv)/Rv
Slope = 1/Rv
Pcv = Pmsf = (V-Vo)/Cs
Furthermore, in a previous hemodynamic study on similar postoperative patients by our group, we have documented that these patients are hypervolemic.24 Presumably,
Pmsf would be lower in subjects not experiencing these marked circulatory stressors. However, in our intensive care unit, we were limited to study Pmsf in patients following cardiac surgery in whom inspiratory hold maneuvers could be readily performed.
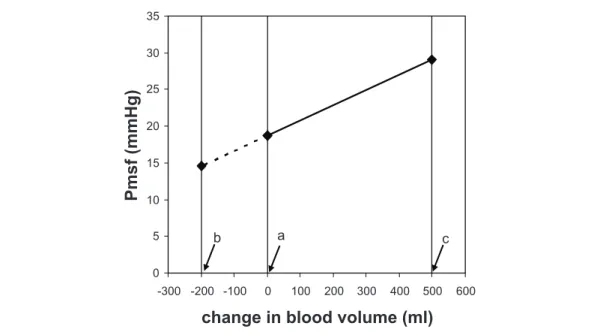
Figure 2.3 Determination of systemic compliance and stressed volume
Relationship between change in blood volume and mean systemic fi lling pressure (Pmsf) for
normovolemia (a) and after volume loading with 500 ml, that is hypervolemia (b). In the fi gure systemic compliance (Cs), stressed (Vs) and unstressed volume (V0) are indicated. The value of Cs can be found by dividing the administered volume of 500 ml by the change in Pmsf (from a to b) of
fi gure 2.2. Removal of 1270 ml blood in this patient will lead to a Pmsf of 0 mmHg, what rests in the circulation is unstressed volume with no blood fl ow.
Venous resistance
The slope of the venous return curve is proportional to the reciprocal of the resistance to venous return. Thus, changes in the resistance of venous return (Rvr) must alter the slope of the venous return curve. An increase in slope means a decrease in Rvr such that for the same Pra and Pmsf cardiac output will be greater and a decrease in slope means an increased Rvr. Venous resistance can be altered in many ways. An increase of Rvr can occur due to constriction of the conducting veins, however, unlike the arterial side which has thick muscular vessel walls venoconstriction causes only a minimal increase in Rvr. Rvr can also be increased by increased blood viscosity. However, the major mechanism by which Rvr is altered is by redistribution of blood between different vascular beds.
0 5 10 15 20 25 30 35
-1500 -1250 -1000 -750 -500 -250 0 250 500
change in blood volume (ml)
P m sf ( mmH g )
Cs= ¨V/¨Pmsf
Vs
a
b
V0 V
0 5 10 15 20 25 30 35
-1500 -1250 -1000 -750 -500 -250 0 250 500
change in blood volume (ml)
P m sf ( mmH g )
Cs= ¨V/¨Pmsf
Vs
a
b
Venoconstriction of an organ decreases its unstressed blood volume, causing its local upstream pressure to transiently rise, expelling blood into the systemic circulation because some of the unstressed volume is shifted to stressed volume (see below). Most of the venoconstriction with change in unstressed volume occurs in the splanchnic circulation, which has a more prominent innervation.2,3 However, as splanchnic blood
fl ow must subsequently pass across a second parenchymal bed, the liver, splanchnic Rvr is much higher than for other organs including the brain, kidney, muscle and skin any change in splanchnic Rvr has minimal effect on total Rvr.3,25 Accordingly,
venoconstriction of the splanchnic circulation has a minimal incremental effect on Rvr but a signifi cant ability to increase Pmsf. The balance between venoconstriction of venous vessels outside and inside the splanchnic area is controlled by α- and β2-adrenenergic activation of the different parts of the systemic circulation and is the primary means of controlling cardiac output and matching metabolic needs to blood
fl ow distribution. Those interested in reading more about this important aspect of the control of the circulation are referred to the papers by Gelman2, Rothe5 and Pang.17
Compliance, stressed and unstressed volume
As described above, the intravascular volume can be divided in unstressed volume and stressed volume. The intravascular volume that fi lls these vessels up to the point where intravascular pressure starts to rise is called unstressed volume, whereas the volume that stretches the blood vessels and causes intravascular pressure to rise is called the stressed volume. By defi nition, the stressed volume results in a positive transmural vascular pressure, which is defi ned as the pressure inside the vessel relative to the pressure outside the vessel wall. Since the pressure gradient for venous return is from the extrathoracic venous vessels to the right atrium, the back pressure to venous return is Pra and not its transmural pressure. This is a very important concept and explains the dynamic changes in venous return that occur during breathing and whenever intrathoracic pressure is artifi cially varied. In the setting of circulatory shock due to inadequate venous return, as may occur with hypovolemia, sepsis and heart failure, the two main therapeutic interventions that can increase stressed blood volume and thus Pmsf so as to restore venous return to an adequate level of blood fl ow are the administration of intravenous fl uids and pharmacological manipulation with vasopressor agents to increase vascular tone.
patients were in hypothermic cardiac arrest, the pump was turned off and blood was drained passively in a reservoir. The amount of blood drained was the stressed volume. In these hypothermic anesthetized patients Magder and De Varennes26 found stressed
volume was on average 20.2 ml/kg, which value is close to our calculated result of 19.5 ml/kg in intact patients.22
Administration of vasopressors and inotropes can be used to enlarge or reduce stressed volume. Vasopressors increase stressed volume by recruiting volume from the unstressed compartment. For instance, infusion of norepinephrine (an α- and β1-adrenergic agonist) into anesthesized dogs increased arterial pressure, cardiac output, total peripheral resistance, hepatic vein resistance and Pmsf and reduced heart rate and liver volume.27 Note that the increase in venous resistance and total peripheral
resistance on itself would diminish cardiac output. Evidently the increase in cardiac output by the increase in Pmsf dominated the negative impact on cardiac output by the increase of arterial and venous resistance. These results were later confi rmed in rabbits by the same authors.19 Although it is clear that norepinephrine is capable of increasing
Pmsf, there are differences in Pmsf response among different species of animals.17
The effects of catecholamines on increasing venous return and cardiac output may be signifi cant. However, knowledge of the volume status is of great importance before administrating these drugs into a critically ill patient whose endogenous adrenergic stimulation is already maximal. Norepinephrine may reduce splanchnic blood pooling, increase Pmsf, Rvr and Rsys of the splanchnic circulation, but the resulting decrease in fl ow of the splanchnic circulation may increase ischemia in the gut and liver.4,28
However, inotropic agents, like dobutamine, can cause vasodilation, owing to their peripheral -adrenergic effect. Thus, the use of dobutamine as single-agent therapy for a hypotensive heart failure patient in whom fl uid resuscitation has not been completed usually causes worsening hypotension, owing to the decrease in stressed volume despite an associated increased cardiac contractility. If measured, one would see dobutamine increasing vascular compliance.
The technique of estimating vascular compliance presented in our study22 might enable
one to perform studies on the effects of vasoactive drug infusion (e.g. norepinephrine infusion) on Pmsf, Vs, Rvr and Cs in humans with an intact circulation. In this way we may validate the theories on the control of venous return obtained from animal studies. More extended description of different vasoactive drugs on venous return can be found in the review of Pang.17
Localization of Pmsf
conceptual model at best, since it refl ects a lumped parameter of all the vascular beds. However, its position in the pooled vascular beds will shift depending on changes in arterial and venous resistances.11,13 The ratio of the resistance of venous return and
systemic vascular resistance describes the location within the circulation where Pmsf exists. A higher ratio implies a more upstream Pmsf location. Still, Pmsf usually resides in the small venous lacunae downstream from the capillary beds. It will be interesting to see how this location of Pmsf within the circulation may change with the use of vasoactive drug therapy and in patients with either sepsis or heart failure. Finally, if one were to perfuse individual organs in isolation, their respective Pmsf values would also be different because of their differing degrees of stressed and unstressed volumes as well as their extravascular tissue pressures. However, during steady-state conditions,
fl ow through all organs is stable and not changing. As all organs drain into a common vena caval drainage circuit, to the extent that venous resistance upstream from those sites is not high, then the Pmsf of all vascular beds should be nearly the same. Otherwise,
fl ow would vary among organs until the Pmsf became common. Thus, theoretically, one should be able to measure Pmsf from an arm vessel during stop-fl ow conditions as long as tissue pressure and venous blood volume are not transiently altered by the measuring technique. This intriguing construct opens the possibility to simplify the direct measurement of Pmsf without the need of continuous measures of cardiac output and Pcv. Studies exploring this concept are on-going.
Conclusion
References
1 Bayliss M, Starling EH: Observations on Venous Pressures and their Relationship to Capillary Pressures.
J Physiol 1894 Apr 17 16:159-318.
2 Gelman S: Venous function and central venous pressure: a physiologic story. Anesthesiology 2008; 108:735-748.
3 Jacobsohn E, Chorn R, O’Connor M: The role of the vasculature in regulating venous return and cardiac output: historical and graphical approach. Can J Anaesth 1997; 44:849-867.
4 Peters J, Mack GW, Lister G: The importance of the peripheral circulation in critical illnesses. Intensive
Care Med 2001; 27:1446-1458.
5 Rothe CF: Mean circulatory fi lling pressure: its meaning and measurement. J Appl Physiol 1993; 74:499-509.
6 Starr I: Role of the static blood pressure in abnormal increments of venous presure, especially in heart failure.II. Clinical and experimental studies. Am J Med Sci 1940; 199:40-55.
7 Guyton AC, Jones C, Coleman T: Cardiac output and its regulation. In Circulatory Physiology, edn 2. Philadelphia: W.B. Saunders Company; 1973.
8 Guyton AC, Lindsey AW, Abernathy B, Richardson T: Venous return at various right atrial pressures and the normal venous return curve. Am J Physiol 1957; 189:609-615.
9 Green JF: Pressure-fl ow and volume-fl ow relationships of the systemic circulation of the dog. Am J
Physiol 1975; 229:761-769.
10 Den Hartog EA, Versprille A, Jansen JR: Systemic fi lling pressure in intact circulation determined on basis of aortic vs. central venous pressure relationships. Am J Physiol 1994; 267:H2255-H2258.
11 Hiesmayr M, Jansen JR, Versprille A: Effects of endotoxin infusion on mean systemic fi lling pressure and fl ow resistance to venous return. Pfl ugers Arch 1996; 431:741-747.
12 Pinsky MR: Instantaneous venous return curves in an intact canine preparation. J Appl Physiol 1984; 56:765-771.
13 Versprille A, Jansen JR: Mean systemic fi lling pressure as a characteristic pressure for venous return.
Pfl ugers Arch 1985; 405:226-233.
14 Burkhoff D, Tyberg JV: Why does pulmonary venous pressure rise after onset of LV dysfunction: a theoretical analysis. Am J Physiol 1993; 265:H1819-H1828.
15 Nanas S, Magder S: Adaptations of the peripheral circulation to PEEP. Am Rev Respir Dis 1992; 146:688-693.
16 Caldini P, Permutt S, Waddell JA, Riley RL: Effect of epinephrine on pressure, fl ow, and volume relationships in the systemic circulation of dogs. Circ Res 1974; 34:606-623.
17 Pang CC: Autonomic control of the venous system in health and disease: effects of drugs. Pharmacol Ther 2001; 90:179-230.
the absence and presence of acute heart failure. Circulation 1980; 61:328-337.
19 Rothe CF, Maass-Moreno R: Active and passive liver microvascular responses from angiotensin, endothelin, norepinephrine, and vasopressin. Am J Physiol Heart Circ Physiol 2000; 279:H1147-H1156.
20 Jellinek H, Krenn H, Oczenski W, Veit F, Schwarz S, Fitzgerald RD: Infl uence of positive airway pressure on the pressure gradient for venous return in humans. J Appl Physiol 2000; 88:926-932.
21 Schipke JD, Heusch G, Sanii AP, Gams E, Winter J: Static fi lling pressure in patients during induced ventricular fi brillation. Am J Physiol Heart Circ Physiol 2003; 285:H2510-H2515.
22 Maas JJ, Geerts BF, van den Berg PC, Pinsky MR, Jansen JR: Assessment of venous return curve and mean systemic fi lling pressure in postoperative cardiac surgery patients. Crit Care Med 2009; 37:912-918.
23 Guyton AC: Determination of cardiac output by equating venous return curves with cardiac response curves. Physiol Rev 1955; 35:123-129.
24 van den Berg PC, Jansen JR, Pinsky MR: Effect of positive pressure on venous return in volume-loaded cardiac surgical patients. J Appl Physiol 2002; 92:1223-1231.
25 Deschamps A, Fournier A, Magder S: Infl uence of neuropeptide Y on regional vascular capacitance in dogs. Am J Physiol 1994; 266:H165-H170.
26 Magder S, De Varennes B: Clinical death and the measurement of stressed vascular volume. Crit Care Med 1998; 26:1061-1064.
27 Rothe CF, Flanagan AD, Maass-Moreno R: Role of beta-adrenergic agonists in the control of vascular capacitance. Can J Physiol Pharmacol 1990; 68:575-585.
Chapter 3
Assessment of venous return curve and mean systemic
fi
lling pressure in postoperative cardiac surgery patients
Jacinta J. Maas1, Bart F. Geerts2, Paul C.M. van den Berg1, Michael R. Pinsky3 and Jos R.C. Jansen1
1Department of Intensive Care Medicine, Leiden University Medical Center, The Netherlands, 2Department of Anesthesiology, Leiden University Medical Center, The Netherlands,
3Department of Critical Care Medicine, University of Pittsburgh, PA, USA
Abstract
Introduction
The cardiovascular system is a closed circuit with varying blood fl ow out of the heart into the arterial system (cardiac output [CO]) and fl ow back to the heart from the venous system (venous return [VR]), which may not be equal at any point in time owing to ventilation-induced changes in venous return, but which over time must be equal.1,2 Thus, under steady-state apneic conditions CO and VR become equal. Guyton et al.3,4 showed that the relationship between stepwise changes in right atrial pressure (Pra) and the resulting changes in VR describes a VR curve, which itself is a function of the circulating blood volume, vasomotor tone and blood fl ow distribution. Importantly, Pra at the extrapolated zero-fl ow pressure intercept refl ects mean systemic fi lling pressure (Pmsf) and the slope of this relation describes the resistance for venous return (Rvr).3,5 This relationship between Pra and VR was well described in animal models with an artifi cial circulation4, in patients during stop-fl ow conditions6, and in animals with an intact circulation using invasive hemodynamic monitoring.7-10 However, it has never been evaluated in humans with an intact circulation. If such VR curves could be easily calculated at the bedside, then complex cardiovascular analysis would be feasible, thereby, augmenting greatly our understanding of the dynamic determinants of circulatory insuffi ciency states and their responses to therapies. Intravascular blood volume can be divided in unstressed volume (the blood volume necessary to fi ll the blood vessels without generating an intravascular pressure) and stressed volume (the blood volume which generates the intravascular pressure, which is Pmsf in no-fl ow conditions).
Previously, Pinsky7 constructed instantaneous VR curves based on the beat-to-beat changes in Pra and simultaneously measured right ventricular output during a single mechanical breath, neglecting possible transient effects of increasing Pra on VR.1,2 Versprille and Jansen8 prevented these transient changes by measuring Pra and right ventricular output during steady-state conditions generated by ventilator-applied inspiratory pause periods at different infl ation volumes. Unfortunately, it is diffi cult to measure pulmonary blood fl ow on a beat-to-beat basis at the bedside. We hypothesized that if inspiratory hold maneuvers that increase Pra create a new steady state, then VR and CO would again be equal and direct measures of left-sided CO could be used to estimate steady-state VR.
Thus, we studied the effect of 12-second inspiratory hold maneuvers on the relation between central venous pressure (Pcv), as a surrogate for Pra, and arterial pulse contour-derived cardiac output (COmf), as a surrogate for VR, as Pcv was varied by inspiratory hold maneuvers and intravascular volume status altered by a head-up tilt body position (relative hypovolemia) and intravascular volume loading (hypervolemia).
Materials and methods
or aortic valve replacement were included in the study after approval by the university medical ethics committee and patient’s informed consent was obtained. All patients had symptomatic coronary artery disease without previous myocardial infarction and were on beta-adrenergic blocking medication. Patients with congestive heart failure (New York Heart Association class 4), aortic aneurysm, extensive peripheral arterial occlusive disease, or postoperative valvular insuffi ciency, were not considered for this study. Patients with postoperative arrhythmia or the necessity for artifi cial pacing, or use of a cardiac assist device were also excluded.
Anesthesia during surgery was maintained with sufentanil and propofol and patients were ventilated in synchronized intermittent mandatory ventilation mode (Evita 4 servo ventilator Dräger, Lübeck, Germany) adjusted to achieve normocapnia (arterial pCO2 between 40 and 45 mmHg) with tidal volumes of 6-8 ml·kg-1 and a respiratory rate of 12-14 breaths·min-1. Fraction of inspired oxygen (FiO
2) was 0.4 and a positive end-expiratory pressure of 5 cmH2O was applied. A hemodynamic stability was achieved using fl uids and catecholamines. During the study interval all subjects were hemodynamically stable and no changes were made in their vasoactive drug therapy. Every patient experienced full recovery from anesthesia within 8 hours following surgery and was discharged from intensive care unit on the fi rst postoperative day.
Measurements. Arterial blood pressure (Pa) was monitored via a 20-G, 3.8-cm long radial arterial catheter inserted by Seldinger technique and connected to a pressure transducer (PX600F, Edwards Lifesciences). Pcv was measured with a central venous catheter inserted through the right internal jugular vein (MultiCath 3 venous catheter, Vigon GmbH & Co, Aachen, Germany) and connected to a pressure transducer (PX600F, Edwards Lifesciences). Both Pa and Pcv transducers were referenced to the intersection of the anterior axillary line and the fi fth intercostal space. Airway pressure (Pvent) was measured at the entrance of the endotracheal tube. Pvent was balanced at zero level against ambient air. Standard electrocardiogram leads were used to monitor heart rate. Beat-to-beat CO was obtained by Modelfl ow (COmf) pulse contour analysis as previously described by us.11-13 We calibrated the pulse contour CO measurements
with 3 thermodilution CO measurements equally spread over the ventilatory cycle.12
We constructed VR curves by measuring steady-state Pa, Pcv and COmf over the fi nal 3 seconds for a set of four 12-second inspiratory hold maneuvers at Pvent plateau pressures of 5, 15, 25, 35 cm H2O. The inspiratory hold maneuvers were separated by 1-minute intervals to reestablish the initial hemodynamic steady state. An example of the hemodynamic changes during an inspiratory hold is presented in fi gure 3.1. When Pvent increases, Pcv increases concomitantly, whereas COmf and Pa decrease with a delay of three-four beats, reaching a steady state between 7 and 12 seconds after start of infl ation. From the steady-state values of Pcv and COmf during the four inspiratory pause periods, a VR curve was constructed by fi tting a linear regression line through these data points (fi gure 3.2).
The four inspiratory hold maneuvers were performed under three sequential volumetric conditions: initial baseline conditions (baseline) with the subject lying supine, relative hypovolemia by rotating the bed to a 30 degree head-up (anti-Trendelenburg) position (hypo) and after administration of 500 ml hydroxyethyl starch (130/0.4) in supine position (hyper). Measurements were done 2 minutes after head-up tilt and 2-5 minutes after the fl uid bolus, which was given in 15-20 minutes.
Figure 3.1 Example of an inspiratory hold maneuver
Data analysis and statistics. We fi tted the set of four data points of Pcv and COmf by linear regression for each volume state to defi ne the VR curve. We defi ned Pmsf as the extrapolation of this linear regression to zero fl ow (fi gure 3.2), assuming that Pvent does not affect Pmsf. We have previously validated this extrapolation in piglets.8-10
Total systemic vascular resistance (Rsys) was calculated as the ratio of the pressure difference between mean Pa and mean Pcv and COmf (Rsys = (Pa - Pcv)/COmf). The resistance downstream of Pmsf was taken to refl ect the Rvr and was calculated as the ratio of the pressure difference between Pcv and Pmsf and COmf (Rvr = (Pmsf-Pcv)/COmf). Systemic arterial resistance (Ra) was taken to be the difference between systemic and venous resistance. The ratio of Rvr and Rsys describes the location within the circulation where Pmsf exists. A higher ratio implies a more upstream Pmsf location. Systemic compliance (Csys) was calculated by dividing the amount of fl uid (Vload) administrated to induce the hyper state by the Pmsf difference between baseline and hyper (Csys = Vload /(PmsfHyper –PmsfBaseline). We assume Csys to be constant for the three volemic conditions studied. Stressed vascular volume (Vs) was calculated as the product of Csys and Pmsf. We calculated Vs for all three relative volume conditions. Data are presented as mean ± SD. Linear regressions were fi tted using a least-squares method. The changes between the three conditions were tested by a paired Student’s t test, with differences corresponding to a p < 0.05 considered signifi cant. We compared baseline to both hypo and hyper.
Figure 3.2 Venous return curves
Relationship between venous return (COmf) and central venous pressure (Pcv) for an individual patient. Venous return curves are plotted for three conditions, baseline (a), hypovolemia (b) and hypervolemia (c).
Results
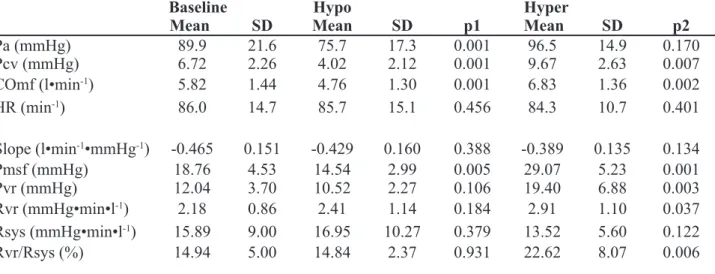
Sixteen patients were recruited into the study, but four were excluded from analysis because they could not receive an additional volume challenge. Table 3.1 shows the patient characteristics and table 3.2 shows the pooled data of the 12 subjects who completed all three steps of the protocol.
c a b
Supine
Head up position Supine + volume
0 2 4 6
0 5 10 15 20 25 30 35
Pcv (mmHg)
COmf
(L/min)
b aa b cc
Supine
Head up position Supine + volume
0 2 4 6
0 5 10 15 20 25 30 35
Pcv (mmHg)
COmf
(l/min)
Table 3.1 Patient Characteristics
No Gender Age Weight Length HR Pcv CO mean Pa Temp Surgery Inotropics Propofol Sufenta
(years) (kg) (cm) (min-1) (mmHg)(l•min-1) (mmHg) (˚C) (μg•kg-1
•min-1) (mg•h-1) (μg•h-1)
1 M 60 80 172 85 8.2 4.6 72 36.8 CABG 300 15
2 M 57 78 169 119 9.9 5.7 73 36.9 CABG D 2 300 15
3 M 79 78 174 86 7.5 6.3 88 36.9 AVR D 5 200 10
4 M 50 90 190 93 7.4 3.2 138 36.3 AVR NPN 0.25 300 15
5 M 80 90 172 99 8.0 6.1 80 36.7 CABG N 0.01 200 10
6 F 64 83 167 76 7.1 5.8 88 37.4 CABG N 0.04, D 3 200 10
7 M 50 112 183 83 4.0 5.7 85 37.0 CABG N 0.06 500 15
8 M 57 91 177 63 4.9 6.4 78 35.1 CABG 300 10
9 M 71 73 179 93 8.0 8.8 91 37.1 CABG N 0.09, D 4 120 5
10 M 66 88 178 69 3.0 7.4 71 35.8 CABG N 0.02 200 10
11 M 75 95 173 77 9.0 4.4 130 36.5 CABG 300 10
12 F 60 74 158 89 3.7 5.3 86 36.6 CABG N 0.04, E 2 150 5
mean 64 86 174 86 6.7 5.8 90 36.6 256 11
SD 10 11 8 15 2.3 1.4 22 0.6 101 4
HR, heart rate; Pcv, central venous pressure; CO, cardiac output; mean Pa, mean arterial pressure; Temp, body temperature; CABG, coronary artery bypass grafting; AVR, aortic valve replacement; D, dobutamine; NPN, nitroprusside sodium; N, norepinephrine; E, enoximone.
Venous return curve analysis. Pcv and COmf decreased during hypo and increased during hyper. Similarly, Pmsf decreased during hypo and increased during hyper, whereas the slope of the VR (conductance) was not signifi cantly different for the three conditions of baseline, hypo and hyper. The pressure gradient for VR did not change with hypo but increased with hyper such that Rvr was unchanged by hypo but increased with hyper. Importantly, Rsys, did not change. Thus, the estimated location of Pmsf was unchanged by hypo but migrated upstream with hyper.
Table 3.2 Hemodynamic data of patients during baseline, hypo- and hypervolemic condition
Baseline Hypo Hyper
Mean SD Mean SD p1 Mean SD p2
Pa (mmHg) 89.9 21.6 75.7 17.3 0.001 96.5 14.9 0.170
Pcv (mmHg) 6.72 2.26 4.02 2.12 0.001 9.67 2.63 0.007
COmf (l•min-1) 5.82 1.44 4.76 1.30 0.001 6.83 1.36 0.002
HR (min-1) 86.0 14.7 85.7 15.1 0.456 84.3 10.7 0.401
Slope (l•min-1•mmHg-1) -0.465 0.151 -0.429 0.160 0.388 -0.389 0.135 0.134
Pmsf (mmHg) 18.76 4.53 14.54 2.99 0.005 29.07 5.23 0.001
Pvr (mmHg) 12.04 3.70 10.52 2.27 0.106 19.40 6.88 0.003
Rvr (mmHg•min•l-1) 2.18 0.86 2.41 1.14 0.184 2.91 1.10 0.037
Rsys (mmHg•min•l-1) 15.89 9.00 16.95 10.27 0.379 13.52 5.60 0.122
Rvr/Rsys (%) 14.94 5.00 14.84 2.37 0.931 22.62 8.07 0.006