AUSTRALIAN JOURNAL OF BASIC AND
Open Access Journal
Published BY AENSI Publication
© 2016 AENSI Publisher All rights reserved This work is licensed under the Creative Commons http://creativecommons.org/licenses/by/4.0/
To Cite This Article: S. Divya and K. Stella., J. Basic & Appl. Sci., 10(1):345-353, 2016
Priority Based Mobile Data Collection Using
Networks
1
S. Divya and 2K. Stella
1
PG Scholar, Department of Electronic and Communication Systems, Sree Sastha Institute of Engineering and Technology 2Assistant professor, Department of Electronic and Communication Systems
Address For Correspondence:
S. Divya, PG Scholar, Department of Electronic and Communication Systems, Sree Sastha Institute of Engineering and Technology E-mail: [email protected]
A R T I C L E I N F O Article history:
Received 10 December 2015 Accepted 28 January 2016 Available online 10 February 2016
Keywords:
Energy consumption, Wireless Sensor Networks, (WSNs), Load Balanced Clustering and Dual Data Uploading (LBC-DDU), Cluster Head Groups (CHGs), BiSenCar, Polling points, Delay, Throughput, Efficiency
The main objective of this paper
and efficiency. The sensors are used to monitor physical (or) environmental condition such as
sound, pressure etc. After collecting the data it is passed through the network to main node, while transmitting the data the battery dried off. In WSN, it is complex to recharge or change the battery. Most of the application user autonomous sensor, initially the sensors form
close to the data sinks dries off the battery faster when compared to the other sensors due to the traffic (AkyildizI, F., 2002). Because of the dried energy
order to reduce the depletion of batteries the energy consumption should be made low. Based on the observations, a three-layer mobile data
The 3 layers consist of sensor layer
algorithm organizes themselves into clusters. To achieve this LBC algorithm is used. In this algorithm generates multiple cluster heads in each cluster. This achieves to balance the work loa
layer, choose the transmission range and connectivity among the clusters. Multiple cluster heads are created as a power saving measure. The information of the cluster head is forwarded to SenCar.
The BiSenCar form the mobile collector layer, upload data simultaneously. This uses Multi User
AUSTRALIAN JOURNAL OF BASIC AND
APPLIED SCIENCES
ISSN:1991-8178 EISSN: 2309-8414 Journal home page: www.ajbasweb.com
© 2016 AENSI Publisher All rights reserved
This work is licensed under the Creative Commons Attribution International License (CC BY). http://creativecommons.org/licenses/by/4.0/
S. Divya and K. Stella., Priority Based Mobile Data Collection Using BiSenCar in Wireless Sensor Networks
Mobile Data Collection Using BiSenCar in Wireless Sensor
, Department of Electronic and Communication Systems, Sree Sastha Institute of Engineering and Technology Department of Electronic and Communication Systems, Sree Sastha Institute of Engineering and Technology
PG Scholar, Department of Electronic and Communication Systems, Sree Sastha Institute of Engineering and Technology
A B S T R A C T
Wireless Sensor Networks (WSNs) are an active research area in computer science and telecommunication. Consumption of energy is a major concern. Load Balanced Clustering and Dual Data Uploading (LBC-DDU) frame work consisting of three are proposed for mobile data collection in wireless sensor networks, which includes the sensor layer, cluster head layer, and mobile collector (called SenCar layer). In the sensor layer, the sensors are self organized into the cluster by the distributed LBC algorithm. The sensor which has high residual energy is considered as cluster head. Each cluster has multiple cluster heads called Cluster Head Groups (CHGs). cluster head layer, the cluster head collects the data from the clusters and it transfer the data to the sink through the neighbour cluster heads. Whenever the energy level reaches below the threshold level, SenCar calculate distance and get the dat
polling points in the SenCar layer. There are two antennas in SenCar to receive the data from the cluster heads simultaneously and it transfers to the sink. In proposed method, BiSenCar are used to collect the data from the lowest energy
priority and transmit to the sink. Energy consumption, delay will be reduced and also throughput, efficiency will be increased.
INTRODUCTION
aper is to reduce the energy consumption, delay and to increase
The sensors are used to monitor physical (or) environmental condition such as
After collecting the data it is passed through the network to main node, while transmitting the data the battery dried off. In WSN, it is complex to recharge or change the battery. Most of the application
sensor, initially the sensors forms into an autonomous organisation. The
off the battery faster when compared to the other sensors due to the traffic . Because of the dried energy of the battery connectivity and coverage will be reduced. In order to reduce the depletion of batteries the energy consumption should be made low. Based on the
layer mobile data collection is used.
nsor layer, cluster head layer, mobile collector layer
algorithm organizes themselves into clusters. To achieve this LBC algorithm is used. In this algorithm generates multiple cluster heads in each cluster. This achieves to balance the work load of the cluster. In the cluster head layer, choose the transmission range and connectivity among the clusters. Multiple cluster heads are created as a power saving measure. The information of the cluster head is forwarded to SenCar.
SenCar form the mobile collector layer, BiSenCar has two antennas, which help the cluster heads to upload data simultaneously. This uses Multi User-Multiple Input and Multiple Output (MU
Priority Based Mobile Data Collection Using BiSenCar in Wireless Sensor Networks. Aust.
in Wireless Sensor
, Department of Electronic and Communication Systems, Sree Sastha Institute of Engineering and Technology Sree Sastha Institute of Engineering and Technology
PG Scholar, Department of Electronic and Communication Systems, Sree Sastha Institute of Engineering and Technology.
less Sensor Networks (WSNs) are an active research area in computer science and telecommunication. Consumption of energy is a major concern. Load Balanced DDU) frame work consisting of three-layers obile data collection in wireless sensor networks, which includes the sensor layer, cluster head layer, and mobile collector (called SenCar layer). In the sensor layer, the sensors are self organized into the cluster by the distributed LBC ensor which has high residual energy is considered as cluster head. Each cluster has multiple cluster heads called Cluster Head Groups (CHGs). In the cluster head layer, the cluster head collects the data from the clusters and it transfer the data to the sink through the neighbour cluster heads. Whenever the energy level reaches below the threshold level, SenCar calculate distance and get the data by selecting the polling points in the SenCar layer. There are two antennas in SenCar to receive the data from the cluster heads simultaneously and it transfers to the sink. In proposed method, BiSenCar are used to collect the data from the lowest energy cluster heads based on the priority and transmit to the sink. Energy consumption, delay will be reduced and also
and to increase the throughput The sensors are used to monitor physical (or) environmental condition such as temperature, After collecting the data it is passed through the network to main node, while transmitting the data the battery dried off. In WSN, it is complex to recharge or change the battery. Most of the application The sensors that are not off the battery faster when compared to the other sensors due to the traffic f the battery connectivity and coverage will be reduced. In order to reduce the depletion of batteries the energy consumption should be made low. Based on the
In sensor layer, LBC algorithm organizes themselves into clusters. To achieve this LBC algorithm is used. In this algorithm generates d of the cluster. In the cluster head layer, choose the transmission range and connectivity among the clusters. Multiple cluster heads are created as a
346 S. Divya and K. Stella, 2016
Australian Journal of Basic and Applied Sciences, 10(1) January 2016, Pages: 345-353
type (Ajib, W. and D. Haccoun, 2005; Cui, S., 2004). Dual data uploading capacity is used to select polling points in each cluster. The BiSenCar visits each selected polling points and gather data efficiently and transport the data to the data sink. By using the technique of LBC-DDU achieves over 60% energy is saved per node and 75% energy in cluster heads as shown in Fig. 1.
Fig. 1: Illustration of LBC-DDU frame work.
Methodology:
In order to gain better energy consumption during the data collection from the cluster head and data transmission to the base station. Before the cluster head lifetime expires, a BiSenCar cannot able to collect the data. To overcome this effect, BiSenCar are proposed to collects the data based on the priority and transmits to the sink.
A. Sensor Layer – LBC:
In sensor layer, LBC algorithm is used for sensors to self-organize themselves into clusters. The essential operation of clustering is the selection of cluster heads. The selected cluster heads are the ones with higher residual energy. Each sensor is covered by at least one cluster head inside a cluster. Clustering enables network scalability and extends the life of the network by allowing the sensors to conserve energy through communication with closer nodes and by balancing the load among the cluster head nodes (Kenan Xu, 2010). Clusters are formed based on the cost of communication and the load on the cluster heads.
The LBC algorithm is comprised of four phases
• Initialization
• Status claim
• Cluster forming
• Cluster head synchronization
a. Initialization:
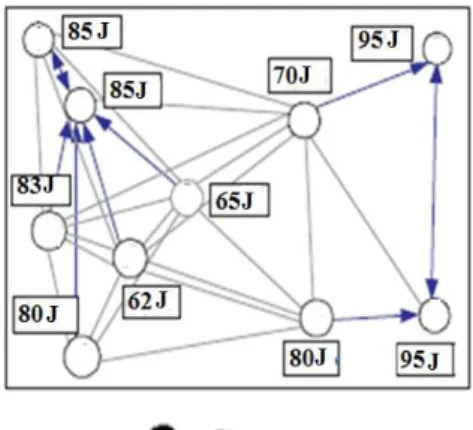
In the initialization phase, each sensor acquaints itself with all its near neighbours. The sensors si would
pick one neighbour with the highest initial priority as its candidate peer as shown in Fig. 2.
It implies that once si successfully claims to be a cluster head, its up
automatically become the cluster heads and all of them form the CHG of their cluster. In this way, a sensor can choose its favourable peers along with its status decision.
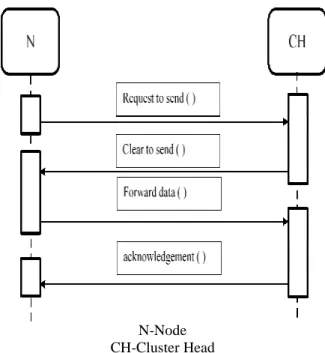
of 100Joules as shown in Fig. 3.
Fig. 3: Sequence diagram for nodes communication
b. Status claim phase:
Each sensor determines its status by iteratively updating its local information, refraining from promptly claiming to be a cluster head. The
sensors are members in the cluster as shown
Fig. 4: Status Claim of LBC algorithm
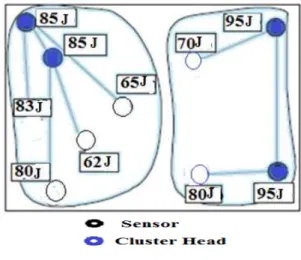
c. Cluster forming phase:
The third phase is cluster forming that decides which cluster head a sensor should be associated with
cluster consists of two cluster heads and sensors as shown in Fig.
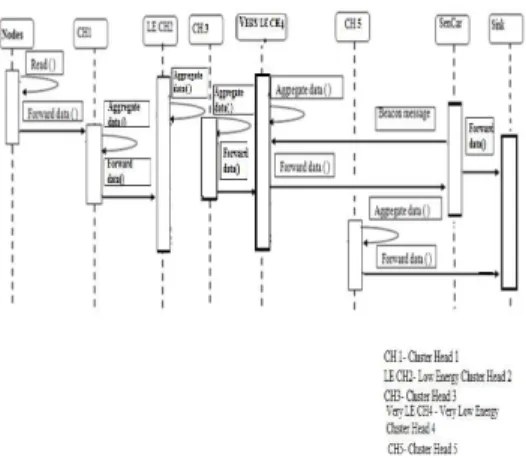
d. Cluster head synchronization phase
The fourth phase is to synchronize local clocks among cluster heads in a CHG by beacon messages. The communication between the nodes and cluster head in the CHG is called intra cluster communication as shown in Fig. 6.
successfully claims to be a cluster head, its up-to-date candidate peers would also automatically become the cluster heads and all of them form the CHG of their cluster. In this way, a sensor can choose its favourable peers along with its status decision. 50 sensor nodes are used with the initial energy level
N-Node CH-Cluster Head
diagram for nodes communication.
Each sensor determines its status by iteratively updating its local information, refraining from promptly
claiming to be a cluster head. The sensor which has high residual energy become a cluster head and other
as shown in Fig. 4.
Claim of LBC algorithm.
The third phase is cluster forming that decides which cluster head a sensor should be associated with
cluster consists of two cluster heads and sensors as shown in Fig. 5.
Cluster head synchronization phase:
The fourth phase is to synchronize local clocks among cluster heads in a CHG by beacon messages. The communication between the nodes and cluster head in the CHG is called intra cluster communication as shown
date candidate peers would also automatically become the cluster heads and all of them form the CHG of their cluster. In this way, a sensor can 50 sensor nodes are used with the initial energy level
Each sensor determines its status by iteratively updating its local information, refraining from promptly
sensor which has high residual energy become a cluster head and other
The third phase is cluster forming that decides which cluster head a sensor should be associated with. Each
348 S. Divya and K. Stella, 2016
Australian Journal of Basic and Applied Sciences, 10(1) January 2016, Pages: 345-353
Fig. 5: Cluster forming of LBC algorithm.
Fig. 6: Sequence diagram for cluster communication.
B. Cluster Head Layer:
The multiple cluster heads in a CHG coordinate among cluster members and collaborate to communicate with other CHGs is called inter-cluster communication (Euisin Lee, 2010). Hence, the inter-cluster communication in LBC-DDU is essentially the communication among CHGs. LBC-DDU can save energy for inter-cluster communication. In particular, the maximum distance of two neighbouring clusters is 2(√5+1) in
single-head clustering. The transmission power of a cluster head for such inter-cluster transmission can be
expressed as follows
PSHC = μ .
( )
. [ (√ ) ] (1)
where,
μ is the receive sensitivity
λ is the transmission wavelength
α represents the small-scale fading parameter between two cluster heads,
Gt and Gr are the transmitting and receiving antenna gains is the transmission wavelength L is a system loss factor not related to propagation.
Rs is the transmission range
The output power of each cluster head in the transmitting CHG is given by
PLBC =
μ .( ) .[ (√ ) ]
∑!"#∑!"# $%= $'= M > 2
μ .( ) .[+(√ ,
-) .]
∑!"#∑!"# $%= $'= M = 2
/ (2)
where,
μ is the receive sensitivity
λ is the transmission wavelength
parameter between two cluster heads,
Gt and Gr are the transmitting and receiving antenna gains is the transmission wavelength L is a system loss factor.
Rs is the transmission range
at and ar are the numbers of transmitting and receiving antennas M is the size of CHGs
C. SenCar Layer:
The trajectory of BiSenCar is optimizing for the data collection with the CHG information, which is referred to as the mobility control at the SenCar layer. First, the cluster heads collect data messages and calculate a deadline by averaging all the deadlines from messages in the cluster (Miao Zhao, M., 2011; Wu, Y., 2010).
All the clusters then forward their deadline information to BiSenCar. The BiSenCar selects the cluster head with the lowest energy level and moves to the polling point to collect data via MU-MIMO transmissions. After BiSenCar finishes data gathering, it checks to see whether collecting data from the next polling point would cause any violations of deadline in its buffer. If yes, it immediately moves back to the data sink to upload buffered data and resumes data collection in the same way. By prioritizing messages with earlier deadlines, SenCar would do its best to avoid missing deadlines as shown in Fig. 7.
Fig. 7: Sequence diagram for data collection.
Based on this receiver, the capacity of a 2 x 2 MIMO uplink between a scheduling pairs and SenCar located at a selected polling point can be expressed as follows.
0( ,2)∆ = log+1 + 6 ‖8!‖
9:; 6 ‖8<‖. + log (1 + 6 ‖8<‖
9: ) (3)
where, ha and hb are two 2 x 1 channel vectors between cluster heads a and b and SenCar at Δ respectively Pt is the output power of a sensor
Rs is the transmission range
N0 is the variance of the back-ground Gaussian noise.
Accordingly, the criteria for the schedule and the selected polling point for each corresponding scheduling pair in a cluster is given by
[π,∆ , ∆ , … … … ∆A] =
i
p' i
, max arg
∈ ∆ Π ∈
π +∑ 0( ,2)
∆
( ,2)Є . (4)
where,
π is a specified schedule
i ∈ C scheduling pair consists of cluster heads a and b
∆D and ED′ are the selected polling point and the set of candidate polling points for scheduling pair i
0( ,2)∆ is the achieved 2 x 2 MIMO uplink capacity for scheduling pair i when SenCar is positioned at ∆D
Throughput can be expressed as follows:
Throughput (bps) = SGKTU KNTVMWPMMPGV KPWLFG GH IJKLM NLOLPQLR (5)
Delay can be expressed as follows: Delay (s) = FXWILN GH IJKLM
350 S. Divya and K. Stella, 2016
Australian Journal of Basic and Applied Sciences, 10(1) January 2016, Pages: 345-353 D. Algorithm:
Step 1: Start the program
Step 2: Initializing the sensor nodes by fixing the number of sensor nodes, initial energy, type of antenna used and type of routing protocol.
Step 3: Positioning and plotting the sensor nodes. Step 4: Status are claimed by the each sensor.
Step 5: Sensors with high residual energy act as cluster head else it become members in cluster
Step 6: LBC algorithm is used to self organize the sensors into cluster. Each cluster has two cluster heads Step 7: If cluster heads want to send the data to BS, it selects a multi hop route for data forwarding Step 8: If route fails, cluster heads again searches next available route for data forwarding
Step 9: Adhoc On Demand Multipath Distance Vector (AOMDV) Routing Protocol (RP) is used for multi hop communication
Step 10: Cluster heads transmit the data to the sink by AOMDV RP
Step 11: If energy greater than threshold level the data are sent to BS using AOMDV RP
Step 12: Else using MIMO uploading technique the data from cluster heads is sent to BS through SenCar Step 13: BiSenCar calculate the distance and collects the data by selecting polling points from the SenCar layer Step 14: BiSenCar transmit the data to the sink
Step 15: Stop
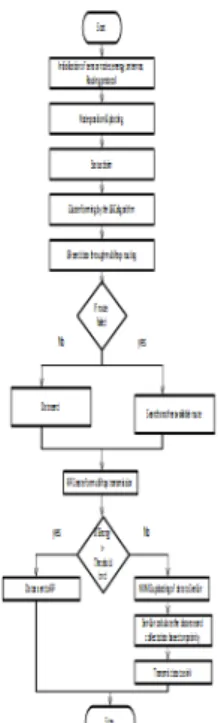
E. Flowchart for Data Collection By BiSenCar:
The process of simulation is explained in flowchart discussed below in fig. 9. Sensor nodes are initialized by fixing the number of sensor nodes, initial energy, type of antenna and type of routing protocol used. The sensor nodes are positioning and plotting. LBC algorithm is applied as shown in Fig. 8.
Fig. 8: Flowchart or Data Collection by BiSenCar.
Simulation And Result:
Network simulation tool provides more accurate results similar with real time implementation. This section shows simulation results of the proposed system.
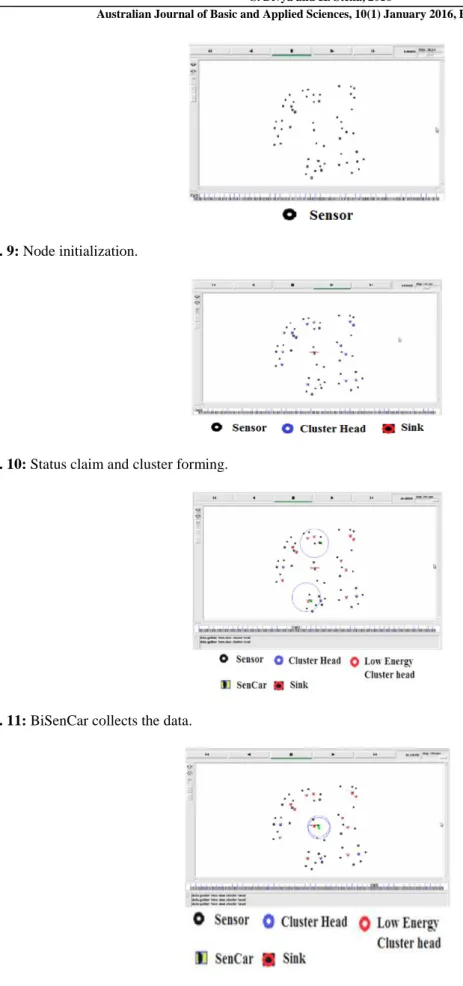
Step 1: 50 Sensor nodes are initialised with initial energy level of 100J and then sensor nodes are positioned and plotted as shown in Fig. 9.
Step 2: Each sensor determines its status and the sensor which has high residual energy become a cluster head and other sensors are members in the cluster. Sensors are self organize into the cluster by the LBC algorithm. Each cluster consists of two cluster heads and sensors as shown in Fig. 10.
Fig. 9: Node initialization.
Fig. 10: Status claim and cluster forming.
Fig. 11: BiSenCar collects the data.
Fig. 12: Data transmission to the sink.
352
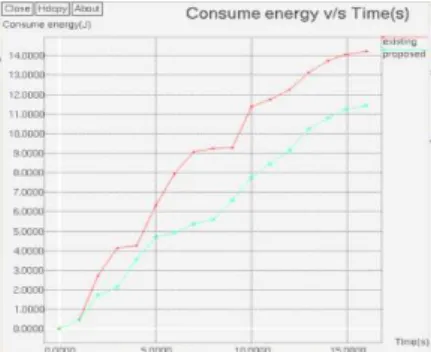
Australian Journal of Basic and Applied Sciences A. Energy Consumption:
Energy consumption is an important factor for battery operated devices. The Bi SenCar consumes less power when compared with existing method. Bi SenCar collec
SenCar. Therefore power consumption of networks are reduced by the above condition. The energy consumption of the existing and proposed
Fig. 13: Total energy consumption.
B. Throughput:
The capacity of the channel to carry information between source and destination is maximum. It also depends upon the overall performance of the network. Fig. 14
and proposed systems. Due to the implementation
Therefore, the proposed system achieves better throughput compared with existing systems
Fig. 14: Throughput ratio.
C. Delay:
Delay is the major problem for wireless networks due to its processing
delay of a network specifies how long it takes for a bit to travel across the network from one node or endpoint to another node. By the proposed system this delay can be reduced compared wit
Fig. 15: Delay.
The analysis of various parameters like delay, throughput and energy consumption during the transmission is represents in Table. 1.
S. Divya and K. Stella, 2016
Australian Journal of Basic and Applied Sciences, 10(1) January 2016, Pages:
345-Energy consumption is an important factor for battery operated devices. The Bi SenCar consumes less power when compared with existing method. Bi SenCar collects and transmits the data faster
SenCar. Therefore power consumption of networks are reduced by the above condition. The energy consumption of the existing and proposed system as shown in Fig. 13.
The capacity of the channel to carry information between source and destination is maximum. It also ormance of the network. Fig. 14 shows the throughput ratio between the existing and proposed systems. Due to the implementation of BiSenCar, network power consumption is minimized. Therefore, the proposed system achieves better throughput compared with existing systems
Delay is the major problem for wireless networks due to its processing and transmission capabilities. The delay of a network specifies how long it takes for a bit to travel across the network from one node or endpoint to another node. By the proposed system this delay can be reduced compared with existing as shown in Fig. 15
he analysis of various parameters like delay, throughput and energy consumption during the transmission -353
Energy consumption is an important factor for battery operated devices. The Bi SenCar consumes less ts and transmits the data faster than the single SenCar. Therefore power consumption of networks are reduced by the above condition. The energy
The capacity of the channel to carry information between source and destination is maximum. It also shows the throughput ratio between the existing of BiSenCar, network power consumption is minimized. Therefore, the proposed system achieves better throughput compared with existing systems.
and transmission capabilities. The delay of a network specifies how long it takes for a bit to travel across the network from one node or endpoint to
h existing as shown in Fig. 15.
Table 1: Analysis results for both proposed and existing system.
Parameters Existing system Proposed system
Delay analysis (b/s) 80 60
Throughput (kb/s) 330 340
Energy consumption (J) 14.2 11.4
Conclusion And Futurework:
The LBC-DDU framework is used for mobile data collection in a WSN. It consists of sensor layer, cluster head layer and SenCar layer. It employs distributed load balanced clustering for self-organize the sensors into clusters, adopts collaborative inter-cluster communication for energy-efficient transmissions among CHGs, uses dual data uploading for fast data collection, and optimizes BiSenCar mobility to fully utilize the benefits of MU-MIMO. The results show that LBC-DDU can greatly reduce energy consumptions by BiSenCar based on priority and balancing workload among cluster heads. Thereby time consumption for data collection is reduced to 70% and 85% of energy saving on cluster heads.
In future, data will be collected from the cluster heads by the multi SenCar in the priority manner. The
cluster head which has a lowest energy level is collected first by the multi SenCar and this data will be transmitted to the sink.
REFERENCES
AkyildizI, F., W. Su, Y. Sankarasubramaniam and E. Cayirci, 2002. ‘A survey on sensor networks’, IEEE Communication Magazine, 40(8): 102–114.
Ajib, W. and D. Haccoun, 2005. ‘An overview of scheduling algorithms in MIMO-based fourth-generation wireless systems’, IEEE Networks, 19(5): 43–48.
Jayaweera, S., 2006. ‘Virtual MIMO-based cooperative communication for energy constrained wireless sensor networks’, IEEE Transaction Wireless Communication, 5(5): 984–989.
Cui, S., A.J. Goldsmith and A. Bahai, 2004. ‘Energy-efficiency of MIMO and cooperative MIMO techniques in sensor networks’, IEEE Journal Sel. Areas Communication, 22(6): 1089–1098.
Kenan Xu, Hossam Hassanein, Glen Takahara, and Quanhong Wang, 2010. ‘Relay Node deployment strategies in heterogeneous wireless sensor networks’, IEEE Transaction Mobile Computing, 9(2): 145–159.
Euisin Lee, Soochang Park, Fucai Yu, and Sang-Ha. Kim, 2010. ‘Data gathering mechanism with local sink in geographic routing for wireless sensor networks’, IEEE Transaction Consumer Electronics, 56(3): 1433–1441.
Miao Zhao, M., Ma and Yuanyuan Yang, 2011. ‘Efficient data gathering with mobile collectors and space-division multiple access technique in wireless sensor networks’, IEEE Transaction Computation, 60(3): 400– 417.
Miao Zhao and Yuanyuan Yang, 2012. ‘Bounded relay hop mobile data gathering in wireless sensor networks’, IEEE Transaction Computing, 61(2): 265–271.