A Questionnaire Design for Dependent Interviewing that
Addresses the Problem of Cognitive Satisficing
Adriaan W. Hoogendoorn1
This article discusses the implementation of proactive dependent interviewing (PDI) in the setting of a large-scale socio-economic panel survey, where respondents participate using self-administered questionnaires on the web. The respondents’ task of reporting detailed information for topics such as “income” and “assets and liabilities” is both tedious and demanding, and is consequently susceptible to measurement error. In order to reduce both measurement error and respondent burden, it is recommendable to use previously gathered data. To overcome this problem, PDI was incorporated into the design of a questionnaire on “assets and liabilities.” However, a well-known problem with PDI is the threat of “cognitive satisficing”: respondents may be tempted to ease their task by reporting no change. This problem was met by implementing PDI in such a way that the respondent received few benefits when they reported no change. The result of this chosen strategy was a considerable improvement in data quality.
Key words: Dependent interviewing; preloading; computerized self-administrative questionnaires; data quality; respondent burden.
1. Introduction
A proper questionnaire design is crucial to the success of a survey. This is especially true for (computerized) self-administered interviews or web questionnaires, where no interviewer is present to guard the data collection process against potential survey errors. Dillman and Bowker (2001) list a set of important design principles to construct a respondent-friendly web questionnaire. These principles are intended to reduce the occurrence of survey errors through improvement of both the motivational aspects of responding and the technical user interface between computer and respondent. They take into account that respondents differ in computer literacy, and that their computers differ with respect to processing power, screen resolution and connection speed.
Incorporating dependent interviewing into a survey makes questionnaire design even more complex. The term “dependent interviewing” refers to data collection methods that use information from prior interviews or from other sources. Dependent interviewing can be implemented in two ways (see Brown, Hale, and Michaud 1998): in a pro-active or a reactive form. In proactive dependent interviewing (PDI), one presents previously given answers to the respondent before actually asking the same or a similar question again.
qStatistics Sweden
1Free University, De Boelelaan 1081C, NL 1081 HV Amsterdam, The Netherlands. Email: aw.hoogendoorn@ fsw.vu.nl
Acknowledgments:The author would like to thank Arie Kapteyn for stimulating the implementation of PDI into the CSS, Bas Weerman for his expertise on Internet programming, and Cees Elzinga and Melinda Mills for their helpful comments.
In reactive dependent interviewing (RDI), one uses the previously acquired data to check the answer to a repeat question and, in the case of any discrepancies, confronts the respondent with it. Implementing either PDI or RDI forces the survey designer to make many more decisions on how to outline the questionnaires, while there are very few empirical studies that discuss the design or the effects of dependent interviewing (see Mathiowetz and McGonagle 2000 for an overview). A topic that deserves special attention in this context is the problem of cognitive satisficing (see Krosnick 1991): respondents who are confronted with previous answers are tempted to state that there is no change. Satisficing behavior may be encouraged if stating that there was no change is “further rewarded” by the fact that no follow-up questions appear. A proper questionnaire design may address this problem by balancing the respondents’ efforts over the two options of stating there was a change or not.
This article describes and evaluates the implementation of PDI in a questionnaire on assets and liabilities of a socio-economic survey, and proceeds as follows. Section 2 gives a very brief description of the survey. Section 3 discusses the data collection problems that motivated the implementation of PDI. Section 4 discusses design issues related to the implementation of PDI. Sections 5 and 6 evaluate the use of PDI in the questionnaire design with respect to data quality and response burden, respectively. The article ends with a discussion and recommendations.
2. The CentER Savings Survey
CentER is an internationally oriented research institute, covering many research fields in economics and business administration. Since 1993, CentER has engaged in a large-scale household panel survey on financial behavior entitled the CentER Savings Survey (CSS). This survey covers topics such as work, income, housing and mortgages, assets and liabilities, pensions and further topics such as risk-taking behavior, time-preference, life expectancy, health, and so forth. The data were collected from a “telepanel” of 2,000 households by means of computerized self-administered questionnaires (see Saris 1998; Hoogendoorn, Sikkel, and Weerman 2000). Several researchers use these data to study the relationship between beliefs and attitudes on the one hand, and actual or reported economic behavior on the other hand (see Nyhus 1996).
3. Data Collection Problems
After several years, it became increasingly evident that there were serious problems regarding the data quality. A group of product specialists from a Dutch commercial bank pointed out that the variability of some parts of the data was too large to be realistic. For example, about 7.5% of the respondents reported a year-to-year change in their mortgage debts of more than 50%. Such variability was (according to these financial experts) an indication of poor data quality. Further research uncovered similar inconsistencies such as extremely low rereporting probabilities for many assets that are normally kept for several years in succession. The second problem was related to respondent burden. Many respondents complained about the fact that they were asked, time and again, to report detailed information about assets that do not frequently change. Owing to the high cost of acquiring respondents, the risk of loosing respondents due to annoyance with the survey
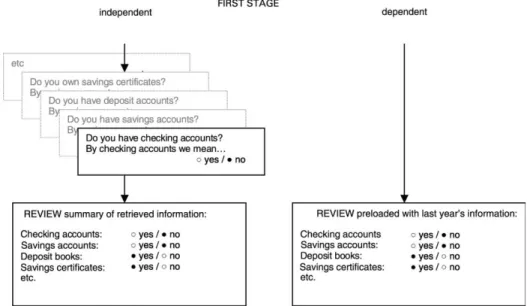
was a serious threat. Both the data quality and the threat of panel attrition were reason enough to reconsider our data collection methods and the questionnaire design. The first challenge was to investigate which aspects of the original design caused these problems. The second step was to attempt to overcome these problems within the restrictive boundaries that are set by the urgency, the technical possibilities and the financial limits of the sponsors of the project. Because of these constraints, we decided not to review the survey as a whole but to instead directly concentrate on the part of the survey that was notorious for a heavy respondent burden: the section “Assets and Liabilities” (A and L). In the original questionnaire, A and L I, there were two stages. In the first stage the respondent was asked to indicate the asset types that he/she possesses: checking accounts, savings certificates, real estate, cars, etc. The respondent received detailed information on each asset type in order to ensure a clear understanding of what a “savings account” or a “savings certificate” entailed, before he/she indicated “yes” or “no.” After indicating the asset types, the respondent received a review that summarized the answers given, and which permitted corrections. The first stage ended with the acceptance of this review. In the second stage of asset items, we focused on each indicated asset type. We first asked the respondent how many items (i.e., checking accounts, saving certificates, objects of real estate, cars, etc.) he/she owned, and then a requested specification of each item (i.e., with which bank, which type, which year, etc.) and – the key variable of the research – its current balance or value.
Evidently, the way A and L I was structured caused a great deal of annoyance and irritation on the part of repeat-respondents. At the same time, A and L I relied heavily on the accuracy of the respondents’ memories and their motivation to activate their memories. If either the accuracy or the motivation is lacking, data quality is obviously at stake. Thus, our first decision was to redesign A and L in such a way that it would suppress annoyance on the part of repeat-respondents and at the same time ensure better data quality by relying less on the respondents’ memories.
4. Design Issues
A clear way to simultaneously suppress the annoyance of respondents and reduce the reliance on respondents’ memories or motivation, is to present repeat-respondents with (parts of) previously gathered data, i.e., use a form of dependent interviewing. Mathiowetz and McGonagle (2000) offer an interesting list of practical and theoretical issues to consider when implementing either proactive dependent interviewing (PDI) or reactive dependent interviewing (RDI). Due to the reported annoyance, PDI seemed to be a more favorable method. However, when using PDI, there is the risk that respondents will suppress a report of a change or will not actively retrieve a possible change from memory. PDI shifts the cognitive task of the respondent from “remembering” to “recognizing.” If respondents recognize the information presented to them, but do not remember the change that took place, there will be underreporting of change. This effect is known as “cognitive satisficing” and has been well described by Krosnick (1991). With respect to data quality, underreporting is as bad as overreporting. Therefore, we decided to implement a form of PDI that could suppress this inclination to cognitive satisficing as much as possible. In the new design we attempted to balance the respondents’ efforts
over different answering strategies. On the one hand, if a respondent (simply) accepted the preloaded answers as still being valid, follow-up questions would appear. On the other hand, if the respondent tried to avoid follow-up questions he/she had to become active.
The new design of A and L II was implemented in 2000 into the CSS. Here new respondents were presented with the questions exactly as in A and L I as discussed above. For repeat-respondents, however, we changed both the first-stage questions of the interview (about asset types) and the second-stage questions (about the asset items and their specifications). For repeat-respondents we thus drastically reduced the number of first-stage questions, by deleting the entire set of yes/no asset type questions. For repeat-respondents, the first-stage was therefore reduced to checking the review of asset types. Thus, for a new respondent an “independent” method was employed as the review contained the answers that he/she just gave, whereas for a repeat-respondent, the answers were preloaded with last year’s information, demonstrating the “dependent method” (see Figure 1 for a block diagram representing the differences).
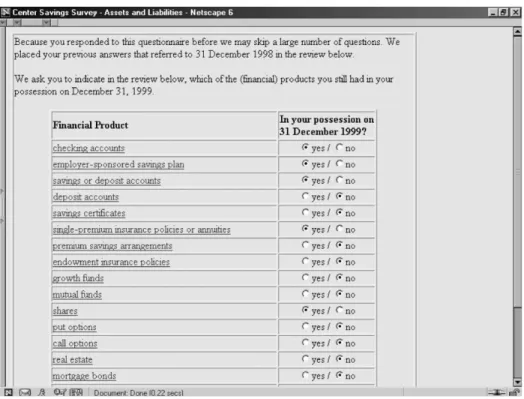
The rationale behind this reduction was that the repeat-respondents are familiar with the terminology and that the current situation was unlikely to differ much from that which existed at the time of the previous data collection wave. Figure 2 shows a screen capture of the preloaded review.
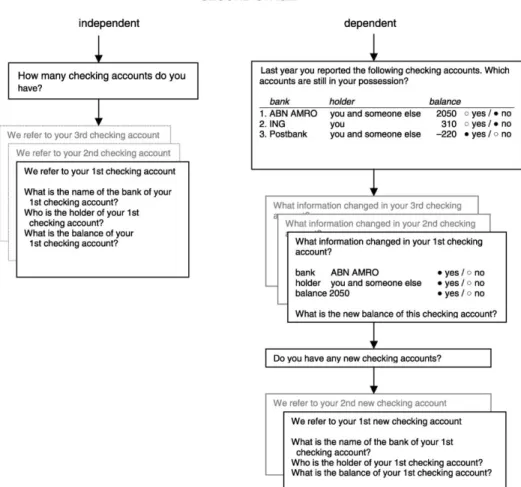
The implementation of PDI for the questions of the second stage required a thorough redesign, in which we made the following choices. For each asset type, we started by presenting the list of items (for example the list of checking accounts) that was reported in the previous wave. We then asked the respondent to indicate which items were still there. By default, the interviewing program suggested that all checking accounts were still there, i.e., no changes took place (see Figure 3).
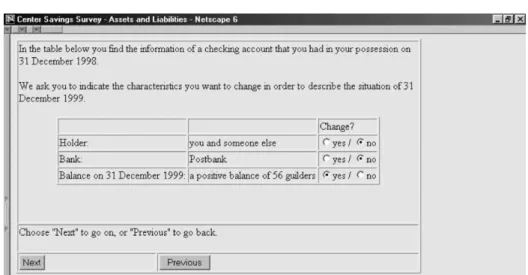
If a respondent accepted the default, then he/she was asked to check information about all checking accounts. Next, for each item that remained unchanged, we asked the
respondent which characteristics of the item that remained basically unchanged. Figure 4 shows a screen capture of this question in the case of a particular checking account.
By default, we expected that only the value (for checking accounts “balance”) changed, and that the other characteristics (for checking accounts: “holder” and “bank”) had remained the same. Nevertheless, we allowed the respondent to change the other
Figure 2. A screen capture that shows the review of assets in the case of dependent interviewing
specifications as well, since a such change could have taken place or since the respondent might want to correct a mistake that he/she made in the previous wave. Next, we asked for the new values for those characteristics that had changed. Note, again, that if a respondent accepted the default in choosing the characteristics that changed, he/she was still prompted to give a new balance for the checking account. Finally, we asked the respondent if there were any new items (e.g., checking accounts) that came into his/her possession. If there were new items, then the respondent was asked to provide the characteristics of these items in the same way as in the original design. Figure 5 summarizes the differences in the second stage between dependent and independent interviewing.
In designing the questionnaire A and L II, we attempted to adhere to the principles suggested by Dillman (2000) and Dillman and Bowker (2001) as closely as possible. We presented each question in a conventional format that resembled a paper questionnaire, in neutral colors and without graphics. The web pages looked the same for different screen resolutions, and we made sure that the questions and the next/previous buttons fitted on one screen (the review question shown in Figure 2 was an exception that we split into different parts in later waves). The question flow was a compromise based on the desire to use PDI while balancing the respondents’ efforts with technical limitations. We needed a powerful scripting language for “online interviewing” on the web that allowed us to present more than one question per screen. We used the Blaise system (Statistics Netherlands 1999) in combination with CentERdata’s C2B software (Weerman 2001). With these software tools, we programmed one questionnaire with one routing for repeat-respondents and another for new repeat-respondents, leading to a single dataset that contained data from both respondent types, and such that the program could be used for the next wave with very little alteration.
5. PDI and Data Quality: Did It Work?
To test whether the PDI approach worked, we now turn to the data. Changes in reported assets between 2000 and 1999 (when PDI was used) are compared with the changes in
reported assets between 1999 and 1998 (when PDI was not used). Data quality, defined in terms of rereporting of asset types and the reporting of variability of asset specification, will be evaluated by comparing the A and L II data (generated by PDI), concerning changes between 2000 and 1999, with the A and L I data (generated without PDI) concerning changes between 1999 and 1998. Table 1 shows the relationship between the use of PDI and rereporting probabilities for asset types in the first stage of the questionnaire. We see that when we do not use PDI, the probability that a respondent will report checking accounts given the fact that he/she reported checking accounts the year
Figure 5. Diagram comparing the second stage in the cases of independent and dependent interviewing
Table 1. Probability of rereporting asset types
A and L I (no PDI) A and L II (PDI)
Checking accounts 0.91 0.98 Deposit accounts 0.61 0.77 Single premium annuity
insurance policies
0.64 0.86
before is equal to 0.91. Financial experts that examined the data agreed that this probability is suspiciously low. The 0.91 suggests that almost one out of 10 persons that claim to have checking accounts in one year, claim to have no checking accounts at all the next year. When we used PDI, this same probability was much higher: at 0.98. We see that for all four asset types, we end up with much higher rereporting probabilities if we use PDI.
Table 2 shows the relationship between the use of PDI and the rereporting probabilities for theitems of asset typesin the second stage of the questionnaire (e.g., account holder, balance, bank). We see that without the use of PDI, the probability that a respondent will report details regarding a certain checking account given the fact that he/she reported the same checking account (characterized by the account holder and the bank) the year before, is equal to 0.64. Note that this figure implies that one out of three checking accounts is closed within one year, not reflecting reality according to financial experts. When we used PDI, this probability increased dramatically to 0.92. We see that, for all asset types, A and L II generated higher rereporting probabilities. According to product specialists of a Dutch commercial bank the rereporting probabilities of “checking accounts” and “single premium annuity insurance policies” were still too low.
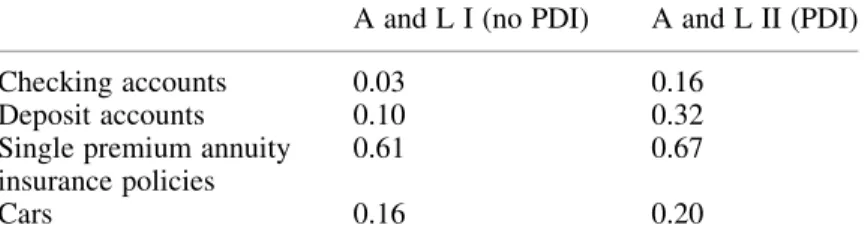
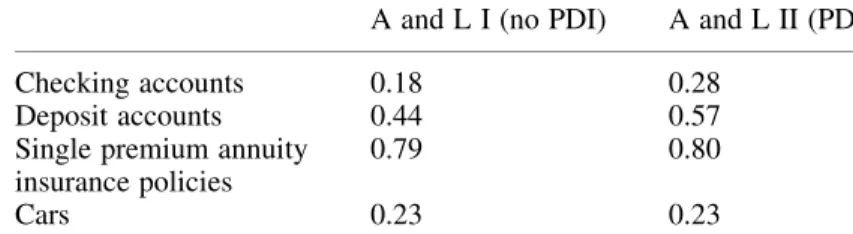
At the item stage, the aspect of greatest interest is the currency value of the item. Aggregated over all items of all asset types, these quantities amount to the total personal assets. Table 3 shows the probabilities that an item was reported as unchanged. We see that, as expected, these probabilities were higher when we used PDI. It is interesting to note that none of these numbers is even close to one, which suggests that the suppression of satisficing was effective indeed. Table 4 shows the probability of a “small change in value,” which was defined as a change of less than 10% of the earlier reported value or an absolute change of less than 100 guilders. Note that these figures show less difference than the figures in Table 3, suggesting that some of the “unchanged values” could have been “negligible” changes.
Table 2. Probability of rereporting specifications of asset types
A and L I (no PDI) A and L II (PDI)
Checking accounts 0.64 0.92 Deposit accounts 0.29 0.62 Single premium annuity
insurance policies
0.25 0.53
Cars 0.57 0.75
Table 3. Probability of “unchanged value” of items of asset types
A and L I (no PDI) A and L II (PDI)
Checking accounts 0.03 0.16 Deposit accounts 0.10 0.32 Single premium annuity
insurance policies
0.61 0.67
6. PDI, Respondent Burden, and Subjective Evaluation
Wave 7 of the CSS where PDI was implemented generated far fewer complaints from repeat-respondents than any of its predecessors. However, the number of complaints generated by Wave 7 and previous waves are not directly comparable, since such complaints were not registered in a way that is open to an analysis that is relevant within the context of the present article. On the other hand, registering complaints and the nature thereof only provides data that represents the feelings of the complainers and not those of the noncomplainers. A complaint could be interpreted as an explicit sign of excessive respondent burden. This raises the question: What exactly is respondent burden? Bradburn (1978) distinguishes four dimensions of respondent burden: the length of the interview, the respondents’ effort, the respondents’ stress (personal discomfort) and the frequency of being interviewed. In practice, respondent burden is usually measured in terms of the time it takes to complete the questionnaire (see, e.g., Singer et al. 1999) or frequency of being interviewed (see, e.g. Hoogendoorn and Sikkel 1998). In Haraldsen’s (2002) model, the perceived burden is a result of the interaction of survey properties and respondent characteristics (motivation and competence).
To evaluate the design with respect to respondent burden, we examine two sources. First, we study the total time spent on (parts of) the questionnaire. This temporal information is obtained from theparadatain log files that are stored automatically on the file server that hosts the web survey (see Hoogendoorn 2001). Secondly, we analyze a set of five evaluation questions that might give us some insight into the subjective evaluation by the respondent regarding a number of salient characteristics of the questionnaire.
. How interesting did you find the topic?
. How easy was it for you to do the interview?
. How clear were the questions for you?
. How did you like the layout of the questions?
. What do you think of the length of the interview?
The respondents of the telepanel, who fill out a questionnaire every week, grade all questionnaires on these “dimensions.” The scale used ranges from 0 (very bad) to 10 (excellent), which is a common scale in the Netherlands used at school as “final grades.” We compare the time spent by new respondents with the time spent by repeat-respondents in the wave of 2000. Note that the comparison between new repeat-respondents and
Table 4. Probability of “small change in value” of items of asset types
A and L I (no PDI) A and L II (PDI)
Checking accounts 0.18 0.28 Deposit accounts 0.44 0.57 Single premium annuity
insurance policies
0.79 0.80
Cars 0.23 0.23
Note: A “small change in value” is a relative change of less than 10% or an absolute change of less than 100 guilders.
repeat-respondents is not completely fair, since the repeat-respondents were familiar with the questionnaire and its terminology and the new respondents were not. Although the two groups were not purposively set up in an experimental design, we do get some indications from this comparison. Table 5 shows the median time spent by 932 new respondents and 651 repeat-respondents on different parts of the questionnaire. Medians are more appropriate than means, since the time distribution is severely skewed to the right. We see that the time spent on the total questionnaire is somewhat less for the repeat-respondents than for the new respondents. The difference, however, is modest at around 10%.
If we study the time spent on the different parts of the questionnaire, we find that in the first stage, on average, the new respondents take 218 seconds, including 24 seconds for the review. With respect to the second stage of the questionnaire, we see that for most asset types, new respondents use less time than repeat-respondents. Although this may surprise the reader, it can be explained by the following example. Let us suppose a respondent owns two checking accounts. In this case, the number of questions for a new respondent would be seven. The first question is: “How many checking accounts do you have?” Then for both the accounts there are three questions: “Who is the holder of the first (second) checking account?”, “With which bank is the first (second) checking account?”, and “What is the balance of the first (second) checking account?” In the case of a repeat-respondent, the number of questions in A and L II is in fact higher. The repeat-respondent obtains a screen with two questions to determine what checking accounts are still in their possession (see Figure 3). Then for both checking accounts the respondents get a screen with three questions to determine what characteristics have changed (see Figure 4) and a question to determine the new balance. Finally, there is a question to determine whether the respondent owns any new checking accounts. In Table 5 we see one specific asset type (single premium annuity insurance policies), for which the new respondents use more time than the repeat-respondents. The explanation for this exception is that a single premium annuity insurance policy has many identifying characteristics. However, we found no substantial reduction in time due to the use of PDI. Yet there may be a reduction of the respondents’ effort when constructing the answers. Next to a reduction of cognitive
Table 5. Median time spent on different parts of A and L II
new respondents repeat-respondents
seconds n seconds n
total questionnaire 982 932 896 651
first stage:
indicating asset types 194 932 0 651 the review of asset types 24 932 55 651
total first stage 218 932 55 651
second stage:
checking accounts 103 854 167 587
deposit accounts 57 104 102 147
single premium annuity insurance policies
173 196 149 103
efforts, the respondent may be less annoyed, since we do not ask him/her to report the same assets two (or more) years in a row.
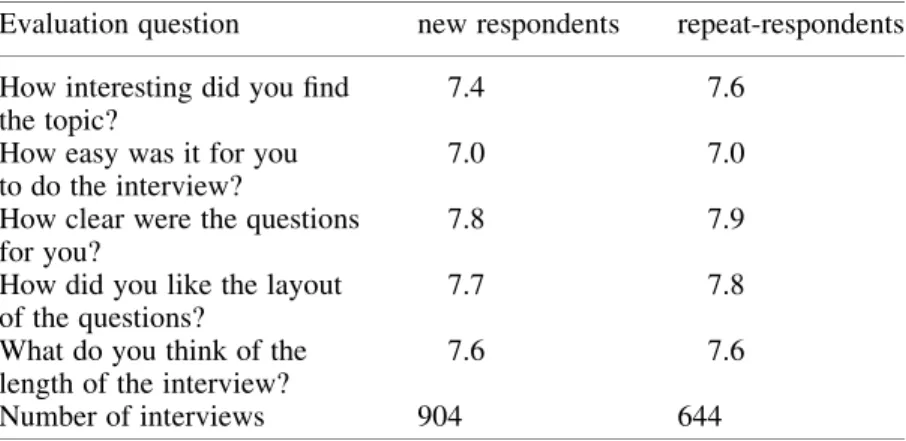
An alternative way to evaluate the effect of PDI on respondent burden is to find out if there is a difference in perception of the questionnaire between the two groups. Do respondents who received a preloaded questionnaire perceive the questionnaire differently than respondents who started from scratch? To answer this question we can use the set of evaluation questions, the results of which are shown in Table 6. We find very little difference in the way that the two groups of respondents evaluate the interviews. It can be seen that there is no difference in the subjective evaluation of the easiness or of the length of the interview.
7. Discussion, Perspectives, and Recommendations
Clearly, the data, the analysis and the conclusions drawn up so far relate to one case study. From the perspective of the demanding scientist, this simple fact prevents the generalization of any of the findings above and beyond the setting as described. On the other hand, the fact that both the results on rereporting of asset types (Table 1) and on rereporting of the specifications of asset types (Table 2) are strongly convergent, is a strong indication that the change in response behavior was in fact caused by the introduction of PDI. At the same time, Tables 3 and 4 suggest that the chosen strategy suppressed the problem of “cognitive satisficing.” From a practical point of view, the successful implementation of PDI in the setting of a large-scale socio-economic survey is a rare species.
There is ample room for discussion as to whether or not A and L II really embodied an implementation of PDI and not of RDI in disguise. A and L II may actually be a very useful mixture of both concepts. We indeed presented respondents with previously given answers on the same question before a new response was required. But if the respondent accepted this preloaded data as still reflecting his/her present situation, he/she was confronted with follow-up questions that checked his/her recognition and activated his/her memory.
Table 6. Averages of evaluation scores of the A and L II questionnaire for new respondents and repeat-respondents
Evaluation question new respondents repeat-respondents
How interesting did you find the topic?
7.4 7.6
How easy was it for you to do the interview?
7.0 7.0
How clear were the questions for you?
7.8 7.9
How did you like the layout of the questions?
7.7 7.8
What do you think of the length of the interview?
7.6 7.6
Number of interviews 904 644
This is, in a sense, exactly what happens in RDI. Yet in our implementation, it is thelack of
reported discrepancy between past and present that triggers the checking and not a discrepancy as such. Therefore, in our case, the conceptual difference between RDI and PDI is blurred or, to put it positively, we seem to have successfully mixed the two concepts. This mixture probably had the advantageous effect of suppressing satisficing behavior while at the same time improving data quality by including checks on the correctness of answers given. This case study could thus be a useful and innovative stimulus to experimental work in the field of dependent interviewing.
Did the use of dependent interviewing lower respondent burden? The evidence on this is inconclusive. We did receive fewer complaints from repeat-respondents, compared to previous years when no dependent interviewing was used. But, is this enough to claim a reduction? The other indicators failed to measure a reduction. There was no difference in response time when we compared new and repeat-respondents. However, we should note that due to the mix of RDI and PDI we balanced the efforts, and therefore response time, between the two groups. Also, the subjective evaluations of the respondents hardly show any difference between the two groups. But here we must also realize that we compare new respondents with repeat-respondents. We expect a reduction in respondent burden for repeat-respondents, since dependent interviewing relieves them from the annoying task of repeatedly reporting the same assets. Therefore, we suggest that it would be interesting to set up a study that allows the comparison of two groups of repeat-respondents: one group with dependent interviewing and one without.
Did the use of dependent interviewing result in better data quality? According to the product specialists of a Dutch commercial bank it did. They were convinced that rereporting probabilities of asset types and items were “absolutely unrealistic” in the case of independent interviewing and “much more plausible” in the case of dependent interviewing. But if we do not include the arguments of the experts, the evidence for better data quality remains questionable. The increase in rereporting probabilities is not a guarantee of better data quality, since we may end up with overreporting. According to the financial experts the rereporting probabilities were still too low in the case of dependent interviewing, which is interesting in itself. They claim that in general customers do not close their accounts, but leave them with a low or zero balance. Do the customers forget these accounts, or do they think it is not worthwhile to report them? More evidence would be welcome. Since the truth behind the data within this questionnaire could be observed from bank registration data, it would be interesting to set up a research project where the reported assets could be compared with registrations.
Was the design that we chose optimal? There are many design aspects that can be improved. However, the design of A and L II can be envisioned as an important first step. The technical implications of incorporating the current design were already immense. In implementing PDI, one has quite a lot of design options with respect to the use of the previous information. The following are three examples. First, one can decide to use all of the information (e.g., as with checking accounts in A and L II), or one can decide to use only a part of the information (e.g., only provide the number of previously reported checking accounts, or only provide the information on the bank and the holder andnoton the balance). Second, one can choose to only display the information, or go as far as to preload the answers into the answer fields. Third, in the design of A and L II, an
intermediate question was used to check what information changed (see Figure 4), but it must be technically possible to allow a respondent to edit a table (see Figure 3). This may result in a smoother flow of questions. The effect of these kinds of design options on both data quality and respondent burden needs to be further explored.
Is it worthwhile to implement dependent interviewing? Before answering this question, some words of caution are needed. One has to be aware that the implications of incorporating dependent interviewing are immense. It requires substantial programming efforts to incorporate dependent interviewing into a computer-assisted interview. Testing of the questionnaire – both at the level of software testing and at the level to find out how respondents react to the questionnaire design – is at the same time difficult and essential. For example, we underestimated the time that was needed to program and test the software, so there was no time left to perform a pilot test on a subgroup of the respondents. To answer the question of whether dependent interviewing was worthwhile in our case, it is useful to evaluate it in terms of relative costs and benefits (e.g., Mathiowetz and McGonagle 2000). The approximate cost of losing repeat-respondents is staggering: some EUR 500 per respondent. On the other hand, the cost of switching from A and L I to A and L II roughly amounted to some EUR 25,000. Thus, the break-even point of the operation was already reached when we prevented the loss of 50 dissatisfied respondents. The general feeling of the staff of CentERdata was that we prevented a much bigger loss. Of course, we cannot estimate the profit from obtaining better data. That the data from A and L II were indeed better seems to be beyond doubt, which is encouraging for future research.
8. References
Bradburn, N.M. (1978). Respondent Burden. In Proceedings of the American Statistical Association, Section of Survey Research Methods, 35 – 39.
Brown, A., Hale, A., and Michaud, S. (1998). Use of Computer Assisted Interviewing in Longitudinal Surveys. In M.P. Couper, R. Baker, J. Bethlehem, C. Clark, J. Martin, W.L. Nicholls, and J.L. O’Reilly (eds), Computer Assisted Survey Information Collection. New York: John Wiley and Sons.
Dillman, D.A. (2000). Mail and Internet Surveys, the Tailored Design Method (2nd edition). New York: John Wiley and Sons.
Dillman, D.A. and Bowker, D.K. (2001). The Web Questionnaire Challenge to Survey Methodologists. In Dimensions of Internet Science, U.D. Reips and M. Bosnjak (eds). Lengerich: Pabst Science Publishers, 159 – 178.
Haraldsen, G. (2002). Identifying and Reducing the Response Burden in Internet Business Surveys. Paper presented at QDET, International Conference on Questionnaire Development, Evaluation, and Testing Methods, November. Charleston, SC.
Hoogendoorn, A.W. (2001). Some Techniques for Internet Interviewing. Proceedings of the 7th International Blaise Users Conference, Westat, Washington, DC.
Hoogendoorn, A.W. and Sikkel, D. (1998). Response Burden and Panel Attrition. Journal of Official Statistics, 14, 189 – 205.
Hoogendoorn, A.W., Sikkel, D., and Weerman B. (2000). The Internet, Blaise and a Representative Panel. Proceedings of the 6th International Blaise Users Conference, Central Statistical Office, Cork, Ireland.
Krosnick, J.A. (1991). Response Strategies for Coping with the Cognitive Demands of Attitude Measures in Surveys. Applied Cognitive Psychology, 5, 213 – 236.
Mathiowetz, N.A. and McGonagle, K.A. (2000). An Assessment of the Current State of Dependent Interviewing. Journal of Official Statistics, 16, 401 – 418.
Nyhus, E.K. (1996). The VSB-CentER Savings Project: Data Collection Methods, Questionnaires and Sampling Procedures. Progress Report 42, Center for Economic Research, Tilburg.
Saris, W.E. (1998). Ten Years of Interviewing Without Interviewers: The Telepanel. In Computer Assisted Survey Information Collection, M.P. Couper, R.P. Baker, J. Bethlehem, C.Z.F. Clark, J. Martin, W.L. Nicholls, and J.M. O’Reilly (eds). New York: Wiley, 409 – 429.
Singer, E., Van Hoewyk, J., Gebler, N., Raghunathan, T., and McGonagle, K. (1999). The Effect of Incentives on Response Rates in Interviewer-Mediated Surveys. Journal of Official Statistics, 15, 217 – 230.
Statistics Netherlands (1999). Blaise Developer’s Guide. Department of Statistical Informatics, Statistics Netherlands, Heerlen.
Weerman, B. (2001). Internet Interviewing Using Blaise API. Proceedings of the 7th International Blaise Users Conference, Westat, Washington DC.
Received February 2003 Revised January 2004