EXPERIMENTAL EFFECTS OF THERMAL CYCLING ON TITANITE MORPHOLOGY AND GROWTH
Tyler David Wickland
A thesis submitted to the faculty at the University of North Carolina at Chapel Hill in partial fulfillment of the requirements for the degree of Master of Science in the Department of
Geological Sciences.
Chapel Hill 2016
Approved by: Allen F. Glazner Drew S. Coleman
ii © 2016
iii ABSTRACT
Tyler David Wickland: Survival of the fattest: titanite growth during thermal cycling experiments
(Under the direction of Allen F. Glazner)
iv
ACKNOWLEDGEMENTS
v
TABLE OF CONTENTS
LIST OF TABLES ... vii
LIST OF FIGURES ... viii
LIST OF ABBREVIATIONS AND SYMBOLS ... ix
INTRODUCTION ... 1
Igneous textures ... 1
Crystal growth ... 1
Thermal cycling ... 2
CSDs ... 4
Titanite ... 6
One-atmosphere experiments ... 7
METHODS ... 9
Starting materials ... 9
Amplitude experiments ... 10
Period experiments... 11
Experimental procedure ... 12
Crystal measurement and analysis ... 13
RESULTS ... 17
Qualitative crystal textures ... 17
Crystal number densities ... 22
vi
Volume estimates and CSDs in τ experiments ... 26
DISCUSSION ... 30
Crystal destruction ... 30
Static T ... 30
Amplitude and period ... 31
Temperature cycling effects on growth rate ... 32
Comparing growth rates ... 32
Growth effects of amplitude ... 33
Growth effects of period ... 34
CSD modeling ... 35
Implications for titanite growth in igneous systems ... 37
CONCLUSIONS... 39
APPENDIX A: COMPOSITION OF NATURAL STARTING MATERIALS... 40
vii
LIST OF TABLES
viii
LIST OF FIGURES
Figure 1. Diffusion model of proportional crystal dissolution ... 3
Figure 2. Example CSDs ... 5
Figure 3. Experimental T-t path ... 8
Figure 4. Albite-titanite (sphene) phase diagram ... 9
Figure 5. Titanite seed eigenlengths ... 11
Figure 6. T-t path of experimental cycling ... 13
Figure 7. Backscattered electron image of an experiment ... 14
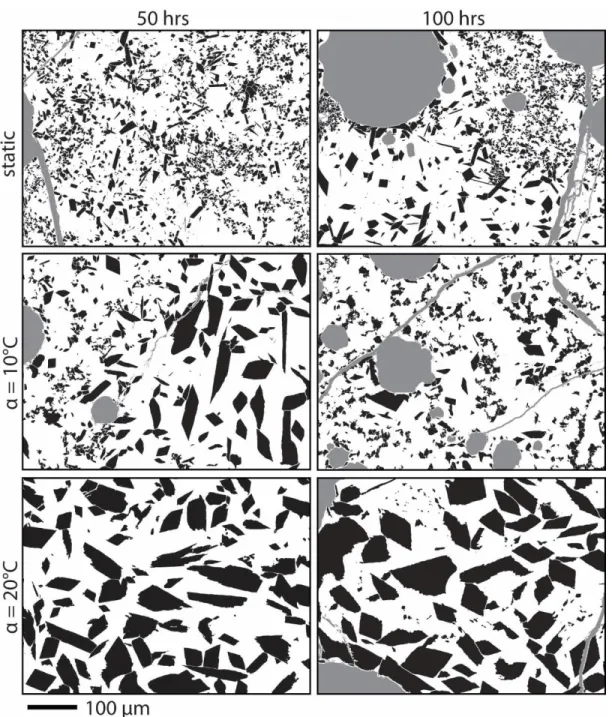
Figure 8. Binary images of titanite in amplitude experiments ... 18
Figure 9. Binary images of titanite in period experiments ... 20
Figure 10. Crystal number densities and characteristic sizes for amplitude experiments ... 23
Figure 11. Crystal number densities and batch growth rates for period experiments ... 24
Figure 12. Batch growth rates for amplitude experiments ... 25
Figure 13. Growth rates of the largest crystals for period experiments ... 26
Figure 14. Volume estimates and CSDs for period experiments ... 28
ix
LIST OF ABBREVIATIONS AND SYMBOLS
A α ab atm BSE CSD CN °C 2D/3D Φ G h kV min mm µm NA NV nA REE SN T crystal area amplitude albite atmosphere backscattered electron crystal size distribution communicating neighbors degrees Celsius
two or three dimensions crystal area fraction growth rate hour kilovolts minute millimeter micrometer
crystal area density crystal volume density nanoamps
x T
t τ ttn wt% XRF
mean temperature time
period titanite
1
INTRODUCTION
Igneous textures
Crystal textures in igneous rocks are indicative of the magmatic processes and
environments under which they grew (e.g., Lofgren, 1980; Hersum and Marsh, 2007). Textures are controlled by the interplay of nucleation, growth, and their thermal history (Carmichael et al., 1974; Lofgren, 1974; Donaldson, 1976). Historically, textural analysis has lacked the
quantitative approach that advanced the related field of geochemistry (Jerram and Davidson, 2007). In a series of papers, Marsh and others made great strides to quantify textures, particularly by the use of crystal size distributions (CSDs) in silicate melts (Cashman and Marsh, 1988; Marsh, 1988). Cashman and Marsh applied CSD analysis to samples from a crystallizing basaltic lava pool and quantified nucleation and growth during cooling. Textural analyses of igneous rocks often oversimplify controlling factors such as Ostwald ripening, nucleation, and thermal conditions for pervasively dynamic crystal-melt systems (Pupier et al., 2008; Schiavi et al., 2009). Linking crystallization factors of silicate magmas and their resultant textures is important because crystal growth processes that govern the textures of natural magma systems are not well understood.
Crystal growth
2
affect larger crystal sizes (e.g. Nemchin et al., 2001) because only crystals close to their critical nucleation radius (≤ 1-5 µm) are ripened (Cabane, 2001; 2005; Simakin and Bindeman, 2008). Ostwald ripening may be viable in static temperature conditions, but conditions during the crystallization of a melt are subject to changes in temperature (e.g., Huppert and Sparks, 1988; Harper et al., 2004). Growth processes for crystallization under dynamic conditions are different from those under static or constant cooling conditions.
Disequilibrium crystallization occurs when conditions of crystallization change rapidly (Loomis, 1982). For example, crystallization during temperature oscillations keeps crystals in a state of disequilibrium because conditions are constantly changing. Crystal coarsening associated with temperature instabilities has previously been studied in materials science (Hintzmann and Müller-Vogt., 1969; Scheel and Elwell, 1972), food science (Donhowe and Hartel, 1996), and in magma systems (Lofgren, 1974; Paque et al, 2000; Zieg and Lofgren, 2006; Mills et al., 2011). Wu et al. (2016) linked temperature oscillations to controlling the size and quality of Fe2O3 polymorphs in solution, further highlighting the use of dissolution-recrystallization processes across many fields of study.
Thermal cycling
3
experiments. These experiments revealed that textural coarsening during crystallization of silicate melts could be significantly influenced by oscillating temperatures.
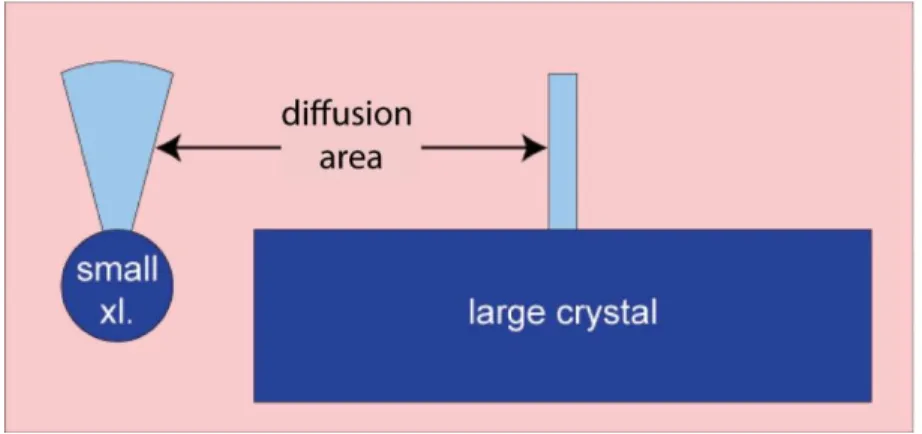
Figure 1. Smaller crystals, modeled as spherical, are exposed to larger amounts of melt than larger crystals. They are more susceptible to dissolution processes where greater amounts of material may diffuse into larger melt areas. Even with similar crystal shapes dissolution is inversely proportional to size due to the curvature of a dissolving surface and related diffusion flux (Simakin and Bindeman, 2008).
Mills and Glazner (2013) carried out thermal cycling experiments on plagioclase and olivine in a basaltic melt, revealing that thermal cycling significantly reduced the number of crystals per unit area (number density) and enhanced growth. Plagioclase grew 60% faster in cycled experiments compared to constant temperature experiments. They supported Simakin and Bindeman’s (2008) proposal that crystal dissolution is inversely proportional to size due to the curvature of the surface of a dissolving crystal, exposing larger crystal areas (in 2D) to the surrounding melt (Fig. 1).
The growth effects of thermal cycling are not well understood because of the
4
nucleation is observed to be suppressed during thermal cycling and is limited to existing crystal sites by the reduction of crystal number densities. This study will use several measures of
textural analysis to examine separately the effects of amplitude, period, and mean temperature on crystal growth and nucleation.
CSDs
CSDs are commonly lognormal for igneous rocks (e.g. Eberl et al. 2002) and are used to describe and interpret igneous textures (Cashman and Marsh, 1988; Higgins and Roberge, 2003; Pupier et al., 2008; Higgins, 2011). CSD analysis quantifies textures using the relationship between cumulative numbers of particles and their sizes (Fig. 2). CSDs are typically described by the natural log of the volumetric number density plotted against the crystal size. In cases where discrete 3D crystal sizes are unknown, volume number densities for a size interval are divided by the length of that size interval (Higgins, 2006). Blundy and Cashman (2008) outlined the use of CSD slopes to link population densities and crystal sizes to magmatic conditions. Higgins (1998; 2000; 2006) expanded the field of CSD analytics, creating the software
5
Figure 2. a) CSD of K-feldspar from Cathedral Peak Granodiorite, California, (Higgins, 1999) showing separation of slopes between groundmass and megacryst populations. Modeled CSDs by Higgins (1999) for b) linear increasing nucleation density (Marsh, 1988) and c) textural coarsening using CN equation.
Higgins (1998; 1999) recognized that coarsened crystal populations develop particular CSD slopes that could be modeled with the communicating neighbors (CN) theory. CN theory assumes that crystals coarsen, producing lower slopes on CSD plots, by growth rates controlled characteristically by each crystal, independent of size (i.e. growth dispersion) (Higgins, 1998). Higgins (1998; 1999; 2002; 2006) modeled coarsening CSDs from many igneous suites as diffusion controlled with the CN theory (Fig. 2c). Igneous textures commonly result in
lognormal CSDs, which are hard to justify when assuming growth independent of size because that would require prolonged and variable nucleation (Eberl et al., 2002).
6
Nevertheless, CSDs are used qualitatively to interpret crystallization histories because CSDs are dependent on the conditions that formed them (Eberl et al., 2001).
Titanite
Titanite is a common accessory mineral in many plutonic rocks, comprising up to 1 wt% of the whole rock (Gromet and Silver, 1983; Bateman and Chappell, 1979). Titanite can be used as a geothermometer (e.g. Cherniak, 2006) and thermobarometer (e.g. Hayden et al., 2008) by measuring Zr diffusion zoning. Titanite incorporates significant quantities of U, Th, rare earth elements (REE), and high field strength elements into its lattice. U incorporation makes titanite useful for U-Pb dating (e.g. Samperton et al., 2015).
In silicic granitoids, titanite is euhedral and is relatively large (up to 1 cm) compared to other accessory minerals (e.g. Glazner et al., 2008; Coleman et al., 2012). These characteristics are classically interpreted as a sign that titanite formed early during crystallization, permitted by unimpeded growth in high melt fractions. However, titanite is also interpreted as late
crystallizing (i.e., when uneruptible melt fractions, <50 %, are present) based on the lack of volcanic rocks with U-shaped REE patterns formed due to titanite’s affinity for middle REEs (Colombini et al., 2011). Comparing REEs in titanite to residual melts could elucidate the relationship between felsic volcanic and plutonic rocks and has major implications for how high-silica rhyolites relate to plutonic roots in crustal igneous systems (Bachmann and Bergantz, 2008; Glazner et al., 2008).
Timing of titanite formation in silicic magmas thus remains enigmatic. Complex
oscillatory and sector zoning further complicate the uncertain growth history of titanite (Paterson and Stephens, 1992; Bauer, 2015). Titanite’s typical euhedral form contradicts chemical
7
crystal morphology (e.g., Wu et al., 2016). Thus, titanite is well-suited for investigations of thermal cycling effects on crystal growth and texture.
One-atmosphere experiments
In the following two lines of experimentation at 1-atm, titanite crystals were monitored for changes in size and shape during thermal cycling:
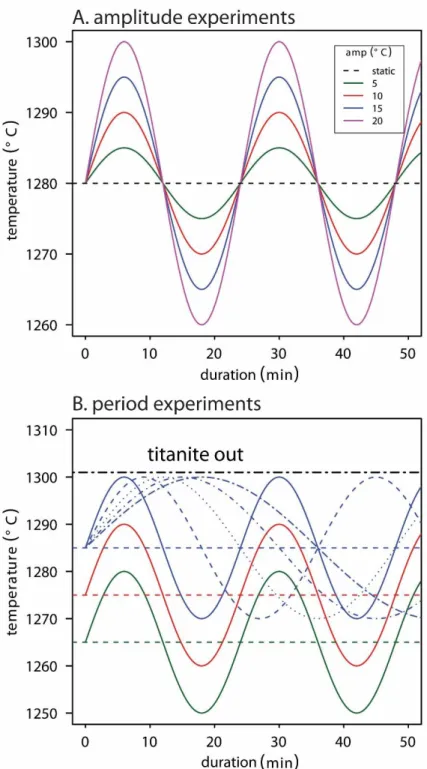
1) Experiments held at constant mean temperature (T) and period (τ) while amplitude (α) was varied 5-20 °C (Fig. 3a; Table 1). Varied-amplitude experiments are compared to static experiments at time intervals from 2 to 120-h (Fig. 3a).
2) Experiments held at constant time (t) and amplitude while the period was varied 24-72 minutes at three T that are 10°C apart (Fig. 3b; Table 1). The highest T thermal cycle brings the maximum temperature (up-T portion of cycle) within 1°C of the
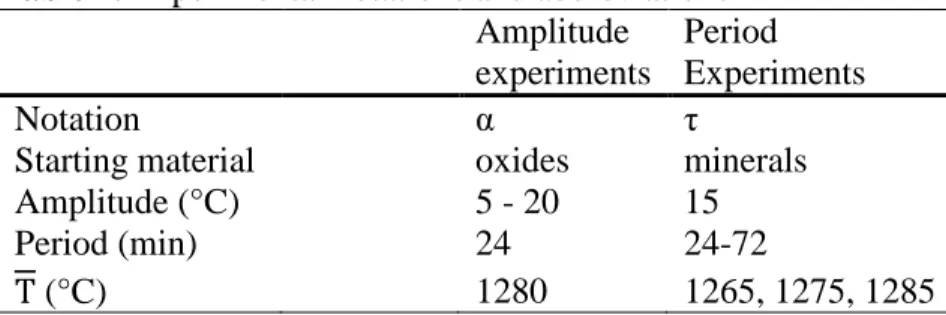
experimentally determined liquidus (Fig. 3b). Table 1. Experimental notations and abbreviations
Amplitude experiments
Period Experiments
Notation α τ
Starting material oxides minerals
Amplitude (°C) 5 - 20 15
Period (min) 24 24-72
8
9 METHODS
Starting materials
Starting materials were chosen for the titanite-albite system because albite has a relatively low melting point (1105°C) compared to titanite (1380°C), allowing titanite crystals to
crystallize at relatively low temperatures (Fig. 4). Prince (1943) outlined this eutectic-like pseudo-binary system in which titanite crystals are stable below 1300°C at 50 wt% of each component (ttn50ab50; Fig. 4). Experiments were run at ttn50ab50 and T 1280°C to ensure the stability of titanite and ample melt fractions to ease kinetic restraints on crystallization.
10
The liquidus for ttn50ab50 of synthetic and natural starting materials was determined experimentally at 1312°C, 12°C higher than reported by Prince (1943) (Fig 4.). Ttn75ab25 and ttn25ab75 compositions were tested and both were about 12°C higher than the published liquidus temperatures (Fig. 4). Prince (1943) used similar starting materials, but fused the oxides into glass multiple times, powdering between each fusion to ensure homogenization. Most of his run times for liquidus experiments were short, typically only 30 minutes. With using such
homogenized glasses, spontaneous nucleation (homogeneous nucleation), which is slower than nucleation onto pre-existing crystals (heterogeneous nucleation) (Kirkpatrick, 1977) is likely the primary formation mechanism of titanite. Sluggish nucleation combined with some degree of undercooling and short run times could have suppressed Prince’s liquidus. However, differences in liquidus temperatures did not affect the experiments because of the broad titanite stability field and all experiments were performed under 1300°C, the lowest reported liquidus for ttn50ab50.
Amplitude experiments
Starting material was synthesized mixed from pure oxide and carbonate powders according to the following reaction:
7 SiO2 + Na2CO3 + Al2O3 + TiO2 + CaCO3 =
2 NaAlSi3O8 (albite) + CaTiSiO5 (titanite) + 2 CO2 (1)
11
Period experiments
Pegmatitic, clear-green titanite from the Delicias Pegmatite Mine, Ensenada, Baja California, Mexico and albite from the Morefield Mine, Virginia (Amelia Albite; Appendix 1) were crushed in a Shatterbox ceramic ring and puck mill for 10 minutes. Powders were mixed to ttn44ab56 and fused into glass 80°C above the experimentally determined system liquidus
(1300±1°C) for two hours. 10 % titanite was left out in order to add titanite fragments (referred to as ‘seeds’) to the glass later. After the ttn44ab56 glass was re-powdered, 10 % seeds were mixed in by mortar and pestle, bringing the composition to ttn50ab50. Titanite seeds are the same
composition as titanite in the glass and sieved to < 54 µm length through a cloth mesh in order to control the initial maximum size. Seeds measured from two images contain 1542 crystals and have a median eigenlength (square root of the area) of 0.0042 mm (Fig. 5).
12 Experimental procedure
The starting material was mixed with distilled water and glue binder solution, which was then dried in a hemispherical Teflon cup onto 0.13 mm Pt wire loops ~ 4 mm in diameter, referred to as charges hereafter. Charges were then hung from two Pt hooks, 1 cm away from a type-S Pt/PtRh10 thermocouple calibrated against the melting point of Au (1064°C). Experiments were performed in the hotspot of a Deltech 1-atm, gas mixing vertical tube furnace. Charges were exposed to air where Fe oxidation or Fe loss to Pt were assumed negligible due to the scarcity of Fe in starting materials and its assumed unimportance to titanite growth in the pure ttn50ab50 system. Charges were quenched in water by electrically fusing the suspension wires. Quench crystallization is typically displayed by acicular crystals and skeletal crystal formation (e.g. Wyllie et al., 1962) and observations of this phenomenon in charges were rare. Therefore, crystal growth during quenching is assumed negligible.
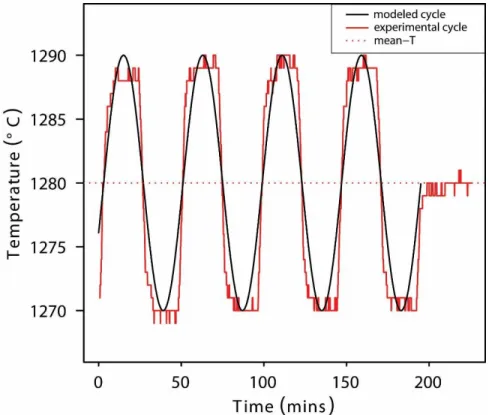
Temperature cycling was controlled via a programmable Eurotherm 3504 controller and temperatures were logged every 5 seconds. Cycles were programmed as ramp and dwell
13
Figure 6. T-t path of a typical observed experimental cycle shown in red. The programmed cycle is parsed between rate and dwell periods. The modeled experimental cycle is the black line. Mean temperature (T) is shown red dashed line.
Crystal measurement and analysis
14
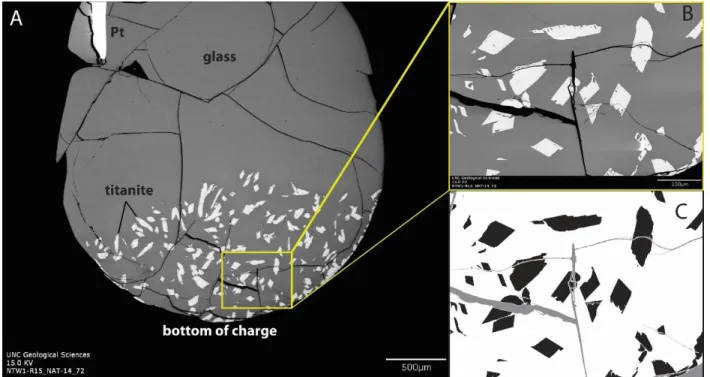
Figure 7. a) Backscattered electron image of a charge (NAT-14). Crystals are concentrated near the bottom of the charge at T 1285°C. b) Titanite crystals (white) in an albitic glass (gray). Void spaces such as quench cracks and vesicles are subtracted by processing in imageJ and c) converted to binary images where crystals are measured.
Touching crystals were separated with a watershed tool in imageJ where crystals were too numerous to split manually. The watershed program requires binary images to find the centers of the regions and then uses a dilation function to find where regions first touch, drawing a boundary along that line. This technique works best with rounded regions. Where volumetric number densities exceeded ~1 x 106 mm-3 especially in short, low-amplitude runs, titanite had a higher degree of rounding. The images were then touched up manually to correct any single crystals that were severed by the watershed function. There is a degree of subjectivity when cutting crystals but this method is sufficient because the number of ambiguous situations is small compared to the number of crystals analyzed (Mills and Glazner, 2013).
15
Glazner (2013) and Blundy and Cashman (2008). These are used to calculate the characteristic length (SN) for each batch of crystals using:
SN = (ɸ/NA)0.5 (mm) (2)
NA can be extrapolated to NV, the number per unit volume, based on intersection probabilities (Underwood, 1970) using:
NV = NA/SN = NA/(ɸ/NA)0.5 (mm-3) (3)
Crystal batch growth rate (Gbatch) was determined by dividing SN by time (Eq. 4) (Hammer and Rutherford, 2002; Blundy and Cashman, 2008; Mills and Glazner, 2013). In period experiments, SN of titanite seeds was subtracted from each experimental SN to observe minimum growth rates; this term is zero for unseeded runs.
Gbatch= (SN–SNseed)/t (mm/s) (4)
Maximum growth rates were calculated following Mills and Glazner (2013) by using the median eigenlength of the 10 (10A0.5max) and 50 (50A0.5max) largest crystals for each experimental condition (Eq. 5, 6). Median values were favored over means because they are less sensitive to anomalously large crystals (Mills and Glazner, 2013) and means are highly dependent on the number of crystals measured (Higgins, 2006).
10Gmax = 10A
max
0.5 /t (mm/s) (5)
50Gmax = 50A
max
0.5 /t (mm/s) (6)
16
17 RESULTS
Qualitative crystal textures
Synthetic oxide starting materials yielded small, interconnected networks of titanite in an albite-rich glass (Fig 8). A very short run (15 min) was performed to observe how the oxides produced the two phases before they reached thermal equilibrium. Quartz was seen as a rare, anhedral phase that was larger than already well-established titanite crystals. Experiments longer than 2 hours had no quartz, and titanite morphology became increasingly euhedral with
18
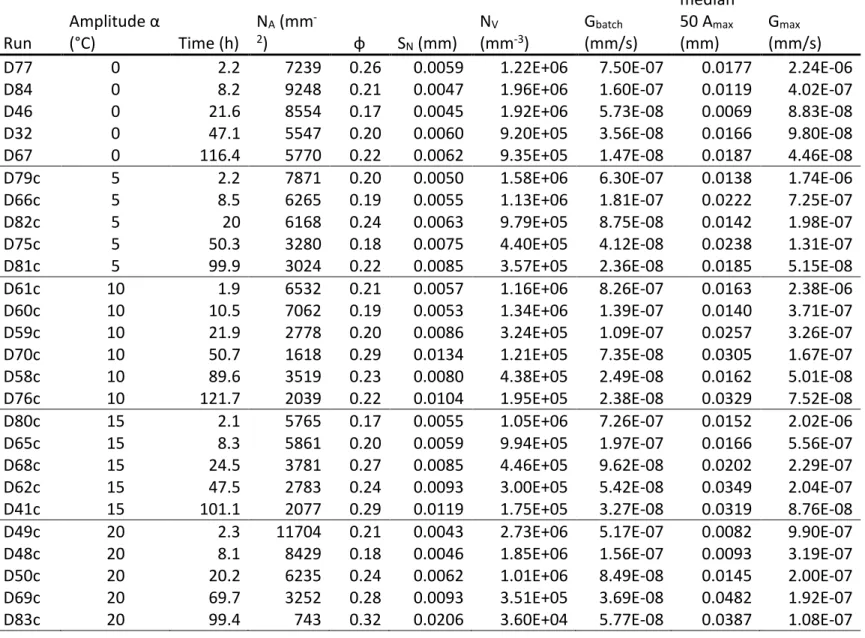
Table 2. Amplitude experiments data
Run
Amplitude α
(°C) Time (h)
NA (mm
-2) φ S
N (mm) NV (mm-3)
Gbatch (mm/s)
median 50 Amax (mm)
Gmax (mm/s) D77 0 2.2 7239 0.26 0.0059 1.22E+06 7.50E-07 0.0177 2.24E-06 D84 0 8.2 9248 0.21 0.0047 1.96E+06 1.60E-07 0.0119 4.02E-07 D46 0 21.6 8554 0.17 0.0045 1.92E+06 5.73E-08 0.0069 8.83E-08 D32 0 47.1 5547 0.20 0.0060 9.20E+05 3.56E-08 0.0166 9.80E-08 D67 0 116.4 5770 0.22 0.0062 9.35E+05 1.47E-08 0.0187 4.46E-08 D79c 5 2.2 7871 0.20 0.0050 1.58E+06 6.30E-07 0.0138 1.74E-06 D66c 5 8.5 6265 0.19 0.0055 1.13E+06 1.81E-07 0.0222 7.25E-07 D82c 5 20 6168 0.24 0.0063 9.79E+05 8.75E-08 0.0142 1.98E-07 D75c 5 50.3 3280 0.18 0.0075 4.40E+05 4.12E-08 0.0238 1.31E-07 D81c 5 99.9 3024 0.22 0.0085 3.57E+05 2.36E-08 0.0185 5.15E-08 D61c 10 1.9 6532 0.21 0.0057 1.16E+06 8.26E-07 0.0163 2.38E-06 D60c 10 10.5 7062 0.19 0.0053 1.34E+06 1.39E-07 0.0140 3.71E-07 D59c 10 21.9 2778 0.20 0.0086 3.24E+05 1.09E-07 0.0257 3.26E-07 D70c 10 50.7 1618 0.29 0.0134 1.21E+05 7.35E-08 0.0305 1.67E-07 D58c 10 89.6 3519 0.23 0.0080 4.38E+05 2.49E-08 0.0162 5.01E-08 D76c 10 121.7 2039 0.22 0.0104 1.95E+05 2.38E-08 0.0329 7.52E-08 D80c 15 2.1 5765 0.17 0.0055 1.05E+06 7.26E-07 0.0152 2.02E-06 D65c 15 8.3 5861 0.20 0.0059 9.94E+05 1.97E-07 0.0166 5.56E-07 D68c 15 24.5 3781 0.27 0.0085 4.46E+05 9.62E-08 0.0202 2.29E-07 D62c 15 47.5 2783 0.24 0.0093 3.00E+05 5.42E-08 0.0349 2.04E-07 D41c 15 101.1 2077 0.29 0.0119 1.75E+05 3.27E-08 0.0319 8.76E-08 D49c 20 2.3 11704 0.21 0.0043 2.73E+06 5.17E-07 0.0082 9.90E-07 D48c 20 8.1 8429 0.18 0.0046 1.85E+06 1.56E-07 0.0093 3.19E-07 D50c 20 20.2 6235 0.24 0.0062 1.01E+06 8.49E-08 0.0145 2.00E-07 D69c 20 69.7 3252 0.28 0.0093 3.51E+05 3.69E-08 0.0482 1.92E-07 D83c 20 99.4 743 0.32 0.0206 3.60E+04 5.77E-08 0.0387 1.08E-07
20
Period experiments (natural starting materials) contained subhedral to euhedral titanite in an albitic glass. There are more vesicles in static runs than in cycled runs (Fig. 9). Titanite crystals, especially at the high T of 1285°C, only occupied the bottom of the charge (Fig. 7a) and in some cases had skeletal crystals in the transition from the top of the charge (crystal poor) to the bottom (crystal rich). Crystals in cycled runs are larger and more euhedral than in static runs (Fig. 9).
Table 3. Period experiments data
Run Period (min) Cycle (#) 𝑇 (°C) NA (mm-2)
SN (mm)
NV (mm-3)
Gbatch (mm/s) Median 10 A0.5 max (mm) Median 50 A0.5 max (mm) 10G max (mm/s) 50G max (mm/s) NAT-23 0 0 1265 1829 0.0095 1.93E+05 1.47E-08 0.0425 0.0301 7.36E-08 6.01E-08 NAT-15 24 125 1265 555 0.0194 2.86E+04 6.97E-08 0.0523 0.0357 1.75E-07 1.47E-07 NAT-16 48 63 1265 911 0.0155 5.86E+04 4.84E-08 0.0469 0.0388 1.49E-07 1.28E-07 NAT-17 72 42 1265 879 0.0161 5.47E+04 5.13E-08 0.0551 0.0378 1.8E-07 1.18E-07 NAT-22 0 0 1275 2343 0.0088 2.66E+05 1.09E-08 0.0562 0.0374 9.41E-08 6.46E-08 NAT-5 24 125 1275 416 0.0215 1.94E+04 8.13E-08 0.0523 0.0358 1.49E-07 9.61E-08 NAT-6 36 83 1275 558 0.0195 2.87E+04 7.01E-08 0.0373 0.0319 1.18E-07 1.13E-07 NAT-7 48 63 1275 330 0.0237 1.39E+04 9.35E-08 0.0719 0.0547 1.64E-07 1.08E-07 NAT-8 60 50 1275 348 0.0235 1.48E+04 9.27E-08 0.0670 0.0478 1.7E-07 1.05E-07 NAT-9 72 42 1275 864 0.0146 5.91E+04 4.33E-08 0.0686 0.0465 1.49E-07 9.62E-08 NAT-21 0 0 1285 3341 0.0079 4.21E+05 6.01E-09 0.0614 0.0428 6.52E-08 7.49E-08 NAT-20 24 125 1285 266 0.0281 9.47E+03 1.18E-07 0.0625 0.0410 2.58E-07 2.02E-07 NAT-11 36 83 1285 276 0.0299 9.23E+03 1.28E-07 0.0388 0.0293 2.3E-07 1.63E-07 NAT-12 48 63 1285 462 0.0219 2.11E+04 8.37E-08 0.0570 0.0449 2.39E-07 1.56E-07 NAT-13 60 50 1285 175 0.0329 5.32E+03 1.45E-07 0.0524 0.0415 1.99E-07 1.35E-07 NAT-14 72 42 1285 119 0.0368 3.24E+03 1.66E-07 0.0580 0.0397 2.06E-07 1.25E-07
2
22 Crystal number densities
23
24
25 Titanite growth rates
For each amplitude investigated, Gbatch growth rates decrease with time (Fig. 12). Growth rates calculated from SN are on the order of 10-6 mm/s (Fig. 10b) which are greater than the amplitude Gbatch estimates of 10-7 mm/s (Fig. 12). Amplitude experiments Gbatch rates are 4 times greater for 2-h durations (Fig. 12) but Gbatch rates for longer durations show little increase with amplitude.
Figure 12. Gbatch rates versus amplitude, separated by approximate experiment durations (hours). Growth rates decrease by a factor of four from 2 to 8 hours.
Gbatch rates for period experiments show T 1285°C rates that are larger than the
26
Figure 13. a) Growth rates of the largest 10 crystals (10Gmax) and b) 50 crystals (50Gmax) for T’s plotted against both number of cycles and period. Boxplots show the median distributions for the c) largest 10 (10A
max
0.5 ) and d) 50 (50A
max
0.5 ) eigenlengths. Outlier points fall outside the upper quartile.
Volume estimates and CSDs in τ experiments
27
(> 5 x 10⁻⁴ mm3) that are greater than the largest crystals measured for T 1265°C and 1275°C (Fig 14a, b, c).
28
Figure 14. Volume estimates of Amax for T’s a) 1265°C and b) 1275°C, and c) 1285°C with inset CSDs for the 50 largest crystals. Seeds are dashed lines. CSDs truncate at low crystal sizes because sizes smaller than 5 µm2 were not measured. With the total crystal volume constant in period experiments, mass
29
30 DISCUSSION
Crystal destruction
Static T
In amplitude experiments, the overall decrease in NV with time is consistent with little or no crystal nucleation (Zieg and Lofgren, 2006; Mills et al., 2011; Mills and Glazner, 2013). Mills and Glazner (2013) used a basaltic starting material in which crystals fully equilibrated with the liquid phase in the first 20-h of experimentation. Rapid decrease in NV in the first hour for their experiments was likely accelerated by high concentrations of crystal dislocations from crushing the sample close to its comminution limit (Glazner and Mills, 2012). However, our starting material was mixed from synthetic oxides with no existing titanite crystals, so it is not likely to share this problem. It is more likely that titanite and liquid are concurrently forming from the oxides with rapid increase in temperature. Titanite forming from oxides heterogeneously nucleates on pre-existing sites while observed melt pockets could be left by dissolving
metastable quartz grains. SiO2 dissolution is a rate-limiting diffusive component (e.g. Watson, 1982) and could be the last metastable oxide to dissolve before equilibrium temperatures are reached. This would leave no nucleation sites for titanite to grow initially where quartz is dissolving, creating high-silica melt pockets. Later, titanite could nucleate in these melt pockets where they have more space to grow larger than the areas of densely packed crystals (Fig. 8, static at 100-h and α 10°C at 100-h).
31
likely aids in the destruction of crystals past 20-h (Cabane et al., 2005; Mills and Glazner, 2013). Composition and melt viscosity strongly affect Ostwald ripening, and the rate of crystal
destruction is controlled by growth/dissolution kinetics at solid-liquid interfaces (Cabane et al. 2005). Cabane et al. (2005) found a rate decrease for NV of -2.3 x 103 mm-3h-1 for plagioclase in an andesite at 1-atm. Mills and Glazner (2013) found a rate for plagioclase in basalt of -7.6 x 103 mm-3h-1, suggesting that the increased rate in the basalt experiments was related to lower
viscosity of the melt. NV destruction rates for titanite are not directly comparable because they ran at hotter temperatures than the andesite and basalt (130 and 30°C respectively). However, because the magnitudes of the rate decrease for NV are similar, the controls for static coarsening are likely similar.
Amplitude and period
NV for amplitude experiments decreases at a rate of about -8.8 x 104 mm-3s-1 in the first 20-h and significantly flattens with longer durations (Fig. 10a). Sluggish crystal destruction over 50-h is likely due to the smallest crystals attaining sizes large enough to survive complete
32
Period does not affect NV significantly (Fig. 11a). NV for period experiments slightly decreases with decreasing period for T’s 1265°C and 1275°C by a maximum of 30 mm-3 but is not a significant amount when compared to the number of crystals measured (Table 2). There is no control on NV by the degree of undercooling, or the distance of the T from the liquidus. However, it should be noted that NV for period experiments is largely restricted by the initial titanite seeds added to the starting material.
Temperature cycling effects on growth rate
Comparing growth rates
Gbatch rates for amplitude experiments (Fig. 12) decrease with time and are dependent on NA because the proportion of crystals throughout the experiments is held constant (mean Φ = 0.23, σ1 = 0.06) (Eq. 2, 3). Amplitude Gbatch rates at ~2-h are greater than longer-duration experiments by a factor of 4 (Fig. 12) likely due to high nucleation rates and formation from the oxides. Nucleation, although often viewed separately from growth, requires an interval of growth to be observed (Kirkpatrick, 1977; Higgins, 2006). The typical observation for nucleation is that it occurs over a short period of time at a high degree of supersaturation (Lasaga, 1998; Eberl et al., 2002). Gbatch rates better represent nucleation rates because of the dependence on the population density and are unrepresentative of maximum growth rates. Linear growth rates calculated from the characteristic size (SN) (Fig. 10b) are better estimates of growth associated with amplitude.
33
when the period is 60 or 72 min are about 1 x 10⁻⁷ mm/s greater that the others due to low amounts of crystals measured (Table 2).
Growth effects of amplitude
Growth rates estimated from SN (Fig. 10b) values increase by a factor of 10 from 5°C to 20°C amplitude and this increase is the primary control of thermal cycling effects on crystal coarsening (Mills and Glazner, 2013). Crystal coarsening is dependent on the amount of crystal solute available from dissolution during the up-T cycle and crystallization on the down-T cycle (Mills and Glazner, 2013). Crystals are coarsened by the integrated effects of size dependent growth (Eberl et al. 2002), and growth dispersion (Girolami and Rousseau, 1985). Growth dispersion, or the variable growth of similar-sized crystals, effectively displaces crystals to oversized bins. These two phenomena are difficult to separate, but act together to grow large crystals faster than smaller ones (Mills and Glazner, 2013).
34 Figure 15. Boxplots of the largest 50 crystal eigenlengths (50A
max
0.5 ) for all amplitudes. Boxplots are
grouped to the durations of 2, 8, 20, 50 and 100-h.
Growth effects of period
50Gmax for period experiments increase with decreasing period but do not increase consistently with T (Fig. 13b). T 1265°C has greater 50Gmax rates than T 1275°C, but could be
explained by 50A0.5max (Fig. 13d). The maximum median distribution (Fig. 13d) of T 1275°C has a
15 µm larger range than T 1265°C. Thus, even though the median values are similar, the
distribution of sizes for T 1265°C has a narrower dispersion of growth. 10Gmax rates do not show
35
suggests that if thermal cycling passes within 10°C of the liquidus, crystals will be significantly coarsened. However, it is assumed that overstepping the liquidus will cause dissolution and subsequent destruction of all crystals present (Mills and Glazner, 2013).
Elevated Gbatch rates and lower NV for T 1285°C and 72 min period (Fig. 11) drastically reduce the amount of existing crystals due to long periods of dissolution at near liquidus temperatures (~1°C of undercooling). However, this does not occur in experiments with maximum temperatures (up-T cycle) 10°C below the liquidus (i.e. T 1265 and 1275°C). 50Gmax and 50A0.5max values for the same experiments are lower at lower amounts of cycles (Fig. 13b, d)
which suggests that unless a long enough time is spent at near-liquidus conditions, the number of cycles has more control on propagated crystal growth. Mills and Glazner (2013) also suggested that increased period could coarsen crystals by enhanced diffusion-controlled dissolution at near liquidus conditions.
Period is a function of frequency (τ = 1/F) and it does not seem to play a large role in coarsening titanite. Rather, an increase in the number of cycles relative to time increases overall crystal sizes (Fig. 13b). Mills and Glazner (2013) similarly found period effects to be of second order compared to amplitude. For example, if a crystal-melt system spends long periods of time at near-liquidus conditions, regardless of the period, crystallization on the down-T portion of the cycle is controlled dominantly by the degree of undercooling, or the amplitude of the cycle.
CSD modeling
36
(Fig. 1a), as groundmass crystals formed from initial cooling of the magma. However, the existence of small crystal sizes (<50 µm) resulting from cycling (Fig. 14), shows that prolonged cooling is not necessary to form steep sloped CSDs. Thus, it is reasonable that small groundmass crystals can form from dynamic cycling rather than steady state cooling. Furthermore, CSDs of the same character may be formed by different processes, making them non-unique.
Experiments held at high and low-T instead of at the T for 30 min prior to quenching, show considerable variation from each other after only 4 cycles (3.2-h) (Fig. 14d). Titanite precipitated and coarsened crystals during down-T crystallization at a rate of 19°C/h, raising overall crystal sizes. The high-T quench run has smaller crystal sizes owing to titanite
dissolution. Simakin and Bindeman (2008) theorized that cycling could coarsen populations after just one precipitation-dissolution event. However, at such short experiment durations, CSD slopes are not as shallow as the 50-h experiments (Fig. 14a, b, c), suggesting that repeated precipitation-dissolution events are important for developing mature textures.
37
batch thermal cycling will retain smaller sizes because of limitations on nucleation rates, crystal solute in the melt, the amount of oscillations, and the degree of undercooling.
Implications for titanite growth in igneous systems
Temperature oscillations within a magma body complicate classic igneous texture interpretations. For example, crystals that are large and well-formed (euhedral), were thought to form early in large melt fractions with a constant crystallization sequence (Bryon et al., 1995). Frost et al. (2000) suggested that igneous titanite crystallizes above its closure temperature of >700°C (Hayden et al., 2008). However, phase equilibria of titanite in silicic magmas are poorly understood and there are few quantitative constraints on its stability (Colombini et al., 2011; Glazner et al, 2008). Colombini et al. (2011) attributed the high abundance of titanite in the intermediate composition Searchlight pluton of southern Nevada to late-stage crystallization of titanite in highly silicic, evolved pockets of melt. Other studies of granitoids reveal histories of incremental emplacement based on pluton compositional zoning, thermochronologic data, and zircon dating (Coleman et al., 2004; Johnson and Glazner, 2010; Davis et al., 2012; Frazer et al., 2014). Repeated thermal oscillations with temperatures varying by at least 10°C and repeated buffering close to the titanite liquidus, could cause titanite trapped in melt pockets to mature into euhedral crystals (Coleman et al., 2012). Thermal cycling effects complicate crystal nucleation and growth with disequilibrium overprint of otherwise equilibrium conditions that can falsely represent crystallization conditions and final resting states. Mature igneous textures may not represent indiscriminant processes because crystal growth from thermal cycling satisfies other CSD coarsening models (e.g. Higgins, 1999).
38
39
CONCLUSIONS
Experiments involving disequilibrium environments such as thermal cycling are needed to understand the growth of crystals comprising igneous textures. We conclude from this study that:
1. Nucleation is suppressed during thermal cycles due to heterogeneous nucleation on existing crystals. Gbatch values are highly dependent on the density of a crystal population and should be considered an evaluation of nucleation rate.
2. Growth effects of thermal cycling in homogeneous batch crystal-melt systems are predominantly controlled by the amplitude of the cycle.
3. Repeated thermal oscillations increase crystal size and growth rate but the length of period does not directly affect crystal growth. However, if sufficiently long periods and near-liquidus temperatures are achieved, crystal populations will consist of a small number of large crystals.
4. CSDs created from different processes can have similar qualities, complicating classic interpretations of textures. Textural analysis continues to evolve but interpretation of CSDs may confuse processes leading to misinterpretations of natural mature igneous textures.
40
APPENDIX A: COMPOSITION OF NATURAL STARTING MATERIALS
oxide
Albite: Morefield Mine, Virginia
Titanite: Delicias Mine,
Ensenada, Baja California
Na2O 10.71 0
MgO 0.07 0.1
Al2O3 20.74 0.98
SiO2 66.72 31.06
P2O5 -0.04 0.12
K2O 0.8 0.06
CaO 0.93 28.9
TiO2 0.02 37.39
MnO 0.005 0.057
Fe2O3 0.03 0.94
total 99.98 99.61
41
REFERENCES
Bachmann, O., & Bergantz, G. W. (2008). Rhyolites and their source mushes across tectonic settings. Journal of Petrology, 49(12), 2277–2285.
Bateman, P., & Chappell, B. (1979). Crystallization, fractionation , and solidification of the Intrusive Series , Yosemite National Park , California. Geological Society of America Bulletin, 90, 465–482.
Bauer, J. (2015). Complex zoning patterns and rare earth element variations across titanite crystals from the Half Dome Granodiorite, Central Sierra Nevada, California. [Master’s
Thesis]: University of North Carolina, Chapel Hill, 76.
Blundy, J., & Cashman, K. (2008). Petrologic reconstruction of magmatic system variables and processes. Reviews in Mineralogy and Geochemistry, 69(1), 179–239.
Bryon, D. N., Atherton, M., & Hunter, R. (1995). The interpretation of granitic textures from serial thin sectioning, image analysis and three-dimensional reconstruction. Mineralogical Magazine, 59(395), 203–211.
Cabane, H., Laporte, D., & Provost, A. (2001). Experimental investigation of the kinetics of Ostwald ripening of quartz in silicic melts. Contributions to Mineralogy and Petrology,
142(3), 361–373.
Cabane, H., Laporte, D., & Provost, A. (2005). An experimental study of Ostwald ripening of olivine and plagioclase in silicate melts: Implications for the growth and size of crystals in magmas. Contributions to Mineralogy and Petrology, 150(1), 37–53.
Carmichael, I. S., Turner, F. J., & Verhoogen, J. (1974). Igneous petrology. McGraw-Hill, 739. Cashman, K. V., & Marsh, B. D. (1988). Crystal size distribution (CSD) in rocks and the kinetics
and dynamics of crystallisation. Contributions to Mineralogy and Petrology, 99, 292–305. Cherniak, D. J. (2006). Zr diffusion in titanite. Contributions to Mineralogy and Petrology,
152(5), 639–647.
Coleman, D. S., Bartley, J. M., Glazner, A. F., & Pardue, M. J. (2012). Is chemical zonation in plutonic rocks driven by changes in source magma composition or shallow-crustal
differentiation ?, (6), 1568–1587.
Coleman, D. S., Gray, W., & Glazner, A. F. (2004). Rethinking the emplacement and evolution of zoned plutons: Geochronologic evidence for incremental assembly of the Tuolumne Intrusive Suite, California. Geology, 32(5), 433–436.
42
Elemental partitioning, phase relations, and influence on evolution of silicic magma.
Mineralogy and Petrology, 102(1-4), 29–50.
Davis, J. W., Coleman, D. S., Gracely, J. T., Gaschnig, R., & Stearns, M. (2012). Magma accumulation rates and thermal histories of plutons of the Sierra Nevada batholith, CA.
Contributions to Mineralogy and Petrology, 163(3), 449–465.
Donaldson, C. H. (1976). An experimental investigation of olivine morphology. Contributions to Mineralogy and Petrology, 57(2), 187–213.
Donhowe, D. P., & Hartel, R. W. (1996). Recrystallization of ice in ice cream during controlled accelerated storage. International Dairy Journal, 6(11), 1191–1208.
Eberl, D. D., Drits, V. a, & Srodon, J. (2001). User’s Guide to Galoper: A Program for Simulating the Shapes of Crystal Size Distributions from Growth Mechanisms and Associated Programs. U.S. Geological Survey Open-File Report OF00-505, 1–44.
Eberl, D., Kile, D., & Drits, V. (2002). On geological interpretations of crystal size distributions: Constant vs. proportionate growth. American Mineralogist, 87, 1235–1241.
Erdman, M., & Koepke, J. (2016). Experimental temperature cycling as a powerful tool to enlarge melt pools and crystals at magma storage conditions, American Mineralogist, 101, 960–969.
Frazer, R. E., Coleman, D. S., & Mills, R. (2014). Zircon U-Pb geochronology of the Mount Givens Granodiorite: Implications for the genesis of large volumes of eruptible magma.
Journal of Geophysical Research: Solid Earth, 119, 2907–2924.
Frost, B. R., Chamberlain, K. R., & Schumacher, J. C. (2001). Sphene (titanite): Phase relations and role as a geochronometer. Chemical Geology, 172(1-2), 131–148.
Girolami, M. W., & Rousseau, R. W. (1985). Size--Dependent Crystal Growth-A Manifestation of Growth Rate Dispersion in the Potassium Alum--Water System. AIChE Journal, 31(11), 1821–1828.
Glazner, a. F., & Mills, R. D. (2012). Interpreting two-dimensional cuts through broken geologic objects: Fractal and non-fractal size distributions. Geosphere, 8(4), 902–914.
Glazner, A. F., Coleman, D. S., & Bartley, J. M. (2008). The tenuous connection between high-silica rhyolites and granodiorite plutons. Geology, 36(2), 183.
Glazner, A. F., & Johnson, B. R. (2013). Late crystallization of K-feldspar and the paradox of megacrystic granites. Contributions to Mineralogy and Petrology, 166(3), 777–799. Hammer, J. E., & Rutherford, M. J. (2002). An experimental study of the kinetics of
43
107(B1).
Harper, B. E., Miller, C. F., Koteas, G. C., Gates, N. L., Wiebe, R. A., Lazzareschi, D. S., & Cribb, J. W. (2004). Granites , dynamic magma chamber processes and pluton construction : the Aztec Wash pluton, Eldorado Mountains, Nevada, USA. Transactions of the Royal Society of Edinburgh: Earth Sciences,95, 277–295.
Hayden, L. A., Watson, E. B., & Wark, D. A. (2008). A thermobarometer for sphene (titanite).
Contributions to Mineralogy and Petrology, 155(4), 529–540.
Hersum, T. G., & Marsh, B. D. (2007). Igneous textures: On the kinetics behind the words.
Elements, 3(4), 247–252.
Higgins, M. D. (1998). Origin of Anorthosite by Textural Coarsening: Quantitative
Measurements of a Natural Sequence of Textural Development. Journal of Petrology,
39(7), 1307–1323.
Higgins, M. D. (2000). Measurement of crystal size distributions. American Mineralogist, 85, 1105–1116.
Higgins, M. D. (2002). A crystal size-distribution study of the Kiglapait layered mafic intrusion , Labrador, Canada: evidence for textural coarsening. Contributions to Mineralogy and Petrology, 144, 314–330.
Higgins, M. D. (2006). Quantitative textural measurements in igneous and metamorphic petrology. Cambridge University Press.
Higgins, M. D. (2011). Quantitative petrological evidence for the origin of K-feldspar megacrysts in dacites from Taapaca volcano, Chile. Contributions to Mineralogy and Petrology, 162(4), 709–723.
Higgins, M. D., & Roberge, J. (2003). Crystal Size Distribution of Plagioclase and Amphibole from Soufriere Hills Volcano, Montserrat: Evidence for Dynamic Crystallization-Textural Coarsening Cycles. Journal of Petrology, 44(8), 1401–1411.
Hintzmann, W., & Müller-Vogt., G. (1969). Crystal growth and lattice parameters of rare-earth doped yttrium phosphate, arsenate and vanadate prepared by the oscillating temperature flux technique. Journal of Crystal Growth, 5, 274–278.
Huppert, H. E., & Sparks, R. S. J. (1988). The Generation of Granitic Magmas by Intrusion of Basalt into Continental Crust. Journal of Petrology, 29(3), 599–624.
Jerram, D. A., & Davidson, J. P. (2007). Frontiers in textural and microgeochemical analysis.
Elements, 3, 235–238.
44
plutons by thermal cycling and late-stage textural coarsening. Contributions to Mineralogy and Petrology, 159(5), 599–619.
Kirkpatrick, J. R. (1977). Nucleation and growth of plagioclase, Makaopuhi and Alae lava lakes, Kilauea Volcano, Hawaii. Geological Society of America Bulletin, (88), 78-84.
Lasaga, A. C. (1998). Reaction Kinetics in Geoscience. Princeton University Press, Princeton. Lofgren, G. (1974). An experimental study of plagioclase crystal morphology: isothermal
crystallization. American Journal of Science, 274(3), 243–273.
Lofgren, G. E. (1980). Experimental studies on the dynamic crystallization of silicate melts, in
Hargraves, R.B., ed., Physics of Magmatic Processes: Princeton, N.J., Princeton University Press, p. 487-551.
Loomis, T. P. (1982). Numerical simulations of crystallization processes of plagioclase in complex melts: the origin of major and oscillatory zoning in plagioclase. Contributions to Mineralogy and Petrology, 81(3), 219–229.
Marsh, B. (1998). On the interpretation of crystal size distributions in magmatic systems.
Journal of Petrology, 39(4), 553–599.
Marsh, B. D. (1988). Crystal size distribution (CSD) in rocks and the kinetics and dynamics of crystallisation. Contributions to Mineralogy and Petrology, 99, 277–291.
Mills, R. D., Ratner, J. J., & Glazner, a. F. (2011). Experimental evidence for crystal coarsening and fabric development during temperature cycling. Geology, 39(12), 1139–1142.
Mills, R., & Glazner, A. (2013). Experimental study on the effects of temperature cycling on coarsening of plagioclase and olivine in an alkali basalt. Contributions to Mineralogy and Petrology, 166(1), 97–111.
Morgan, D. J., & Jerram, D. A. (2006). On estimating crystal shape for crystal size distribution analysis. Journal of Volcanology and Geothermal Research, 154(1-2), 1–7.
Nemchin, A. A., Giannini, L. M., Bodorkos, S., & Oliver, N. H. S. (2001). Ostwald ripening as a possible mechanism for zircon overgrowth formation during anatexis: Theoretical
constraints, a numerical model, and its application to pelitic migmatites of the tickalara metamorphics, Northwestern Australia. Geochimica et Cosmochimica Acta, 65(16), 2771– 2787.
Paque, J. M., Lofgren, G. E., & Le, L. (2000). Crystallization of calcium-aluminium-rich inclusions: Experimental studies on the effects of repeated heating events. Meteoritics & Planetary Sciences, 35, 363–371.
45
implications for accessory-phase/melt partitioning of trace elements. Contributions to Mineralogy and Petrology, 109(3), 373–385.
Peter Gromet, L., & Silver, L. T. (1983). Rare earth element distributions among minerals in a granodiorite and their petrogenetic implications. Geochimica et Cosmochimica Acta, 47(5), 925–939.
Pupier, E., Duchene, S., & Toplis, M. J. (2008). Experimental quantification of plagioclase crystal size distribution during cooling of a basaltic liquid. Contributions to Mineralogy and Petrology, 155(5), 555–570.
Samperton, K. M., Schoene, B., Cottle, J. M., Keller, C. B., Crowley, J. L., Schmitz, M. D. (2015). Magma emplacement, differentiation and cooling in the middle crust: Integrated zircon geochronological–geochemical constraints from the Bergell Intrusion, Central Alps.
Chemical Geology, 417, 322-340.
Scheel, H. J., & Elwell, D. (1972). Stable growth rates and temperature programming in flux growth. Journal of Crystal Growth, 12, 153–161.
Schiavi, F., Walte, N., & Keppler, H. (2009). First in situ observation of crystallization processes in a basaltic-andesitic melt with the moissanite cell. Geology, 37(11), 963–966.
Underwood, E. E. (1970). Quantitative stereology. Addison-Wesley, Massechussetts.
Verhoogen, J. (1962). Distribution of titanium between silicates and oxides in igneous rocks.
American Journal of Science, 260, 211–220.
Voorhees, P. W. (1985). The theory of Ostwald ripening. Journal of Statistical Physics, 38(1-2), 231–252.
Watson, E.B. (1982). Basalt contamination by continental crust: Some experiments and models.
Contributions to Mineralogy and Petrology. (80), 73-87.
Wu, Z., Yang, S., & Wu, W. (2016). Application of temperature cycling for crystal quality control during crystallization. CrystEngComm.
Wyllie, P. J., Cox, K. G., & Biggar, G. M. (1962). The habit of apatite in synthetic systems and igneous rocks. Journal of Petrology, 3(2), 238–243.