Reducing the Proportion of Children Living in Poverty in Dauphin County, Pennsylvania A Program Plan Using Agile Strategy and Collective Impact
By Victoria Pless
A Master’s Paper submitted to the faculty of the University of North Carolina at Chapel Hill in partial fulfillment of the requirements for the degree of Master of Public Health in
the Public Health Leadership Program
Chapel Hill Spring 2019
DATE
iii ABSTRACT
Reducing the Proportion of Children Living in Poverty in Dauphin County, Pennsylvania A Program Plan Using Agile Strategy and Collective Impact
(Under the direction of Karine Dubé, DrPH)
Child poverty (defined as the percentage of children younger than age 18 who live in households below the poverty threshold) is a problem in the United States (America’s Health Rankings, 2019b) that causes many health concerns beginning in childhood that can continue into adulthood. Children living in poverty is also an issue in Dauphin County, Pennsylvania where the state capital is located. Public, faith and nonprofit organizations work to develop programming that can be used to support efforts to mitigate child poverty through means such as strategic planning which can be an effective strategy to mitigate health and social issues.
iv
ACKNOWLEDGEMENTS
I would like to take the time to thank those who assisted me throughout this process. First to my first and second readers, Karine Dubé, DrPH, and Vaughn Mamlin Upshaw, EdD, DrPH. Your expertise, advice, and time was greatly appreciated from determining an appropriate topic through the final draft of this paper. Both perspectives that you provided to the process were above and beyond what I anticipated, and I am grateful for your input. Additionally, you have both supported me in personal and professional ways throughout my degree and it will not go forgotten. Thank you for everything.
v
TABLE OF CONTENTS
LIST OF TABLES ... viii
LIST OF FIGURES ... ix
LIST OF ABBREVIATIONS...x
Introduction ...1
What is poverty and how is it measured? ...2
Poverty and its Effect on Health ...6
Determinants of Health and Screening in Children ...6
Outcomes ...8
Housing and Built Environment ... 11
Food Insecurity ... 13
How to Mitigate Poverty ... 13
Pennsylvania ... 17
Demographics ... 17
Health of General Pennsylvania Residents ... 17
Health of Women and Children in Pennsylvania ... 19
Dauphin County, Pennsylvania... 21
vi
Health of Dauphin County, Pennsylvania Residents ... 21
Status of Children in Dauphin County, Pennsylvania ... 23
Programming Focused on Child Poverty in Dauphin County ... 24
Strategic Planning can Solve Problems ... 26
Strategic Plans Related to Health, Well-Being, and Poverty Mitigation ... 26
How to Improve Strategic Planning ... 28
Agile Strategy ... 29
What is Agile Strategy? ... 29
An Example of Agile Strategy ... 30
Where Agile Strategy has been Successful ... 31
Collective Impact ... 34
What is Collective Impact? ... 34
An Example of Collective Impact ... 37
Where Collective Impact has been Successful... 38
Combining Agile Strategy and Collective Impact ... 41
Process Evaluation for Agile Strategy and Collective Impact ... 43
Recommendations and Conclusions ... 46
Appendices ... 47
Appendix A: FPL Guidelines for 2019 ... 47
vii
Appendix C: 10 Rules of Strategic Doing ... 50
Appendix D: Questions for RBA ... 51
Appendix E: Combination Tool for Agile Strategy and Collective Impact ... 53
Appendix F: Combination Tool for Agile Strategy and Collective Impact Example ... 54
Appendix G: Eleven Components of Process Evaluation ... 55
viii
LIST OF TABLES
Table 1: Percentage of United States Population in Poverty Based on Race, 2017………3
Table 2: Respondent-assessed health status, by selected characteristics, United States, selected years 1991-2009………...7
Table 3: Pennsylvania health indicators – Challenges………...18
Table 4: Pennsylvania health indicators – Strengths……….18
Table 5: Pennsylvania women and children health indicators – Challenges……….19
Table 6: Pennsylvania women and children health indicators – Successes………...20
Table 7: Dauphin County, Pennsylvania health indicators – Challenges………..22
Table 8: Dauphin County, Pennsylvania health indicators – Successes………22
Table 9: Five Conditions for Collective Success………...34
Table 10: Collective Impact Questions………..36
ix
LIST OF FIGURES
x
LIST OF ABBREVIATIONS
AAPCCP American Academy of Pediatrics Council on Community Pediatrics ACEs Adverse Childhood Experiences
AHR America’s Health Rankings
CAAP Community Action Association of Pennsylvania CDC Centers for Disease Control and Prevention CHIP Children’s Health Insurance Program CHR County Health Rankings
CMS Centers for Medicare & Medicaid EITC Earned Income Tax Credit
FPL Federal Poverty Line KFF Kaiser Family Foundation
MCCP Mayor’s Commission to Combat Poverty MVC Motor Vehicle Collisions
NCES National Center for Education Statistics NCHS National Center for Health Statistics OMB Office of Management and Business
PADEP Pennsylvania Department of Environmental Protection PADHS Pennsylvania Department of Human Services
PADOH Pennsylvania Department of Health PPC Pennsylvania Partnerships for Children RBA Results-Based Accountability
xi SDGs Sustainable Development Goals
SECCS State Early Childhood Comprehensive System SNAP Supplemental Nutrition Assistance Program SPM Supplementary Poverty Measure
SSA Social Security Administration SSI Social Security Income
SToE Straight Talk on Evidence
TANF Temporary Assistance for Needy Families TCCA Tri-County Community Action
UN United Nations
UNESCO United Nations Education, Science, and Cultural Organization UPMC University of Pittsburgh Medical Center
USCB United States Census Bureau
USCBAFF United States Census Bureau American Fact Finder USDA United States Department of Agriculture
1 Introduction
Child poverty is a problem in the United States and specifically for the children in
Dauphin County, Pennsylvania. Child poverty can contribute to a variety of health problems both in childhood (Duncan, Magnuson, & Votruba-Drzal, 2017) and throughout the life course
(Chaudry & Wimer, 2016). Assuming communities want to reduce child poverty and there are resources to address it, strategic planning has been frequently used as a process to align goals. However, newer methods for strategic planning in public health differ from the traditional ones by incorporating shorter time horizons, flexible activities, and organizational as well as
population-based outcomes. New strategic planning and metric-based measuring protocols include agile strategy (Agile Strategy Lab, 2019) and collective impact (Friedman, 2001). These processes promote creativity, flexibility, and broad-based collaborations, along with evidence-based programming, to make meaningful change. Combining these processes offers an
opportunity for a new strategic planning approach. The addition of a process evaluation protocol helps to create a data-driven method focused largely on efficiency and sustainability. The
2
What is poverty and how is it measured?
Poverty is a major international concern, even in developed countries like the United States, and should be measured. Poverty can be defined in a variety of ways, but at its core the measurement of poverty aims to calculate the resources that a family or individual has and can use to meet basic needs such as food, shelter, clothing, and general expendable income
(UNESCO, 2017). The United States Census Bureau (USCB) (August 2018) “uses a set of money income thresholds that vary by family size and composition to determine who is in poverty. If a family's total income is less than the family's threshold, then that family and every individual in it is considered in poverty.” Poverty contributes to a variety of aspects of life, including health and general well-being, which is why understanding its impact on the population is so important.
3
There are significant disparities between demographic groups regarding poverty. For example, households with higher income levels are associated with lower levels of poverty. The same can be said for households with higher education levels (Wimer, Nam, Waldfogel, Fox, 2016). Additionally, there are differences between racial and ethnic groups (KFF, 2019) (see Table 1).
Table 1: Percentage of United States Population in Poverty Based on Race, 2017
Race % FPL, 2017
White 8%
Black 20%
Hispanic 16%
Asian/Native Hawaiian and Pacific Islander 9%
American Indian/Alaskan Native 22%
Multiple Races 13%
Hardships should also be considered when we measure poverty. Hardships can include income poverty, material hardships (a family’s ability to meet basic needs), and adult health outcomes (Nerckman, et al., 2016). These can be discussed more specifically as: financial (lack of money), bills (utilities being shut off due to lack of payment), food insecurity, unmet medical need, and housing; and family health (whether the adult answering the survey had self-reported poor health or a work-limiting disability). Even those who are not poor report having at least one disadvantage, with material hardship being the most common (Nerckman, et al., 2016).
4
Fox, 2016). This amount spent on food was tripled and determined to be a poverty threshold (Blank, 2008), creating the federal poverty line (FPL). For 2019, the FPL for varying family types can be found in Appendix A. The practice of tripling only the amount of food spent to create the FPL is still largely the practice today, despite growing costs in areas such as
healthcare, housing, and other areas such as utilities Also, any change to the definition of poverty used by the USCB must be approved by the White House. Potential change to the way poverty is measured have been considered, and proposals regarding process changes include:
• giving authority to a statistical agency to restructure the poverty measurement;
• including a coherent poverty threshold as well as a consistent resource measure;
• allowing programs to use the Office of Management and Business (OMB)-based poverty measure for eligibility purposes unless they determine they would like to change to a new measure; and
• developing a list of measures related to economic disadvantage outside of income poverty (Blank, 2008).
5
• Children’s Health Insurance Program (CHIP) (PADHS, 2017),
• Medicaid (Benefits.gov, n.d.),
• Medical assistance (PADHS, 2019a),
• Rental help (USHUD, n.d.(a)),
• Section 8 housing (USHUD, n.d.(b)),
• SNAP (PADHS, 2019b),
• Social Security Income (SSI) (SSA, 2019), and
• Temporary Assistance for Needy Families (TANF) (PADHS, 2019c).
6
Poverty and its Effect on Health
Measuring poverty is important for a variety reasons, including distributing social benefits and determining who is in need. Measuring poverty is also important in understanding its effects on the population, such as economic plight and health. Poverty has been shown to be associated with a variety of health problems and conditions. Particularly for children, where poverty beginning at a young age can have long-term health effects that persist long after childhood.
For example, developmental processes in children who live in poverty can be inhibited. Poorer kindergarten students start behind their more affluent classmates. Poverty affects where a student goes to school, the family environment they live in, and more (Duncan, Magnuson, & Votruba-Drzal, 2017). Those who are in minority groups experience higher rates of poverty, are more likely to be arrested, and have poorer health outcomes (Chaudry & Wimer, 2016). There are a variety of hardships and disadvantages that coincide with being in poverty that can affect a person’s health status such as housing issues, income disparities, and food insecurity.
Determinants of Health and Screening in Children
Approximately 20% of children live in poverty (and about 43% live below 200% FPL) (Chung, et al., 2016). Poverty is a profound determinant of health that can affect health outcomes and behaviors in children throughout their lives. The American Academy of Pediatrics Council on Community Pediatrics (AAPCCP) (2016) reported on a variety of the issues that children living in poverty face. Language development, chronic illness, injury, and infant mortality have been associated with poverty; delays in executive function and self-regulation have been
7
respondents who reported poor or fair health in the United States between 1991 and 2009, based on poverty status, adapted from the National Center for Health Statistics (NCHS, 2011).
Table 2: Respondent-assessed health status, by selected characteristics, United States, selected years 1991-2009
[Data are based on household interviews of a sample of the civilian noninstitutionalized population]
Characteristic 1991 1995 1997 2000 2005 2007 2008 2009
Below 100% ... 22.8 23.7 20.8 19.6 20.4 21.0 21.8 21.8
100%–199% ... 14.7 15.5 13.9 14.1 14.4 15.3 15.4 14.9
200%–399% ... 7.9 7.9 8.2 8.4 8.3 9.0 8.7 8.6
400% or more ... 4.9 4.7 4.1 4.5 4.7 4.7 4.4 4.3
Hispanic or Latino:
Below 100%... 23.6 22.7 19.9 18.7 20.2 21.0 21.0 22.1
100%–199%... 18.0 16.9 13.5 15.3 15.3 15.1 14.6 16.2
200%–399%... 10.3 10.1 10.0 10.3 10.3 10.5 10.7 9.7
400% or more ... 6.6 4.0 5.7 5.5 7.6 7.2 5.6 5.6
White only:
Below 100% ... 21.9 22.8 19.7 18.8 20.1 20.9 22.1 20.5
100%–199% ... 14.0 14.8 13.3 13.4 13.8 15.2 15.7 14.6
200%–399% ... 7.5 7.3 7.7 7.9 7.9 8.4 8.3 8.1
400% or more ... 4.7 4.6 3.9 4.2 4.3 4.3 4.1 4.0
Black or African American only:
Below 100% ... 25.8 27.7 25.3 23.8 23.3 22.6 25.1 25.2
100%–199% ... 17.0 19.3 19.2 18.2 17.6 17.7 18.1 16.6
200%–399% ... 12.0 11.4 12.2 11.7 11.2 11.3 11.2 11.0
400% or more ... 5.9 6.5 6.1 7.3 7.1 7.2 6.9 5.9
8
To address determinants of health, screening tools are needed that consider a variety of factors, and these tools should be specifically tailored for the communities in which healthcare providers serve. For example, a tool that is utilized in a neighborhood in Chicago may ask different questions regarding violence or work trends than a tool used in rural Pennsylvania. Instruments used to screen for determinants of health can also be used to screen for serious concerns (such as child abuse). Chung, et al. (2016) recommend the development of screening tools that are relevant to the child’s developmental age, can be used at intake for new families, and eventually, incorporated into a broad and global tool.
Outcomes Infant Mortality
The United States has one of the highest infant mortality rates in the developed world. For term birth deaths (deaths that happen at 37 weeks gestation or after), this is particularly true. Term birth deaths are influenced by a variety of factors such as housing conditions, nutrition, social services, access to healthcare, and infant sleep environment (Mohamoud, Kirby, & Ehrenthal, 2019). In the study population of the NCHS, the rate of term birth deaths was 2.1 per 1,000; in counties with higher poverty, the rate was nearly doubled.
Biological Development
Poverty affects human development. In low-income mothers, poverty can affect
9
compared to those who were not at risk of poverty. After two years, children who were born at a lower risk of poverty were still taller than those who had been born at a higher risk of poverty (Van Rossem & Pannecoucke, 2019). Further, specific areas of brain development may be adversely affected for children growing up in poverty, such as reduced development in the frontal lobe, temporal lobe, and hippocampus (Hair, Hanson, Wolfe & Pollak, 2015).
Cortisol Levels
Cortisol levels can affect biological development and stress in children. Children who live in poverty may experience more stress than their affluent counterparts. Because of this, children in these environments may develop higher levels of cortisol than those who do not live in poverty. In children who had spent a longer time living in poverty, salivary cortisol levels were higher from baseline to follow-up (Blair, et al., 2013).
Cancer
10 Child Maltreatment
Child maltreatment is a prevalent issue in the United States and those that are youngest are often at a higher risk (Farrell, et al., 2017). Individual income is a risk factor for child maltreatment and abuse. An analysis of Counties of the United States from the Centers for Disease Control and Prevention (CDC) Compressed Mortality Files show that in counties with higher rates of poverty (≥20%), risk of death due to child abuse was higher – at a rate of 9.6 deaths per 100,000 children – compared with counties that had lower rates of poverty. Another type of child maltreatment that affects health and well-being are Adverse Child Experiences (ACEs). In children of Black and Latinx households, higher numbers of ACEs (at 1.43 and 1.34 average ACEs, respectively) were experienced compared to whites (at 0.94 average ACEs). Additionally, Black and Latinx populations reported more kinds of ACEs (such as death, income adversity, and drug use) compared to Whites (Liu, Kia-Keating & Nylund-Gibson, 2018).
Unintentional Injury Deaths
Unintentional injury is one of the leading causes of death in the United States. While individual factors are often considered with unintentional injury, community-level area disadvantages are largely not included in determining an individual’s injury risk. Karb,
11
counties to 79% higher. This suggests children living in counties with higher poverty rates are at an increased risk of unintentional injury.
Suicide
In more impoverished schools, rates of attempted suicide among teenaged boys are higher than in less impoverished schools (Fang, 2018). Further, rates of suicide in the United States continue to rise in rural and urban areas (Carriere, Marshall, & Binkley, 2018) and economic factors have been shown to contribute to suicidal behavior in adulthood. After the Great Recession of 2008, enormous economic strain fell over the United States. In areas where there were higher levels of poverty and unemployment, there were correlations with higher numbers of total suicides. While economic indicators specifically for women did not appear to have a profound association on suicide, for men, unemployment and poverty contribute
significantly (p < 0.01) to suicide (Carriere, Marshall, & Binkley, 2018).
Housing and Built Environment
Housing and rental prices continue to increase, and as wages stagnate, continuous housing is a concern for lower-income families. Within low-income communities, eviction occurs more frequently due to factors such as nonpayment of rent (Lundberg & Donnelly, 2018). Children in low-income families are at risk of eviction. Between 1998 and 2000, about one in seven children between the ages of 0 to 15 years had been evicted. Rates of eviction were higher in Black and Hispanic populations compared to Whites.
12
birthweight and lead poisoning has prompted discussion of inequalities related to health caused by poverty. By mapping incidences of low birthweight and lead poisoning, an overlay produced showed lower birthweights located in the same areas as higher levels of lead poisoning (Krieger, et al., 2003).
In children, asthma is one of the most common childhood illnesses (Teixeira & Zuberi, 2018), with around 8% of children in the United States affected. Overlapping neighborhood stressors may exacerbate this issue in low-income children. Children in low-income areas may experience safety, social cohesion, and neighborhood disorder issues, which have been further associated with asthma.
Those who live in poverty are also at a higher risk of becoming obese. Families who may have problems paying for high-cost housing may decide to use food expenses to make up the difference and may need to resort to fast food restaurants or other forms of food that are less nutritious. Additionally, they may have less space for physical activity. Living in a severe housing-cost burden household was associated with increased risk of obesity (Nobari, et al., 2019).
Poor eating behavior in children has been considered an intermediary between poor sleep and developing obesity. For children growing up in poverty, there is a higher risk of obesity as well as risk of experiencing sleep disturbances (loud noises, stress) contributing to poorer sleep. Parents reported overeating in children with sleep disturbances. Less nocturnal sleep duration was associated with increased eating in the absence of hunger (Miller, et al., 2019).
There are many Black mothers raising children in low-income and violent areas
13
maternal illnesses and maternal deaths compared to white women. Despite legislation and common beliefs, the United States is still largely segregated – racially and socioeconomically – exacerbating these issues. New programming provides opportunities for those in Section 8 public housing to move to higher-income areas. One such program is the Moving to Opportunity
program. While this program assists families to move from a more impoverished area, there still may be discriminatory practices (such as housing discrimination) that follow them to higher-income areas (Osypuk, et al., 2017). Additionally, there may be negative effects on mental health.
Food Insecurity
In 2017, approximately 12% of all United States homes were food insecure, and food insecurity is tied to economic hardship (USDA, 2018). When children are food insecure, they face a lack of nutrition for proper development (Balistreri, 2017). The USDA (2018) notes that single-parent households experience the highest rates of food insecurity. In analyses run
regarding income and household structure (married, single, etc.), married biological households had the lowest prevalence of food insecurity while single-mother households had the highest prevalence of food insecurity. For single mothers, this was true regardless of maternal income and household characteristics.
How to Mitigate Poverty
14 Tax credits
Tax credits can provide income to those who may have lower income levels. However, these only come at one time during the year and financial hardships do not necessarily occur at once. Further, some tax credits (such as the Earned Income Tax Credit (EITC)), are only provided to those who work (Shaefer, et al., 2018). Cash assistance has been shown to have benefit even in small amounts. Proposed legislation of a monthly universal child payment would increase monies available to families, especially those with young children, providing support during times of diminished employment (McAuliffe & McElwee, 2018).
Medicaid Expansion
With healthcare reaching approximately 18% of gross domestic product in the United States in 2017 (CMS, 2018), out-of-pocket costs can to push millions of Americas into poverty (Zewde & Wimer, 2019). Medicaid covers approximately one-half of all births in the United States and provides access to healthcare services to vulnerable people. Medicaid expansion has been shown to improve health outcomes such as state infant mortality rates (Bhatt & Beck-Sagué, 2017), depression diagnoses in patients with chronic conditions (Winkelman & Chang, 2017), and physical health (Cross-Call, 2018), and may also have protective factors for financial stability. Nearly 700,000 people were pulled out of poverty in states that expanded Medicaid by 2016, (concentrated in the nonelderly expansion population) (Zewde & Wimer, 2019).
Education
15
children in various capacities, their goals related to child readiness for school and child health are in alignment. Collaborations could be created to ensure that children are assisted in these areas (Peterson, Loeb, & Chamberlain, 2018). The United States experiences low intergenerational economic mobility, and some explanations include innate ability, investment in early education, and attaining a college education. Those who are minorities are less likely to have access to education (Darling-Hammond, 1998); and despite progress being made in some educational areas such as high school completion rates and post-secondary enrollment, disparities exist (NCES, 2017). Figures 1 and 2 display differences in various education outcomes by race and ethnicity.
16
Figure 1: High School status completion rates of 18 to 24-year-olds, by race/ethnicity: 1990 through 2015
17 Pennsylvania
Demographics
Pennsylvania is the sixth most populous state in the country (KFF, 2018). The total population (estimated in July 2018) was just under 13 million people. The state is largely rural, with most of the population living in the metropolitan areas. The state is approximately 50% female. Racial backgrounds include: White (82.1%), Black (11.9%), Hispanic (7.3%), Asian (3.6%), and American Indian, Alaska native (0.4%), Approximately 63% of those at or over the age of 16 were working between 2013 and 2017 (USCB, 2018b). The state has 67 counties and health outcomes and behaviors differ within and between them (CHR, 2018a).
Health of General Pennsylvania Residents
18 Table 3: Pennsylvania health indicators – Challenges
Health Indicator (Definition) Pennsylvania Value (Rank) Number One Value
Air Pollution (micrograms of fine particles per cubic meter)
9.7
(48) 4.5
Premature Death (years lost before age 75 per 100,000
population)
8,013
(33) 5,653
Immunizations – Children (% of children aged 19 to 35
months)
70.4
(26) 82.1
Public Health Funding (dollars per person)
$55
(44) $281
Drug Deaths (deaths per 100,000 population)
28.1
(46) 6.8
Cancer Deaths (deaths per 100,000 population)
200.3
(35) 150.4
Source: AHR Annual Report, 2018.
Table 4: Pennsylvania health indicators – Strengths
Health Indicator (Definition) Pennsylvania Value (Rank) Number One Value
Occupational Fatalities (deaths per 100,000 workers)
4.0
(11) 2.5
Primary Care Physicians (number per 100,000
population)
208.7
(5) 264.5
Physical Inactivity (% of adults)
24.9
(17) 19.2
Uninsured (% of population) 5.6
(11) 2.7
Disparity in Health Status (% difference by high school
education)
22.2
(7) 13.1
Immunizations – Adolescents (mean z score of HPV, meningococcal and Tdap)
0.613
(10) 1.518
19 Health of Women and Children in Pennsylvania
Approximately 5.5% of the Pennsylvania population includes children under the age of five, and nearly 21% of the population is under age 18 (USCB, 2018b). The health of women is ranked 18th in Pennsylvania compared to the remaining 50 states; the health of children is ranked 10th and infant health is ranked 43rd (AHR, 2016). Select health indicators of women and
children for Pennsylvania are compared in Tables 5 and 6.
Table 5: Pennsylvania women and children health indicators – Challenges
Health Indicator (Definition) Pennsylvania Value (Rank) Number One Value
Smoking (% of women, 18-44) 22.7
(36) 8.2
Intimate Partner Violence – Lifetime (% of women)
37.7
(35) 25.3
Drug Deaths (deaths per 100,000 females, 15-44)
19.1
(44) 4.2
Alcohol During Pregnancy (% of pregnant women, 18-44)
14.1
(42) 2.2
Infant Mortality (deaths in infants aged < 1 year)
6.9
(35) 4.2
Homeless Family Households (number per 10,000 households)
7.2
(38) 2.1
Missed School Days (% of children aged 6-17 missing 11+ days)
7.0
(32) 3.6
20
Table 6: Pennsylvania women and children health indicators – Successes
Health Indicator (Definition) Pennsylvania Value (Rank) Number One Value
Dedicated Health Care Provider (% of women, 18-44)
81.7
(8) 86.9
Food Insecurity (% of households) 11.3
(6) 8.4
Well-Baby Check (% of babies) 92.9
(17) 96.8
Overweight of Obese (% of children, 10-17)
26.5
(8) 22.1
Adequate Health Insurance (% of insured children, 0-17)
80.9
(3) 81.9
Teen Suicide 7.2
(10) 5.0
21
Dauphin County, Pennsylvania
Demographics
Dauphin County, Pennsylvania is located near the middle of the state. This is where the state capital of Harrisburg is located. The total population (estimated July 2017) is approximately 275,000 with a slight majority of the population being women. The racial breakdown of the county is: White (72.4%), Black (19.1%), Hispanic (9.2%), Asian (4.7%), and American Indian or Alaska Native (0.4%). Those in Dauphin county who have obtained a high school degree or higher at age 25 or older make up almost 90% of the population (this is lower than the general population of the entire state). The median household income is $57,071 (USCB, 2018a).
Health of Dauphin County, Pennsylvania Residents
22
Table 7: Dauphin County, Pennsylvania health indicators – Challenges Health Indicator (Definition) Dauphin County
Value
Pennsylvania Value
Sexually Transmitted Infections (Number of newly diagnosed chlamydia cases per 100,000
population)
605.6 418.1
HIV Prevalence (Number of persons aged 13 years and older living with a diagnosis of
human immunodeficiency virus (HIV) infection per 100,000 population)
383 314
Children in Single-Parent Households (% of children that live in a household headed by
single parent)
41 34
Violent Crime (Number of reported violent
crime offenses per 100,000 population) 436 333
Teen Births (Number of births per 1,000
female population, 15-19) 31 21
Source: CHR, 2018b.
Table 8: Dauphin County, Pennsylvania health indicators – Successes
Health Indicator (Definition) Dauphin County Value Pennsylvania Value
Access to Exercise Opportunities (% of population with adequate access to locations
for physical activity)
73% 68%
Drug Overdose Deaths (Number of drug
poisoning deaths per 100,000 population) 23 28
Mammography Screening (% of female Medicare enrollees ages 67-69 that receive
mammography screening)
60 65
Unemployment (% of population ages 16 and
older unemployed but seeking work) 4.8% 5.4%
Injury Deaths (Number of deaths due to injury
per 100,000 population) 70 76
23 Status of Children in Dauphin County, Pennsylvania
Child poverty occurs at a rate of 18% in Dauphin County (CHR, 2018b). For Harrisburg directly, the poverty rate in 2014 was 31.2% (Auchey, 2014). While many children are enrolled in health insurance, there are approximately 2.5% of children who are still uninsured under the age of 18 (PPC, 2017). 3,700 children per month in Dauphin County receive subsidized child care, and around 6,000 children receive other in-home services. The total percentage of children in households with SSI, cash assistance income or SNAP/food stamp benefits is 28.5%. This percentage is much higher in single-parent households compared to married couple households; further, it is higher for female households without a husband compared to male households without a wife (USCBAFF, 2017). Child poverty also occurs at higher rates in single-parent homes compared to non-single-parent homes, and children who live in single-parents homes make up 41% of households (CHR, 2018b).
David Saunders of the Office of Health Equity in the Pennsylvania Department of Health (PADOH) indicated high unemployment, language barriers in immigrant populations, declining education levels, tobacco abuse, and infant and maternal mortality disparities as major issues within the county (Saunders, personal communication, January 2019). He also cites redlining practices and home loans that were not distributed uniformly after World War II that may have started the trajectory of these issues:
“…were given to returning vets for homes, allowing them to build wealth. Those loans were not given to residents in certain neighborhoods – black neighborhoods. Thereby, reducing wealth accumulation. Many Hbg. [Harrisburg] Residents are renting homes, rentals do not provide home taxes and thus do not contribute to the funding for the school district, decreasing the number of college graduates and skilled labor force.”
24
amounts of tax revenue available for public programs from most rental properties all contribute to child poverty in Dauphin County. Despite these entrenched issues, changes can be made.
Programming Focused on Child Poverty in Dauphin County
There are a variety of programs that exist in the county that focus on how to reduce this issue. Some are run by governmental agencies (state or local) and others by nonprofit entities. Some programs, such as those supported by the Tri-County Community Action (TCCA) (2019) focus on knowledge and skills for those in need to enhance understanding of intersectionality between social issues and health. Programs in Dauphin County focus on a wide variety of areas, include budgeting, parenting, financial literacy classes, and neighborhood revitalization.
Governmental programs represent a crucial source of support for families and children in poverty. Between 2009 and 2012, there were two million Pennsylvanians lifted out of poverty due to government assistance programs (CAAP, 2017). These include programs such as Medicaid, CHIP, SNAP, and the EITC. The local government office for the Department of Human Services houses the Children & Youth initiatives for Dauphin County. With two offices – one in Harrisburg and one in northern Dauphin County – the efforts are focused on child safety, permanency, and well-being (Dauphin County, 2017).
In addition to the programming through the local government of Dauphin County, there is opportunity to mitigate these issues through the state Office of Health Equity for the PADOH. Some key programs and partnerships include:
25
While programming efforts in Dauphin County include aspects of the state and local
26
Strategic Planning can Solve Problems
Strategic planning can be described in the following steps: assess current trends in the situation; analyze the strengths, weaknesses, opportunities, and threats; define a mission and vision; define goals; create and define department level objectives; and determine resource needs (Deeb, 2018). The process often includes working towards positive outcomes in a structured approach to ensure timelines, budgets, and efforts are followed according to agreed-upon terms. Strategic planning has been used in a variety of settings to ensure that plans are executed as designed, including business, government, and healthcare.
Further, strategic planning can be more robust if the following aspects are explicitly defined: an overarching vision that guides the plan; objectives and goals; collaborators and groups; metrics and evaluation protocols; and social acceptability. However, the process of strategic planning is hierarchical in nature and often consists of people at a higher level of power telling people at lower levels what needs to be accomplished. Then, it is up to individuals on the front line to ensure that the outlined goals are met. This process is not bi-directional in nature and does not often allow input from all parties that will be completing work, which can lead to
unsuccessful implementation and execution of strategic plans.
Strategic Plans Related to Health, Well-Being, and Poverty Mitigation
social-27
emotional development in preschool children (Green, et al., 2012), hospitals community health needs assessments (Penn State Health, 2015), state-level governmental policies to mitigate air pollution (PADEP, 2019), national think tanks in the United States (Center for American Progress, 2007), and Healthy People 2030 (DHHS, 2019).
One of the most well-known strategic plans related to health and well-being are the Sustainable Development Goals (SDGs) from the United Nations (UN) (n.d.). In the SDGs, there are 17 goals that make up the programming effort. Most of the programming focuses on
determinants of health that have been shown to lead to poor health outcomes. The first goal is to alleviate poverty in all forms everywhere by 2030 (UN, 2018), including child poverty. Within the plan, there are metrics described alongside activities that would be completed to mitigate this issue. This large international-level programming effort is one example of a strategic plan related to mitigating poverty.
28 How to Improve Strategic Planning
Strategic planning is an effective means to develop a plan to fix a problem. It can also overlook a variety of important factors and often is a confusing process (Kenny, 2018). It often leaves out vital input and feedback from individuals who will be actively completing the work. Second, the group who determines the plan often does not complete activities they have
assigned, creating distance between what may be possible and what is outlined in the plan. Third, strategic planning is often rigid in timelines and resources. This can lead to confusion of
responsibilities, ineffective use of resources, and strained relationships. By ensuring that these plans go further into detail regarding the use of networks and assets that are provided by key stakeholders, plans can be tailored and executed in a meaningful and sustainable way for the community.
In today’s world, technology, communication, and networks are changing to become wider and provide new ways of connecting and collaborating to solve problems. Therefore, as the world shifts, new means of strategic planning should be considered. Processes such as agile strategy and collective impact provide opportunity to use nimble approaches and solid metric-focused practices to create solutions to problems. These approaches are appropriate for
29 Agile Strategy
What is Agile Strategy?
As previous described, strategic planning can be an effective way to develop and execute a plan towards positive outcomes. The strategic planning process involves making assumptions. Some of these assumptions include: 1) the way people think and do are separate entities, 2) a strategic plan is linear and stable, 3) the strategic plan should continue without change once determined, and 4) all analyses happen before decisions are made and may not happen again (Morrison, 2013). As the world transitions into a more network-based environment, these assets will become more important for those in business, health, and other areas. Very few
organizations exist entirely in a silo and networks can be particularly important for regional markets. This is where agile strategy can be effective.
However, with a volatile and changing structure of the world, new strategic planning initiatives should be explored. Volatility occurs in the world and in organizations and when addressing volatility using social capital, planning and engagement with individuals can enhance relationships (Cohen & Prusak, 2001). Further, by developing collaborations that may involve a broad range of stakeholders (such as universities, nonprofits, and governmental officials) solutions to problems that may not seem obvious could be suggested and utilized (Gunasekara, 2005). This is an opportunity to use networks in a creative and innovative fashion.
30
strategic planning initiative) and Strategic Diversity (building broad networks with assets). The agile strategy process is often more transparent than traditional strategic planning, allows for incremental change, and provides a large-scale collaborative agreement throughout the process. Agile strategy can also be described as using improvisation in the short-term (to adjust as new challenges arise) while continuing to focus on the long-term objectives (Leberecht, 2016).
An Example of Agile Strategy
A specific process for agile strategy is Strategic Doing which comes from the Agile Strategy Lab at Purdue University. This is a process less focused on hierarchical structure and more on coalition building in open networks (Morrison, 2013). The focus is on answering two questions: “Where are we going?” and “How will we get there?”. By focusing on these main questions, specific assets, collaborations, and activities begin to show themselves. These two questions are further teased out in a manner that is more specific in content and objective to ensure effective and critical analysis of each step to stay on track towards the end goal. Four questions to guide the conversation and their purpose are outlined in Appendix B. These four questions make up the main parts to consider for Strategic Doing and creating network-based collaborations. Further, there are ten rules that make up these four questions. These are outlined in Appendix C.
31
happened in the last 30 days (what activities were completed, what did not get completed, challenges that arose, etc.) and what activities should be completed in the next 30 days based on this information. The discussion of what happened in the preceding 30 days allows for the group to see if adjustments should be made moving forward, thus creating a flexible process to
continue towards a goal. This process can continue and may transform, but the group still works towards the overall goals.
Where Agile Strategy has been Successful
Agile strategy has been used in multiple sectors to address problems in organizational structure and governance (Upshaw & Pless, 2018), software changes (Parker Gates, 2018), American foreign policy (Abshire, 1996), and various issues related to health. This agile approach was used where traditional strategic planning did not suffice due to broad network-based populations.
32
Following the two-day meeting, these four committees utilized the 30/30 process from Strategic Doing to inform and determine the activities their groups would complete. Since the initial inception of the committees, the following has occurred:
• The Webinar group held an organization-wide webinar on Strategic Doing and its applicability to APLIC;
• The Networking group held conversations on how to solicit connections and opportunities from the APLIC organization’s external relationships;
• The Meet-Up group planned and executed a tour of the United Nations library in New York City with a group lunch; and
• The Governance group held its fall Board meeting in October 2018 and had difficult conversations regarding whether APLIC should remain independent, become a part of another organization, or dissolve entirely. By the end of the meeting, the Board created their own subcommittees to work on future leadership programming and professional development after determining that APLIC would remain an independent organization (Upshaw & Pless, 2018).
After the Cold War, Abshire (1996) wrote about the importance of the United States moving strategically in an agile fashion in government, business, foreign policy, and security. His argument for using an agile strategy largely came out of a need to understand threats to American security. Abshire advocated for looking at the vital national interests for the United States and determined a process by which a new approach to foreign policy could begin.
The Agile Strategy Lab at Purdue coined the term Strategic Doing and led one of the first large-scale implementations of Strategic Doing in North Central Indiana (Hutcheson &
33
portion of the state, the grant writers focused on the process rather than specific initiatives. This opportunity provided the ability to develop programming, reevaluate progress throughout and at the end of the program based on evaluation, and gave an opportunity to promote
intergenerational sustainability.
34
Collective Impact
What is Collective Impact?
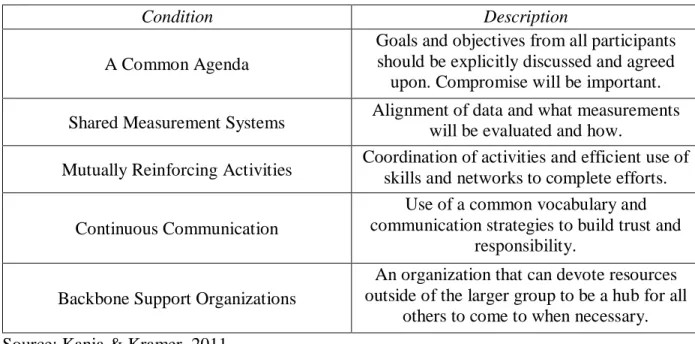
Collective impact is a framework developed to assure multiple programs, providers and stakeholders have common goals and shared metrics structure which can lead to sustainability (SToE, 2019). The framework works on a continuum to alleviate a social problem and changes the traditional work of nonprofits that may often fall into the trap of “isolated impact” (Kania & Kramer, 2011). There are five conditions to consider for collective success for, described in Table 9.
Table 9: Five Conditions for Collective Success
Condition Description
A Common Agenda
Goals and objectives from all participants should be explicitly discussed and agreed upon. Compromise will be important. Shared Measurement Systems Alignment of data and what measurements will be evaluated and how. Mutually Reinforcing Activities Coordination of activities and efficient use of skills and networks to complete efforts.
Continuous Communication
Use of a common vocabulary and communication strategies to build trust and
responsibility. Backbone Support Organizations
An organization that can devote resources outside of the larger group to be a hub for all
others to come to when necessary. Source: Kania & Kramer, 2011.
35
Short-term social program effects often fade, and the initial enthusiasm for short term effects can cloud the judgment of researchers and policymakers alike (SToE, 2019). Without recognizing this potential shortfall, the promise of a successful program in a community could be short-lived, prompting skepticism. Ensuring sustainable impact around shared interests can be accomplished by using strong metrics.
For programming related to communities, the focus should be on the results of a whole population (such as children or citizens) and use this as the starting point for the process
(Friedman, 2001). Results Based Accountability (RBA) is a collective impact approach designed to ensure accountability and effective results are sustainable. The four main components of RBA include: results (outcomes or goals); indicators (benchmarks); strategies (planned actions
36 Table 10: Collective Impact Questions
Question Elements Example
“What do we want?”
Consists of the defined population and the results
that would be desired for that population.
All children ready for kindergarten in Dauphin
County, Pennsylvania.
“How would we recognize it?”
Consists of baseline measures of the current population on explicitly defined indicators and specific experiences that would lead to results in the
community.
Not all children currently are at reading level for second grade. If we were to
see children reading at the second-grade level with good communication skills,
we would see impact.
“What will it take to get there?”
Consists of the story behind the baseline information,
including partners, determining what works for a community, criteria, and a strategic plan and budget.
The team will need to determine what the community identifies as the
most amenable barriers to ensuring children are ready
for kindergarten and who would be willing and able to
work on this problem. Source: Friedman, 2001.
Collective impact should be considered because goals such as “children being ready for kindergarten” will most likely be pertinent for years to come. Further, the collective impact framework is complete, even in its simplicity. By addressing key accountability issues from the community and based on outcomes, all levels of involvement are considered. Collective impact ensures that data are continuously collected and compared to baseline in a meaningful way that allows for adjustment to change potential sustainability outcomes. It also promotes creativity in traditional bureaucratic structures that can enhance outcomes. A framework example of
37 An Example of Collective Impact
As described in Table ##, there are conditions for collective strategy that increase the likelihood for success, and specific collective impact strategies, such as Results-Based
Accountability (RBA) are options to use. Communities can use RBA to mitigate problems in a disciplined manner (Wong, 2016) to benefit lives and programming efforts. Instead of working from the beginning, RBA starts at the end with the goals and works backwards to get to the means one step at a time, utilizing data and accountability principles (Friedman, 2001). Additionally, RBA focuses on surfacing challenges that could emerge and addresses those directly (Clear Impact LLC, 2016a). RBA follows a template called “Turn-the-Curve” made up of focused questions that are described in Appendix D. Four criteria related to “turning the curve” are outlined in Table 11 and can be compared to the conditions in Table 9.
Table 11: RBA “Turn-the-Curve” criteria
Criterion Definition
Leverage Resources are finite, and determining what root causes are most important and can cause the most impact is vital
Feasibility Reach; determine whether this approach is doable and create space to increase feasibility
Specificity
Determine the timeline that identifies who is involved and how, what people and groups will be doing and by when, and where it will occur;
this also may include a budget
Values How does this approach align or not with the values of the community or organization?
38
After the process has begun and continues to move forward, reassessment and evaluation will be crucial. Analyzing effects as well as quantity and quality of data is the crux of this process. The steps in Figure 3 can be effective in obtaining the goal determined by the group.
Figure 3: Steps for RBA Effectiveness
Sources: Clear Impact LLC, 2016a.
Where Collective Impact has been Successful
Collective impact has been successful related to social programming. First, it has been successful in the instance of afterschool programming (Surr, 2012). With the potential for new funding for afterschool programming came requests to ensure that afterschool program directors were producing measurable positive impact. Directors, schools, and programs began collecting so much information, not all pertaining to the goals that they had originally outlined for the funding. Funders began questioning this approach as it did not seem to align with their goals for providing a safe and engaging environment for students to develop outside of academics, and they asked afterschool program providers to change their approach. The groups used fewer rigid outcomes-based measurements and moved towards more subtle measurement, allowing for important self-assessment and explicit continuous improvement activities. This approach turned
1. Determine how much service was delivered
2. Determine how well it got done
3. Determine what quantity or quality of change for the better was produced, if any
39
the afterschool programming into a broad learning organization rather than an entity that only delivers services (Surr, 2012).
Children do not always have the same opportunities to learn and grow. However, by using early childhood comprehensive systems, Friedman (2004) explained the collective impact process through the specific questions and steps. The goal was: “To ensure that all young children enter school in good health, ready to learn, and are socially and emotionally well developed” and the population was the State Early Childhood Comprehensive System (SECCS) Initiative in California. Through this brief, Friedman shows the specific steps for collective impact related to this problem. Further, he creates an outline for specific activities, how to get people to work together, and creates a coherent strategy.
40
town’s poverty problem is different and plans to mitigate it should be specific to the area (Brooks, 2019).
RBA, specifically, has been used in a variety of organizations. The Vermont Department of Health worked to develop the Healthy Vermonters 2020 by utilizing the RBA framework along with the Clear Impact Scorecard. By using these initiatives, the department worked to identify key health status information as well as defining results the Department of Health wanted to achieve by 2020 (Clear Impact LLC, 2016b). Related to teen pregnancy in Tillamook County, Oregon, RBA was used by engaging with all kinds of representatives (faith leaders, local officials, healthcare groups) and use their perspectives to create a multidimensional solution to the problem (Implementation Guide, n.d.). Based on the successes of collective impact usage in a variety of health-related situations, use of collective impact should be
41
Combining Agile Strategy and Collective Impact
Employing a variety of strategies can lead to a full and successful programming experience surrounding poverty reduction. Current efforts are effective, but as the world continues to grow in technology use and innovation, new methods should be considered. By pairing agile strategy and collective impact, a group will be able to develop a coalition that is nimble and may span multiple networks. Agile strategy largely focuses on the assets and connections a group can make. Further, it focuses on the creative thinking processes that traditional strategic planning is less likely to engage in. Collective impact considers evidence-based ideas and a historic baseline of a situation to ensure effective use of metrics for
measurement to obtain a goal. The two practices both allow for flexibility in making changes sustainable and appropriate to the group and goal. By combining the two, a tool can be used to ensure that both processes are taken into consideration and can aid in formation and execution of a plan. For example, the tool may lead a group to focus on increasing the number of families who apply for and receive social benefits such as SNAP
The following steps outlined below taken from a combination of agile strategy and collective impact approaches should be considered when enrolling eligible individuals and families into SNAP. Further, an example of this idea in the form of a tool can be found in Appendix F.
1. Determine the population size (city, county, state, etc.);
2. Identify and begin engagement with stakeholders by brainstorming those who would be affected by programming as well as those who have a hand in planning and executing programming;
42
4. Ensure that all stakeholders agree on the same goal by appealing to their passions and knowledge of their community (Friedman, 2001);
5. Determine the baseline for enrollment of eligible SNAP beneficiaries; 6. Ask stakeholders to identify assets to reach the goal;
7. Leverage the assets in various combinations to come up with activities to work towards the goal;
8. Define a timeline for how often the group should meet and when the next meeting will be;
9. Divide the work among volunteering team members for the next meeting; and
10.Hold the next meeting, following the same structure as the previous meeting and build upon the work already completed.
43
Process Evaluation for Agile Strategy and Collective Impact
Evaluation is a critical part of any program or project plan. Without evaluation, it may be impossible to determine if the intended impact of the program was realized. Understanding what should be involved when conducting evaluation allows for important considerations to be undertaken. There are a variety of evaluation types, and there can be multiple methods used to evaluate each program. Such methods include outcome evaluation, utilization evaluation, and participatory evaluation. Further, qualitative and quantitative evaluation can be considered (Issel, 2018). To determine the best evaluation plan for the program, one must consider the following: what the client needs; what program theory will be used; what the budget, timeline, political, and data barriers may exist; and how the program can fit with the evaluation needs (Bamberger, 2006). Additionally, program evaluation should be discussed and outlined at the beginning of the program to ensure accountability.
Assumptions need to be made to create a program and evaluation protocol. These assumptions should be explicitly discussed and determined within the planning group, key stakeholders, and others that may be important to program implementation. Some of these assumptions include understanding aspects such as risk, ambiguity, uncertainty, and control (Issel, 2018). By thinking about these aspects, utility, feasibility, propriety, and accuracy are more likely to be incorporated appropriately.
44
beyond being considered a success or not. This evaluation type further explores key aspects of the program to understand implementation. This also allows for evaluation to take place at multiple times throughout the program to adjust as deemed necessary. When paired with other evaluation types, such as financial evaluation, a clearer picture can be seen of the program and how it worked (TSNE Mission Works, 2018).
Process evaluation focuses on “how much of the what, for whom, when, and by whom” of the program and eleven components can be considered as seen in Appendix G (Steckler & Linnan, 2002). Fidelity of a program can be realized by considering these eleven components. Fidelity focuses on understanding if the intervention was delivered as intended; otherwise described, evaluation of the quality and integrity of the intervention can be achieved. Data collection is a crucial component of this type of evaluation, and this can be achieved in a variety of methods. While quantitative data in terms of the number of services, length of services, number of services per participant and other numerical data are important, qualitative data also provide important insights. Therefore, activities such as surveys, interviews, and focus groups could be considered (SAMHSA, 2016).
Agile strategy and collective impact use a structure in which reevaluation is part of the protocol. For example, as groups work through their 30/30s in Strategic Doing, at each meeting they can examine what activities were completed and what is left to be done. From there, the group can determine if it is on the right track or if a change should be made. This is considered a process evaluation because the goal is to determine if resources and effort are being adequately allocated for implementation of a program or activity. It must be remembered that key
45
46
Recommendations and Conclusions
Poverty is a major challenge for children in the United States. Further, it is an issue for children in Dauphin County, Pennsylvania and deserves attention. The programming efforts that are being implemented in the county are a start to ensuring that sustainable change can be realized, but a more focused approach can be successful. We have explored strategic planning and its use in health and well-being programming. While strategic planning can be effective, in a world that appears to be changing for the foreseeable future, other methods should be considered. This is where agile strategy and collective impact can be used. By using the nimble structure of agile strategy paired with the evidence-based metrics and measurement protocols of collective impact, the two come together to produce an effective tool for communities with broad networks and challenging goals.
These two processes allow for groups to collaborate in a network-based manner to
strategically and creatively think about solutions to this problem. By engaging with stakeholders, leveraging assets of teams, evaluating the baseline and potential root causes of the problem, determining evidence-based programming, distributing the work, and following up with meetings and accountability, success can be accomplished. This approach is appropriate to ensure that small amounts of work are completed by those that volunteer and feel comfortable with team requests. Additionally, it builds upon the strengths and current trends of activities and other outside forces that can often influence programming initiatives.
47 Appendices
Appendix A: FPL Guidelines for 2019
Persons in Household Poverty Guideline
For families/households with more than 8 persons, add $4,420 for each additional person.
1 $12,490
2 $16,910
3 $21,330
4 $25,750
5 $30,170
6 $34,590
7 $39,010
48 Appendix B: Four Questions of Strategic Doing
1. “What could we do?”
a. Here the focus is on assets. This could be financial, physical, or skills that
individuals and groups have or do not have. These assets must also be voluntarily provided by group members.
b. Through observing and connecting assets, the conversation begins to focus on the varying options that could be possible with the connections and assets available. 2. “What should we do?”
a. This question focuses on honing into the specific goals of the network and requires decision-making to rank these based on the goals and vision. b. Implementing measurable outcomes is beneficial while engaging with the
network in the ways that they respond to most and this question requires
discipline to ensure that the group can begin the conversation to define the desired outcome is and develop criteria to work towards it.
3. “What will we do?”
a. This is where the plan moves from a vague thought to tangible steps that can be taken by each member of the group. Three main things occur:
i. The plan becomes more transparent and trust grows from transparency; ii. Shared responsibility is realized through distribution of responsibility; and iii. A written plan encourages accountability but also allows for flexibility. 4. “What’s our 30/30?”
49
b. This focuses on the activities that a participant has completed within the past 30 days and what they plan on completing in the next 30 days
50 Appendix C: 10 Rules of Strategic Doing
1. Create and maintain a safe space for deep, focused conversation; 2. Frame a conversation around an appreciative question;
3. Uncover hidden assets that people are willing to share; 4. Link and leverage your assets to create new opportunities; 5. Rank all your opportunities to find your “Big Easy”;
6. Convert your Big Easy into an outcome with measurable characteristics (Where you are going);
7. Define at least one Pathfinder Project with guideposts (How you will get there); 8. Draft a short-term action plan with everyone taking a small step;
9. Set a 30/30 meeting to review your progress and make adjustments; and
51 Appendix D: Questions for RBA
1. What is the ‘end’?”
a. During this phase, performance measures, indicators, and results should be determined. This is where the desired “end” is defined. This is also where what kind of accountability should be decided upon.
b. Criteria to follow includes communication power (whether an indicator has broad range of audiences and if they would pay attention), proxy power (whether an indicator continues with a herd of other data and is important), and data power (whether there is quality data that can be acquired in a timely manner).
2. “How are we doing?”
a. First, begin with a historic baseline of the indicator or performance measure and create a forecast for the future (which assumes current levels of effort). The baseline should consider at least five years of data and the forecast should be considered for three to five years (if possible).
3. “What is the story behind the curve of the baseline?”
a. Describe the “story” that makes up the baseline. This could include positive or negative factors or external and internal forces.
i. Then think about: What factors are supporting progress? What factors are restricting progress? Are these short-term or long-term factors?
4. “Who are partners who have a role to play in turning the curve?”
52 5. “What works to turn the curve?”
a. Brainstorming ideas to determine how to turn the curve of the baseline should include a variety of options, ranging from no cost to high cost. Then, further discussion should be had to determine the most effective options.
b. There are a variety of questions that can be asked, including:
i. Does the option address one or more of the root causes identified? ii. Is the proposed option evidence-based?
iii. Are there no-cost or low-cost options that have been considered?, and iv. Does additional research need to be completed?
v. “What do we propose to do to turn the curve?”
53
Appendix E: Combination Tool for Agile Strategy and Collective Impact
Step Question or Thought Process
Activities Responsible Party
1 What is the goal? Brainstorm with team to determine main goal of the group. Further,
determine key stakeholders.
Entire team.
2 Who needs to be involved?
Brainstorm and recruit key stakeholders. Consideration should
also be given to those who may cause barriers.
Team, key stakeholders, community or organization members. 3 Where are we starting
from?
Create a baseline view of the situation with facts, data and input
from stakeholders.
Team, key stakeholders, community or organization members. 4 What assets do we
have to use?
Identify assets that team members are willing to put forward for use in
the process.
Team members.
5 How do we use the assets that we have?
Brainstorm ways to combat the problem or move a program
forward.
Team members.
6 Which ideas are feasible and appropriate?
Narrow down the ideas. Team members, key stakeholders. 7 Which idea will we
follow and why?
Make a final decision on which idea to follow.
Team members, key stakeholders. 8 When we will meet
again?
Schedule a next meeting in a timeframe that is between 30 and
60 days.
Team members, others who may need to be
involved. 9 What are the activities
to focus on first?
Divide activities into
subcommittees or to team members to ensure each individual has work
to complete but it is distributed as equally as possible.
Team members, committee leads.
10 Evaluate activities completed and status
at each meeting before moving
forward.
Hold meeting to discuss activities completed, activities not completed, reshuffle assets if
necessary, determine new activities, distribute accordingly,
and plan next meeting.